| Tissue | Expression Dynamics | Abbreviation |
| Cervix | 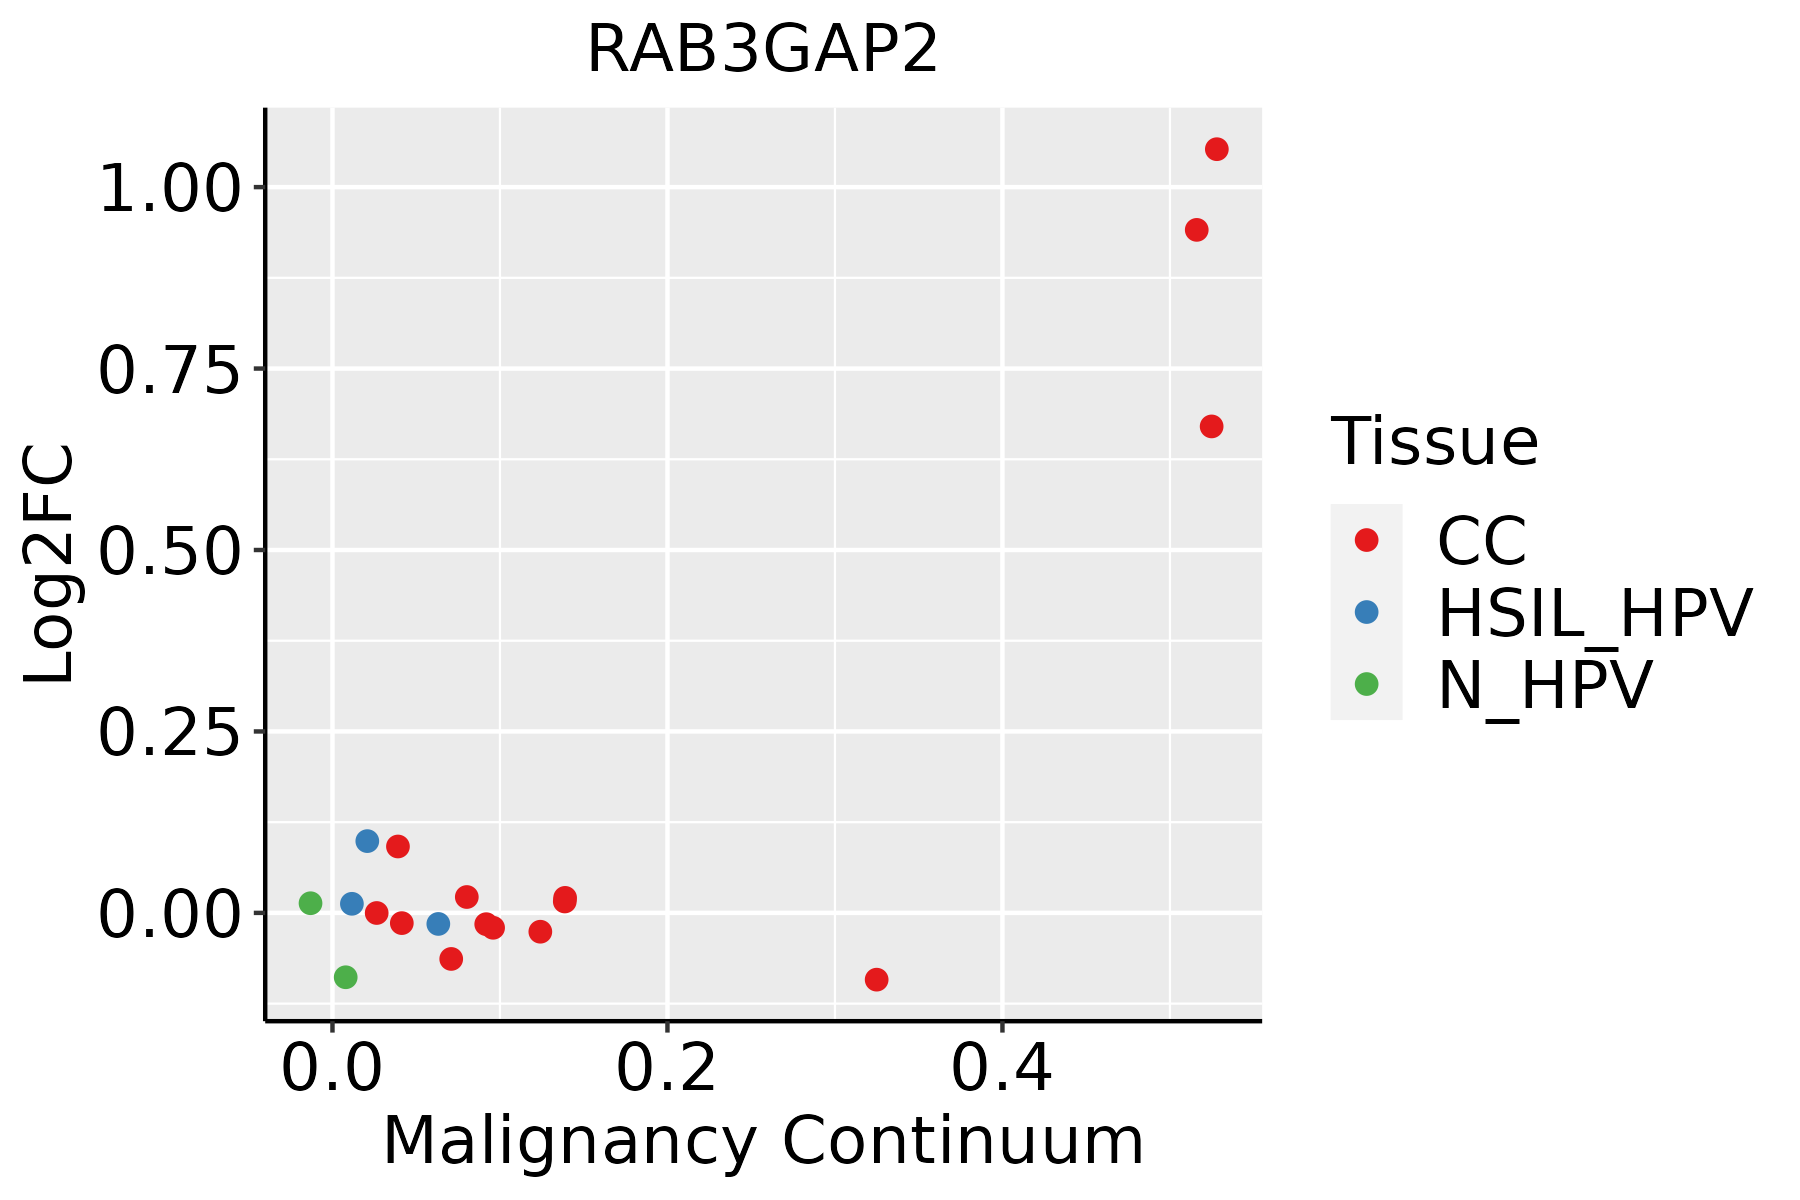 | CC: Cervix cancer |
| HSIL_HPV: HPV-infected high-grade squamous intraepithelial lesions |
| N_HPV: HPV-infected normal cervix |
| Esophagus |  | ESCC: Esophageal squamous cell carcinoma |
| HGIN: High-grade intraepithelial neoplasias |
| LGIN: Low-grade intraepithelial neoplasias |
| Liver | 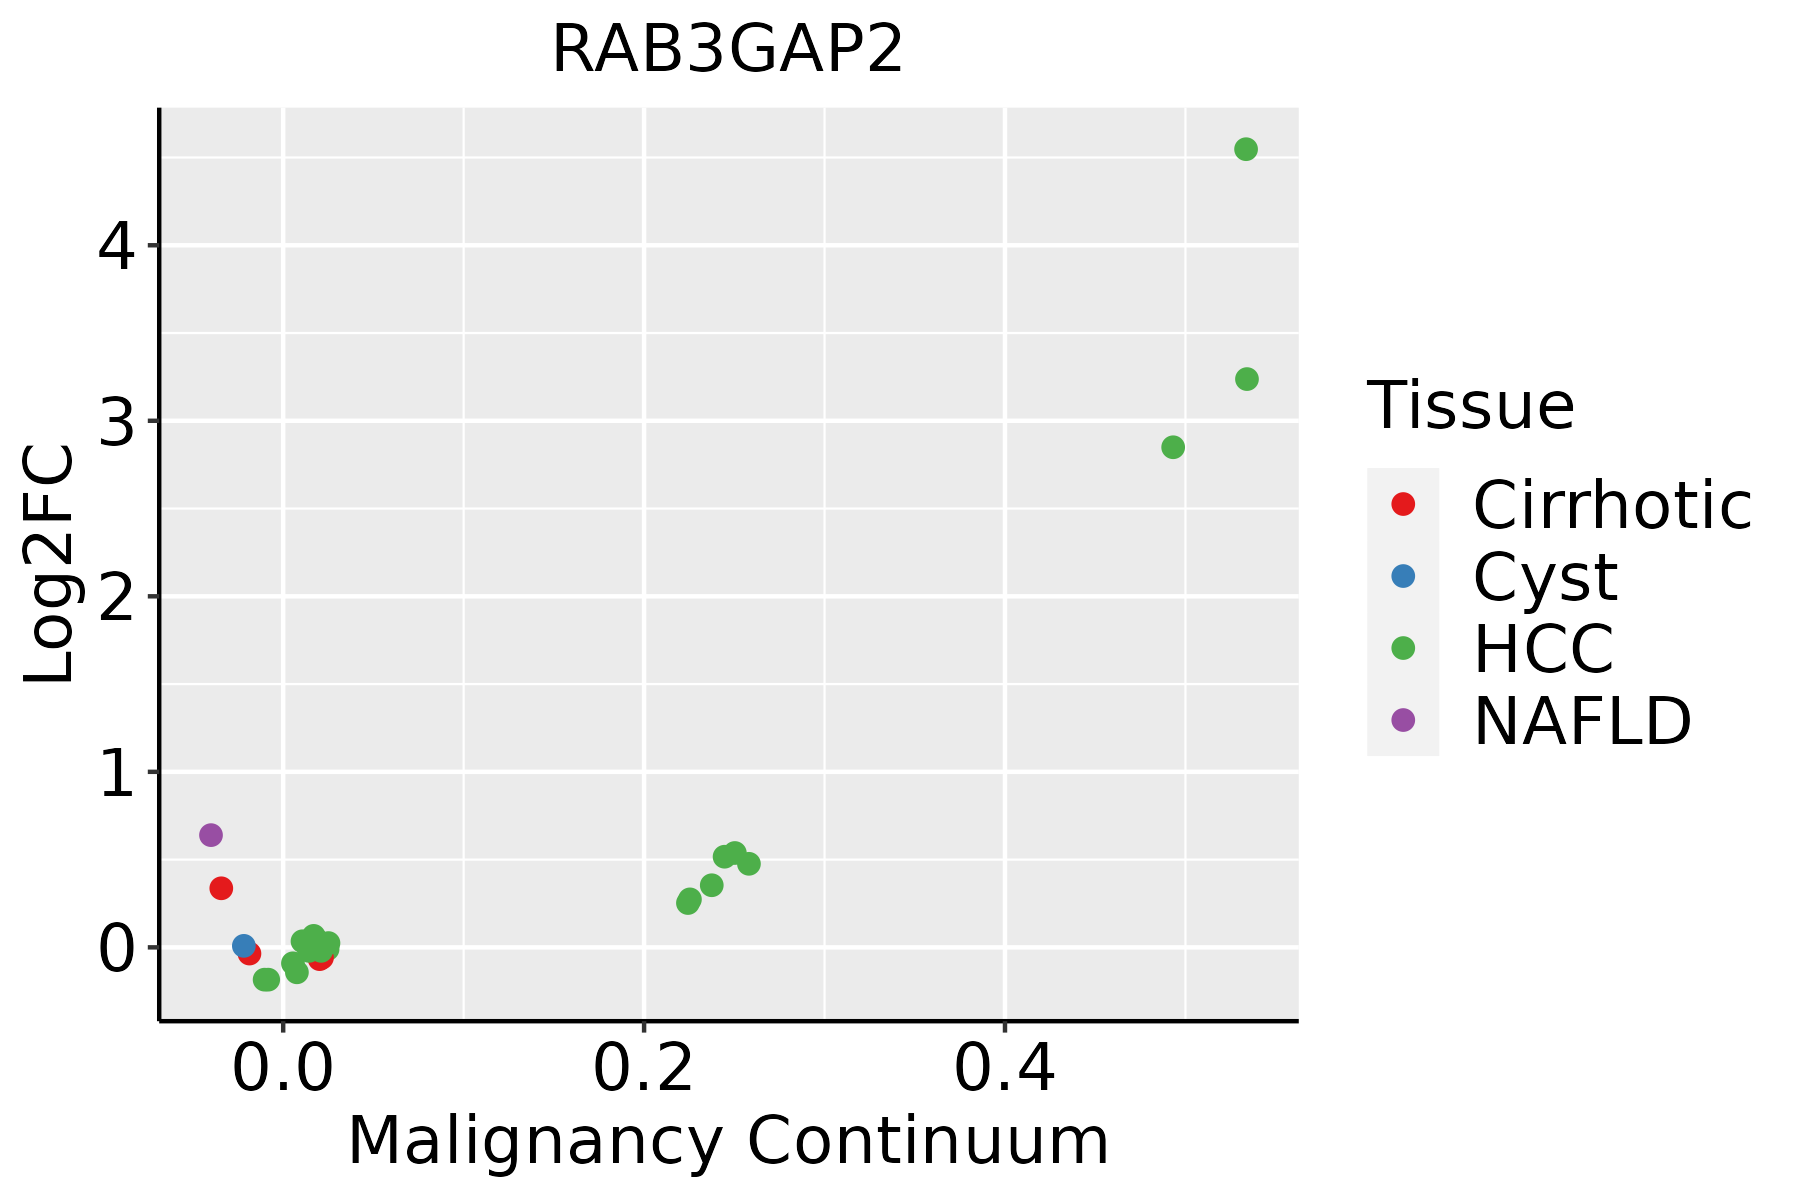 | HCC: Hepatocellular carcinoma |
| NAFLD: Non-alcoholic fatty liver disease |
| Lung | 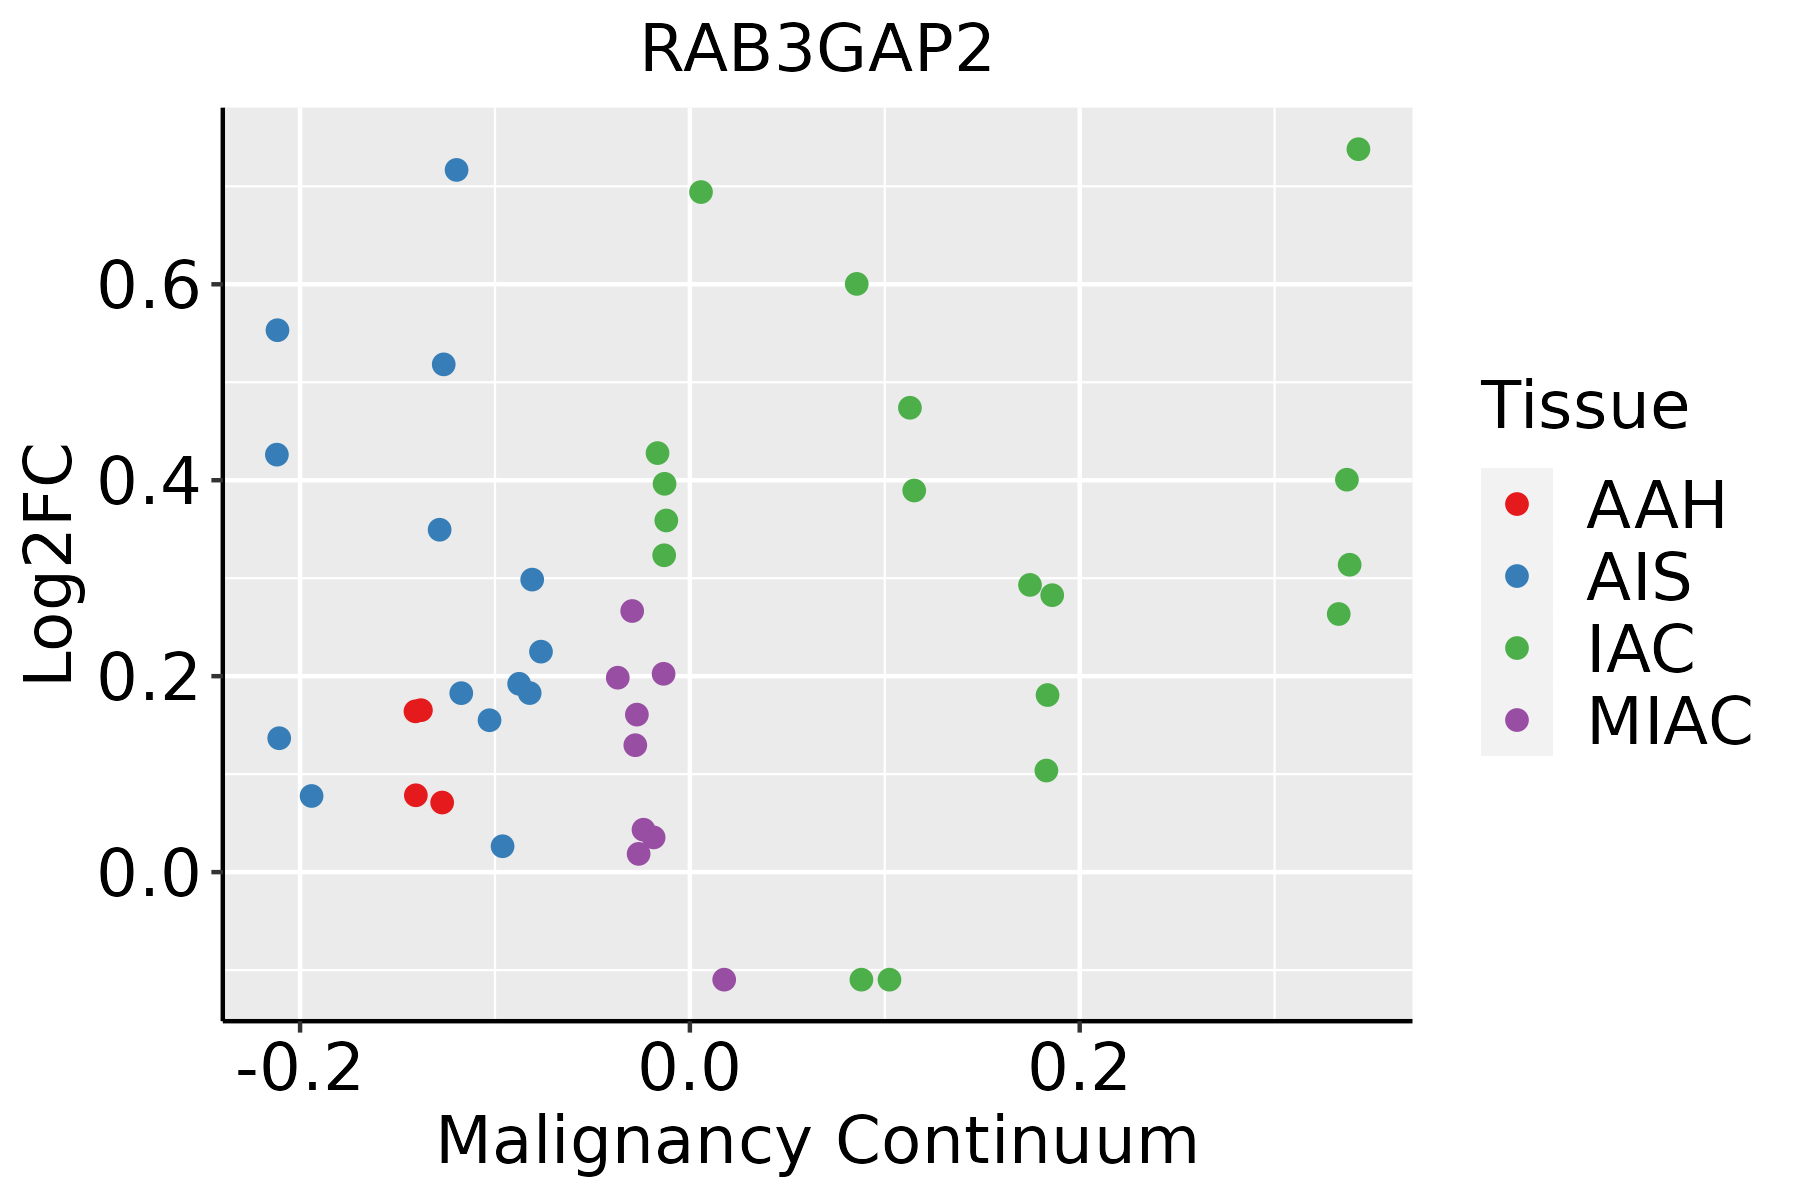 | AAH: Atypical adenomatous hyperplasia |
| AIS: Adenocarcinoma in situ |
| IAC: Invasive lung adenocarcinoma |
| MIA: Minimally invasive adenocarcinoma |
| Oral Cavity | 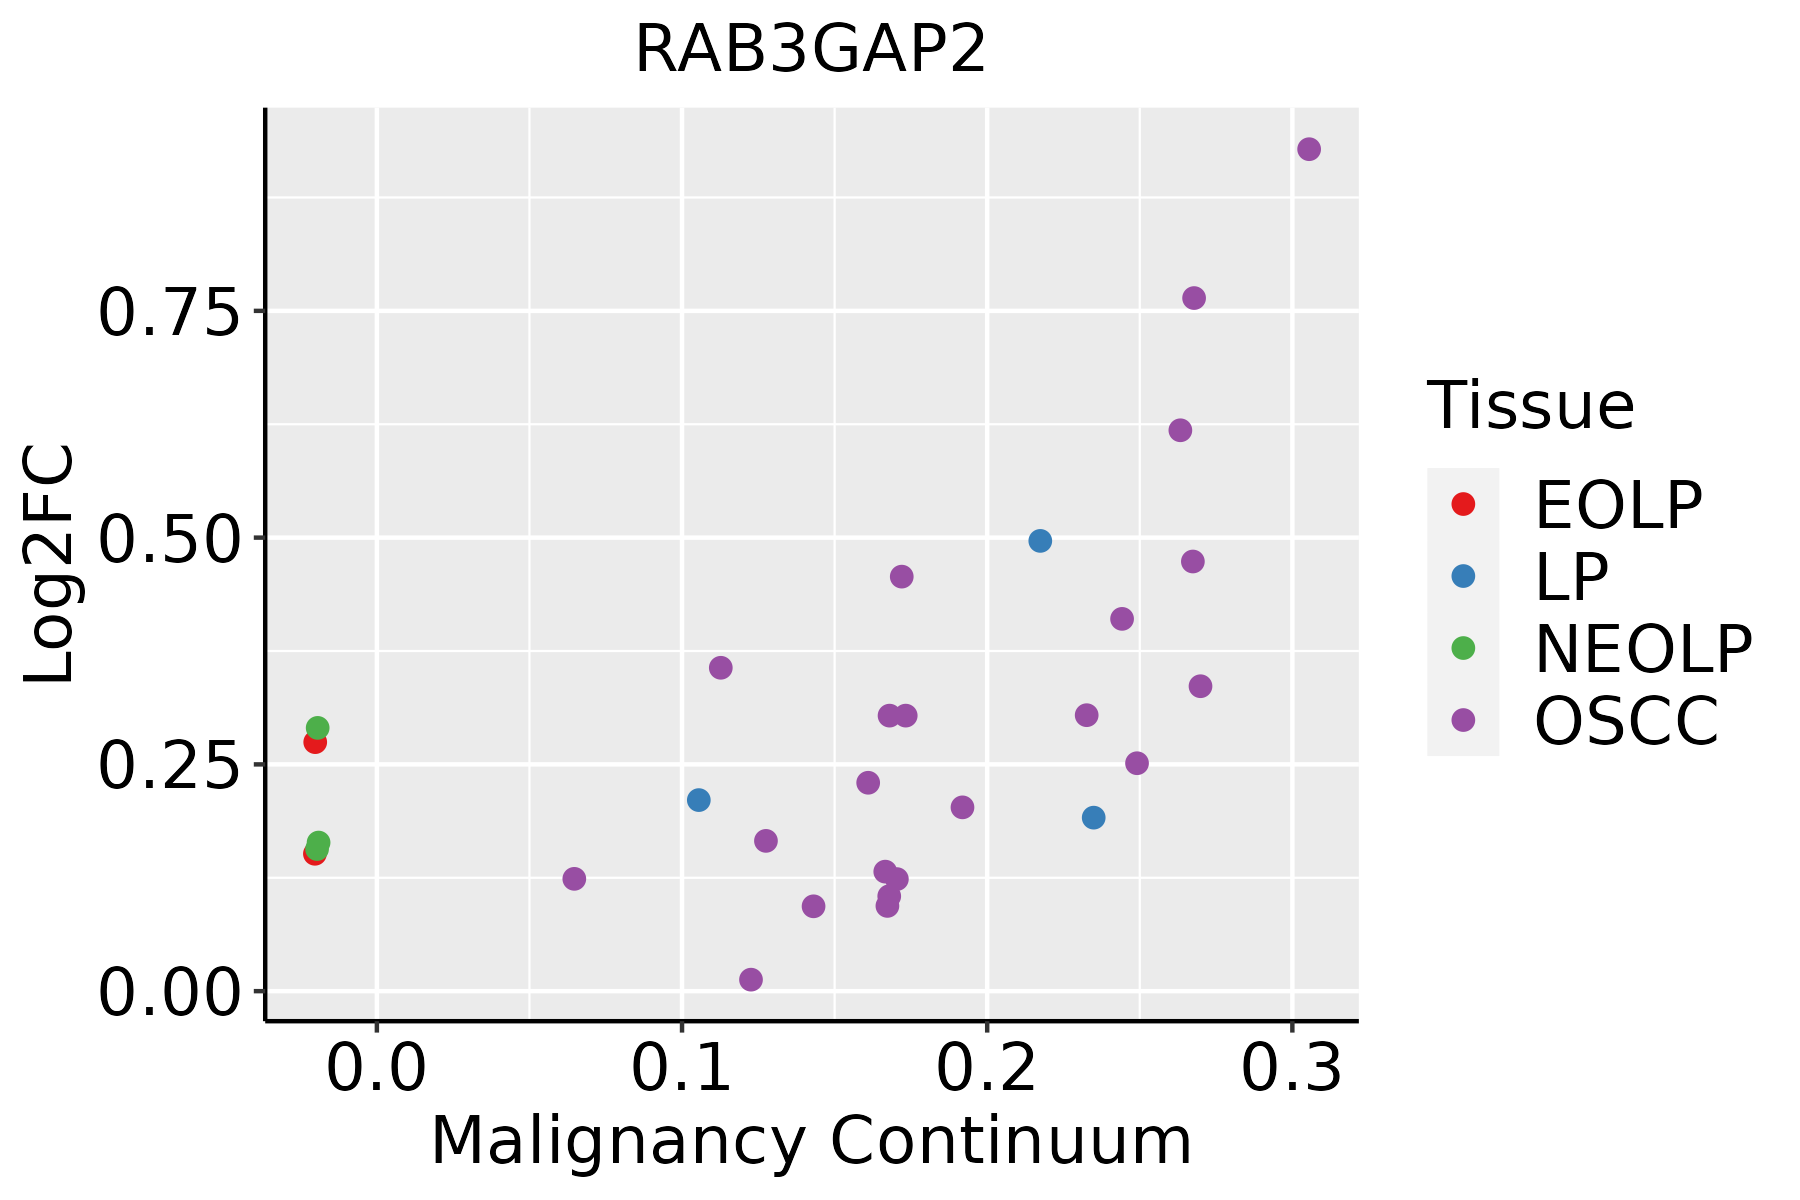 | EOLP: Erosive Oral lichen planus |
| LP: leukoplakia |
| NEOLP: Non-erosive oral lichen planus |
| OSCC: Oral squamous cell carcinoma |
| Thyroid |  | ATC: Anaplastic thyroid cancer |
| HT: Hashimoto's thyroiditis |
| PTC: Papillary thyroid cancer |
| GO ID | Tissue | Disease Stage | Description | Gene Ratio | Bg Ratio | pvalue | p.adjust | Count |
| GO:000702914 | Esophagus | ESCC | endoplasmic reticulum organization | 65/8552 | 87/18723 | 3.28e-08 | 6.08e-07 | 65 |
| GO:190503712 | Esophagus | ESCC | autophagosome organization | 73/8552 | 103/18723 | 1.88e-07 | 2.93e-06 | 73 |
| GO:000004513 | Esophagus | ESCC | autophagosome assembly | 69/8552 | 99/18723 | 1.10e-06 | 1.38e-05 | 69 |
| GO:190211514 | Esophagus | ESCC | regulation of organelle assembly | 116/8552 | 186/18723 | 3.15e-06 | 3.53e-05 | 116 |
| GO:001050816 | Esophagus | ESCC | positive regulation of autophagy | 81/8552 | 124/18723 | 7.74e-06 | 7.65e-05 | 81 |
| GO:007097218 | Esophagus | ESCC | protein localization to endoplasmic reticulum | 52/8552 | 74/18723 | 1.58e-05 | 1.42e-04 | 52 |
| GO:00421573 | Esophagus | ESCC | lipoprotein metabolic process | 86/8552 | 135/18723 | 1.78e-05 | 1.57e-04 | 86 |
| GO:00064973 | Esophagus | ESCC | protein lipidation | 62/8552 | 92/18723 | 2.08e-05 | 1.80e-04 | 62 |
| GO:00421583 | Esophagus | ESCC | lipoprotein biosynthetic process | 64/8552 | 96/18723 | 2.61e-05 | 2.20e-04 | 64 |
| GO:004408812 | Esophagus | ESCC | regulation of vacuole organization | 32/8552 | 45/18723 | 4.87e-04 | 2.70e-03 | 32 |
| GO:00717865 | Esophagus | ESCC | endoplasmic reticulum tubular network organization | 15/8552 | 18/18723 | 1.20e-03 | 5.88e-03 | 15 |
| GO:00162394 | Esophagus | ESCC | positive regulation of macroautophagy | 41/8552 | 63/18723 | 1.48e-03 | 6.99e-03 | 41 |
| GO:007259915 | Esophagus | ESCC | establishment of protein localization to endoplasmic reticulum | 31/8552 | 46/18723 | 2.42e-03 | 1.06e-02 | 31 |
| GO:200078512 | Esophagus | ESCC | regulation of autophagosome assembly | 27/8552 | 39/18723 | 2.52e-03 | 1.08e-02 | 27 |
| GO:19021174 | Esophagus | ESCC | positive regulation of organelle assembly | 42/8552 | 67/18723 | 3.72e-03 | 1.52e-02 | 42 |
| GO:004308715 | Esophagus | ESCC | regulation of GTPase activity | 183/8552 | 348/18723 | 5.34e-03 | 2.00e-02 | 183 |
| GO:00098967 | Liver | NAFLD | positive regulation of catabolic process | 108/1882 | 492/18723 | 2.68e-15 | 3.14e-12 | 108 |
| GO:00313317 | Liver | NAFLD | positive regulation of cellular catabolic process | 92/1882 | 427/18723 | 1.01e-12 | 4.91e-10 | 92 |
| GO:00430875 | Liver | NAFLD | regulation of GTPase activity | 62/1882 | 348/18723 | 5.65e-06 | 2.03e-04 | 62 |
| GO:00105065 | Liver | NAFLD | regulation of autophagy | 57/1882 | 317/18723 | 1.00e-05 | 3.18e-04 | 57 |
| Hugo Symbol | Variant Class | Variant Classification | dbSNP RS | HGVSc | HGVSp | HGVSp Short | SWISSPROT | BIOTYPE | SIFT | PolyPhen | Tumor Sample Barcode | Tissue | Histology | Sex | Age | Stage | Therapy Types | Drugs | Outcome |
| RAB3GAP2 | SNV | Missense_Mutation | | c.1387N>G | p.Gln463Glu | p.Q463E | Q9H2M9 | protein_coding | deleterious(0.02) | possibly_damaging(0.576) | TCGA-AC-A2FG-01 | Breast | breast invasive carcinoma | Female | >=65 | I/II | Hormone Therapy | arimidex | CR |
| RAB3GAP2 | SNV | Missense_Mutation | | c.2945N>C | p.Val982Ala | p.V982A | Q9H2M9 | protein_coding | tolerated(0.74) | benign(0) | TCGA-AN-A0XV-01 | Breast | breast invasive carcinoma | Female | >=65 | III/IV | Unknown | Unknown | SD |
| RAB3GAP2 | SNV | Missense_Mutation | novel | c.98N>A | p.Ala33Asp | p.A33D | Q9H2M9 | protein_coding | tolerated_low_confidence(0.36) | benign(0.165) | TCGA-B6-A0IA-01 | Breast | breast invasive carcinoma | Female | <65 | I/II | Unknown | Unknown | SD |
| RAB3GAP2 | SNV | Missense_Mutation | | c.2222N>G | p.Phe741Cys | p.F741C | Q9H2M9 | protein_coding | deleterious(0.01) | probably_damaging(0.935) | TCGA-BH-A0AZ-01 | Breast | breast invasive carcinoma | Female | <65 | III/IV | Chemotherapy | doxorubicin | CR |
| RAB3GAP2 | SNV | Missense_Mutation | | c.3200N>T | p.Ser1067Phe | p.S1067F | Q9H2M9 | protein_coding | deleterious(0) | probably_damaging(0.984) | TCGA-BH-A0B6-01 | Breast | breast invasive carcinoma | Female | <65 | I/II | Unknown | Unknown | SD |
| RAB3GAP2 | SNV | Missense_Mutation | | c.2416G>A | p.Val806Met | p.V806M | Q9H2M9 | protein_coding | tolerated(0.25) | possibly_damaging(0.875) | TCGA-BH-A0BZ-01 | Breast | breast invasive carcinoma | Female | <65 | III/IV | Chemotherapy | doxorubicin | CR |
| RAB3GAP2 | SNV | Missense_Mutation | | c.3859N>A | p.Gly1287Arg | p.G1287R | Q9H2M9 | protein_coding | deleterious(0) | possibly_damaging(0.894) | TCGA-BH-A0HF-01 | Breast | breast invasive carcinoma | Female | >=65 | I/II | Hormone Therapy | arimidex | SD |
| RAB3GAP2 | SNV | Missense_Mutation | | c.3476C>G | p.Ser1159Cys | p.S1159C | Q9H2M9 | protein_coding | tolerated(0.18) | benign(0.003) | TCGA-C8-A1HM-01 | Breast | breast invasive carcinoma | Female | >=65 | I/II | Chemotherapy | doxorubicin | CR |
| RAB3GAP2 | SNV | Missense_Mutation | | c.1847N>C | p.Leu616Ser | p.L616S | Q9H2M9 | protein_coding | deleterious(0.02) | benign(0.035) | TCGA-E2-A15A-06 | Breast | breast invasive carcinoma | Female | <65 | III/IV | Chemotherapy | cyclophosphamide | SD |
| RAB3GAP2 | insertion | Frame_Shift_Ins | novel | c.1276_1277insTCCTTGTTCTAATATTTTTACCATATTG | p.Arg426LeufsTer25 | p.R426Lfs*25 | Q9H2M9 | protein_coding | | | TCGA-A8-A07R-01 | Breast | breast invasive carcinoma | Female | >=65 | III/IV | Ancillary | zoledronic | SD |


