
|
|||||
|
 | |
| |
| |
| |
| |
| |
|
Gene: RAB3D |
Gene summary for RAB3D |
| Gene information | Species | Human | Gene symbol | RAB3D | Gene ID | 9545 |
| Gene name | RAB3D, member RAS oncogene family | |
| Gene Alias | D2-2 | |
| Cytomap | 19p13.2 | |
| Gene Type | protein-coding | GO ID | GO:0001894 | UniProtAcc | A0A024R7G2 |
Top |
Malignant transformation analysis |
| Identification of the aberrant gene expression in precancerous and cancerous lesions by comparing the gene expression of stem-like cells in diseased tissues with normal stem cells |
| Entrez ID | Symbol | Replicates | Species | Organ | Tissue | Adj P-value | Log2FC | Malignancy |
| 9545 | RAB3D | LZE8T | Human | Esophagus | ESCC | 1.30e-02 | 8.73e-02 | 0.067 |
| 9545 | RAB3D | LZE24T | Human | Esophagus | ESCC | 2.24e-06 | 2.23e-01 | 0.0596 |
| 9545 | RAB3D | P2T-E | Human | Esophagus | ESCC | 5.96e-09 | 1.32e-01 | 0.1177 |
| 9545 | RAB3D | P4T-E | Human | Esophagus | ESCC | 1.66e-19 | 2.47e-01 | 0.1323 |
| 9545 | RAB3D | P5T-E | Human | Esophagus | ESCC | 1.27e-07 | 7.12e-02 | 0.1327 |
| 9545 | RAB3D | P8T-E | Human | Esophagus | ESCC | 2.36e-10 | 3.17e-01 | 0.0889 |
| 9545 | RAB3D | P9T-E | Human | Esophagus | ESCC | 1.42e-05 | 8.72e-02 | 0.1131 |
| 9545 | RAB3D | P10T-E | Human | Esophagus | ESCC | 4.51e-11 | 1.02e-01 | 0.116 |
| 9545 | RAB3D | P12T-E | Human | Esophagus | ESCC | 8.66e-20 | 3.04e-01 | 0.1122 |
| 9545 | RAB3D | P15T-E | Human | Esophagus | ESCC | 2.70e-08 | 2.73e-01 | 0.1149 |
| 9545 | RAB3D | P16T-E | Human | Esophagus | ESCC | 3.51e-22 | 3.43e-01 | 0.1153 |
| 9545 | RAB3D | P19T-E | Human | Esophagus | ESCC | 9.49e-06 | 3.94e-01 | 0.1662 |
| 9545 | RAB3D | P20T-E | Human | Esophagus | ESCC | 4.03e-10 | 2.73e-01 | 0.1124 |
| 9545 | RAB3D | P21T-E | Human | Esophagus | ESCC | 1.87e-17 | 3.61e-01 | 0.1617 |
| 9545 | RAB3D | P22T-E | Human | Esophagus | ESCC | 9.11e-18 | 2.52e-01 | 0.1236 |
| 9545 | RAB3D | P23T-E | Human | Esophagus | ESCC | 5.18e-17 | 3.87e-01 | 0.108 |
| 9545 | RAB3D | P24T-E | Human | Esophagus | ESCC | 5.09e-06 | 1.98e-01 | 0.1287 |
| 9545 | RAB3D | P26T-E | Human | Esophagus | ESCC | 1.79e-07 | 1.36e-01 | 0.1276 |
| 9545 | RAB3D | P27T-E | Human | Esophagus | ESCC | 6.17e-14 | 3.03e-01 | 0.1055 |
| 9545 | RAB3D | P28T-E | Human | Esophagus | ESCC | 6.89e-26 | 5.39e-01 | 0.1149 |
| Page: 1 2 3 4 5 |
| Tissue | Expression Dynamics | Abbreviation |
| Esophagus | 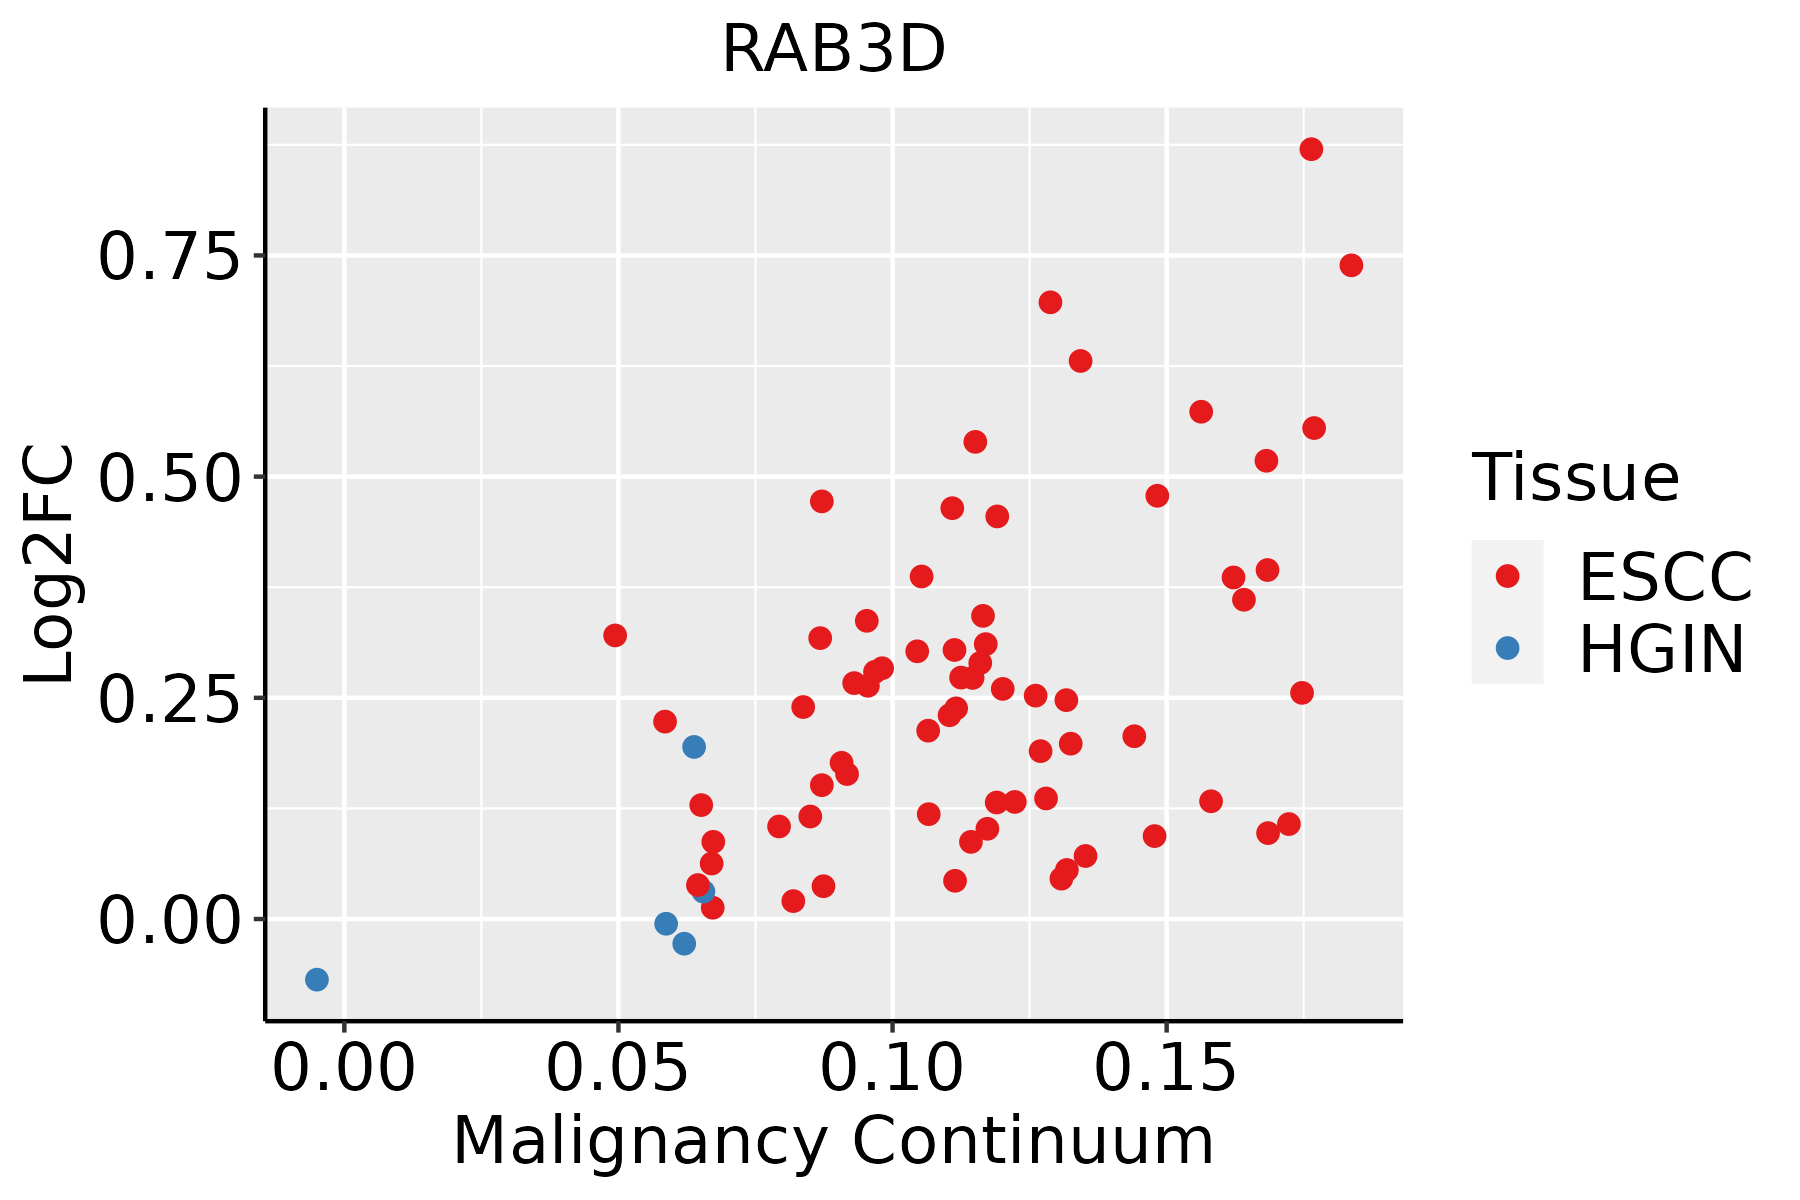 | ESCC: Esophageal squamous cell carcinoma |
| HGIN: High-grade intraepithelial neoplasias | ||
| LGIN: Low-grade intraepithelial neoplasias | ||
| Oral Cavity | 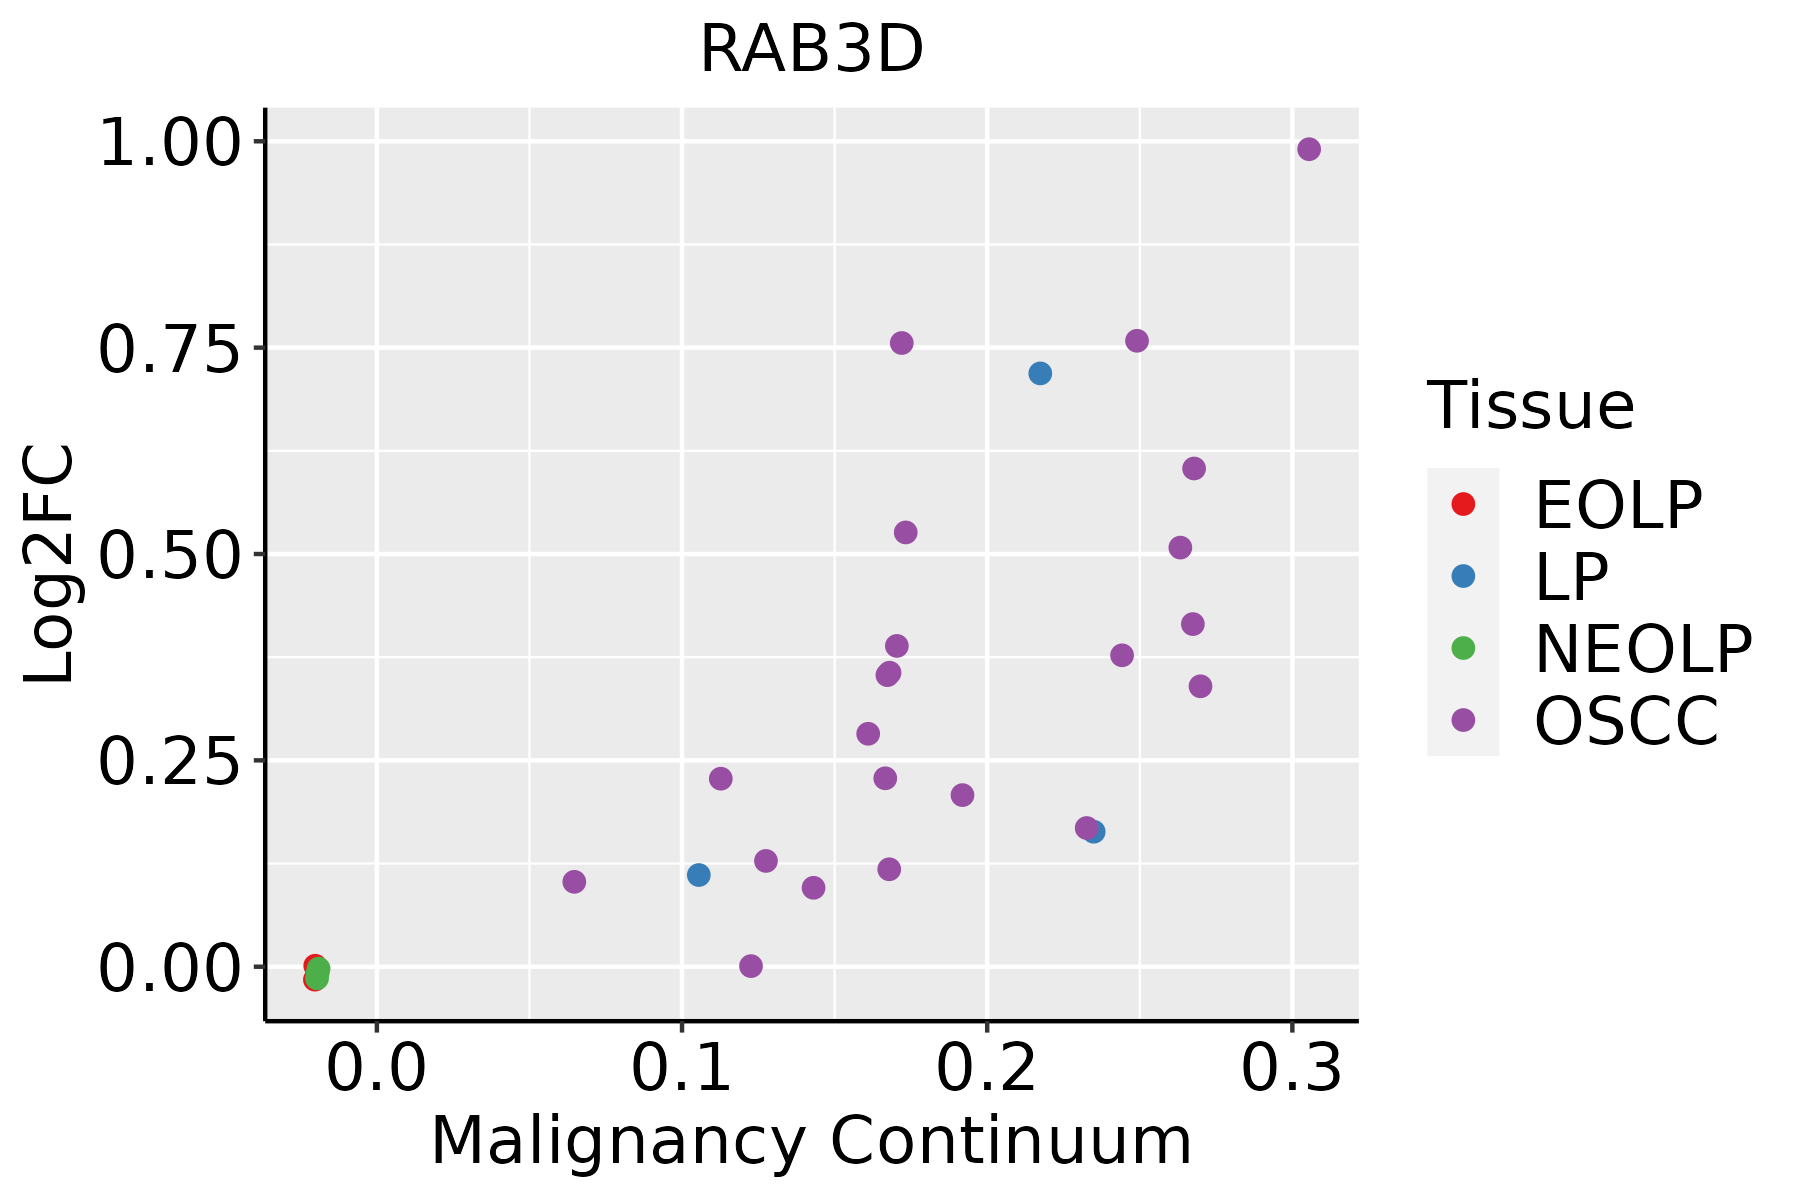 | EOLP: Erosive Oral lichen planus |
| LP: leukoplakia | ||
| NEOLP: Non-erosive oral lichen planus | ||
| OSCC: Oral squamous cell carcinoma | ||
| Prostate |  | BPH: Benign Prostatic Hyperplasia |
| Skin | 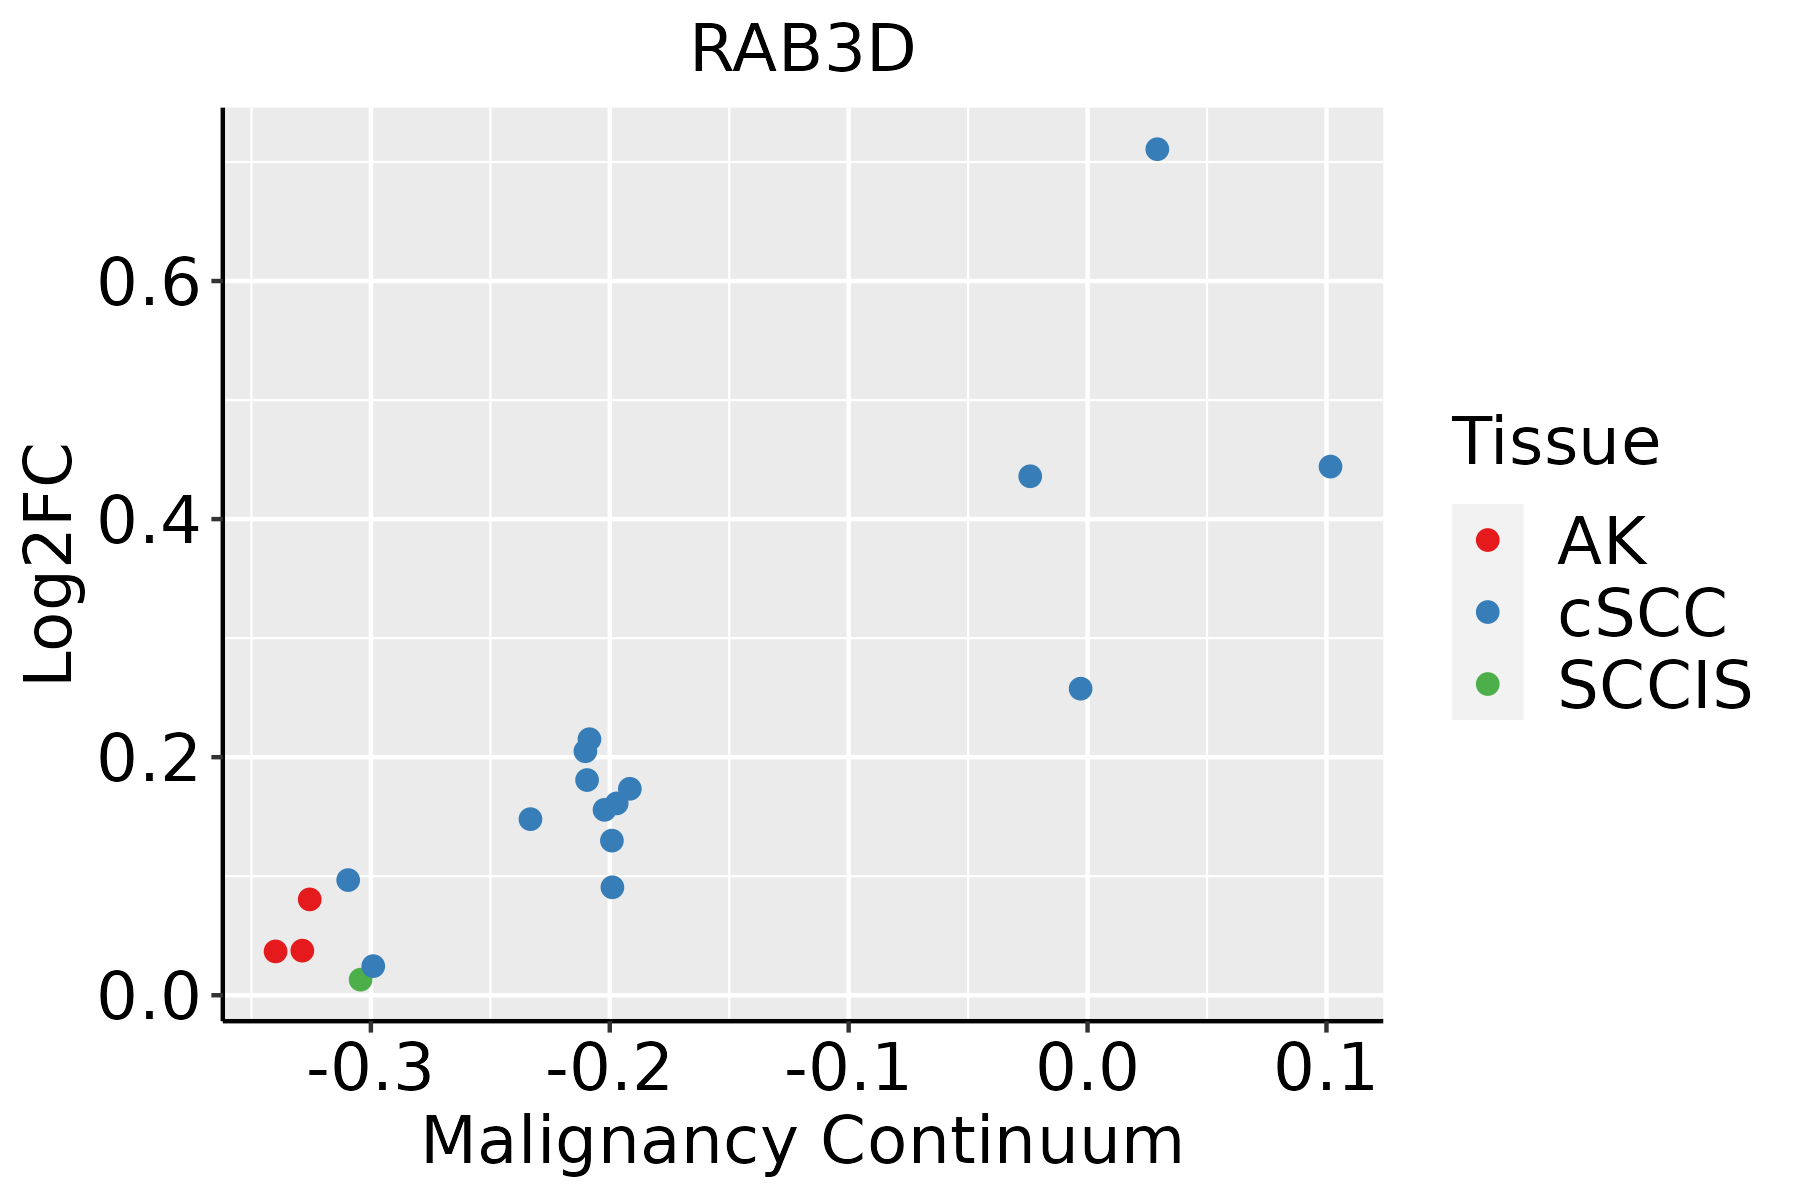 | AK: Actinic keratosis |
| cSCC: Cutaneous squamous cell carcinoma | ||
| SCCIS:squamous cell carcinoma in situ |
| ∗log2FC in expression of this searched gene in stem-like cells from each diseased tissue sample relative to stem-like cells in normal samples in each tissue plotted against the malignancy continuum. Samples are colored based on if they are from different disease stage. |
Top |
Malignant transformation related pathway analysis |
| Find out the enriched GO biological processes and KEGG pathways involved in transition from healthy to precancer to cancer |
| Tissue | Disease Stage | Enriched GO biological Processes |
| Colorectum | AD |  |
| Colorectum | SER |  |
| Colorectum | MSS |  |
| Colorectum | MSI-H |  |
| Colorectum | FAP |  |
| ∗Top 15 enriched GO BP terms are showed in the bar plot of each disease state in each tissue. Each row represents a significant GO biological process which is colored according to the -log10(p.adjust). |
| Page: 1 2 3 4 5 6 7 8 9 |
| GO ID | Tissue | Disease Stage | Description | Gene Ratio | Bg Ratio | pvalue | p.adjust | Count |
| GO:00434142 | Oral cavity | OSCC | macromolecule methylation | 149/7305 | 316/18723 | 1.82e-03 | 8.60e-03 | 149 |
| GO:01400566 | Oral cavity | OSCC | organelle localization by membrane tethering | 43/7305 | 77/18723 | 2.00e-03 | 9.28e-03 | 43 |
| GO:00322591 | Oral cavity | OSCC | methylation | 168/7305 | 364/18723 | 3.03e-03 | 1.31e-02 | 168 |
| GO:00487713 | Oral cavity | OSCC | tissue remodeling | 84/7305 | 175/18723 | 9.39e-03 | 3.36e-02 | 84 |
| GO:0045453 | Oral cavity | OSCC | bone resorption | 35/7305 | 65/18723 | 1.07e-02 | 3.64e-02 | 35 |
| GO:007265919 | Oral cavity | LP | protein localization to plasma membrane | 119/4623 | 284/18723 | 1.11e-10 | 6.44e-09 | 119 |
| GO:199077817 | Oral cavity | LP | protein localization to cell periphery | 133/4623 | 333/18723 | 4.42e-10 | 2.21e-08 | 133 |
| GO:002240613 | Oral cavity | LP | membrane docking | 38/4623 | 86/18723 | 5.97e-05 | 8.13e-04 | 38 |
| GO:014005612 | Oral cavity | LP | organelle localization by membrane tethering | 31/4623 | 77/18723 | 1.83e-03 | 1.38e-02 | 31 |
| GO:0018198 | Oral cavity | LP | peptidyl-cysteine modification | 20/4623 | 49/18723 | 9.35e-03 | 4.98e-02 | 20 |
| GO:007265917 | Prostate | Tumor | protein localization to plasma membrane | 90/3246 | 284/18723 | 2.07e-09 | 8.99e-08 | 90 |
| GO:199077815 | Prostate | Tumor | protein localization to cell periphery | 97/3246 | 333/18723 | 5.88e-08 | 1.75e-06 | 97 |
| GO:000647912 | Prostate | Tumor | protein methylation | 52/3246 | 181/18723 | 9.58e-05 | 9.35e-04 | 52 |
| GO:000821312 | Prostate | Tumor | protein alkylation | 52/3246 | 181/18723 | 9.58e-05 | 9.35e-04 | 52 |
| GO:007169214 | Prostate | Tumor | protein localization to extracellular region | 89/3246 | 368/18723 | 4.80e-04 | 3.57e-03 | 89 |
| GO:000930615 | Prostate | Tumor | protein secretion | 87/3246 | 359/18723 | 5.15e-04 | 3.78e-03 | 87 |
| GO:003559215 | Prostate | Tumor | establishment of protein localization to extracellular region | 87/3246 | 360/18723 | 5.65e-04 | 4.10e-03 | 87 |
| GO:002240612 | Prostate | Tumor | membrane docking | 26/3246 | 86/18723 | 2.29e-03 | 1.29e-02 | 26 |
| GO:000189416 | Prostate | Tumor | tissue homeostasis | 65/3246 | 268/18723 | 2.39e-03 | 1.35e-02 | 65 |
| GO:006024915 | Prostate | Tumor | anatomical structure homeostasis | 74/3246 | 314/18723 | 2.82e-03 | 1.54e-02 | 74 |
| Page: 1 2 3 |
| Pathway ID | Tissue | Disease Stage | Description | Gene Ratio | Bg Ratio | pvalue | p.adjust | qvalue | Count |
| Page: 1 |
Top |
Cell-cell communication analysis |
| Identification of potential cell-cell interactions between two cell types and their ligand-receptor pairs for different disease states |
| Ligand | Receptor | LRpair | Pathway | Tissue | Disease Stage |
| Page: 1 |
Top |
Single-cell gene regulatory network inference analysis |
| Find out the significant the regulons (TFs) and the target genes of each regulon across cell types for different disease states |
| TF | Cell Type | Tissue | Disease Stage | Target Gene | RSS | Regulon Activity |
| ∗The dot plots of a searched regulon are shown for all cell subpopulations in each disease state of each tissue based on the regulon specific score inferred using pySCENIC and by calculating the average expression. |
| Page: 1 |
Top |
Somatic mutation of malignant transformation related genes |
| Annotation of somatic variants for genes involved in malignant transformation |
| Hugo Symbol | Variant Class | Variant Classification | dbSNP RS | HGVSc | HGVSp | HGVSp Short | SWISSPROT | BIOTYPE | SIFT | PolyPhen | Tumor Sample Barcode | Tissue | Histology | Sex | Age | Stage | Therapy Types | Drugs | Outcome |
| RAB3D | SNV | Missense_Mutation | rs144435530 | c.313G>A | p.Ala105Thr | p.A105T | O95716 | protein_coding | tolerated(1) | benign(0) | TCGA-AO-A128-01 | Breast | breast invasive carcinoma | Female | <65 | I/II | Chemotherapy | doxorubicin | SD |
| RAB3D | SNV | Missense_Mutation | c.442N>A | p.Glu148Lys | p.E148K | O95716 | protein_coding | deleterious(0.02) | possibly_damaging(0.593) | TCGA-BH-A0B6-01 | Breast | breast invasive carcinoma | Female | <65 | I/II | Unknown | Unknown | SD | |
| RAB3D | insertion | In_Frame_Ins | novel | c.52_53insCCTCGGCCTCCCAAAGCGCTGGGATTACAGGCATGAGCC | p.Asn18delinsThrSerAlaSerGlnSerAlaGlyIleThrGlyMetSerHis | p.N18delinsTSASQSAGITGMSH | O95716 | protein_coding | TCGA-BH-A0HU-01 | Breast | breast invasive carcinoma | Female | <65 | I/II | Chemotherapy | docetaxel | SD | ||
| RAB3D | SNV | Missense_Mutation | c.442N>A | p.Glu148Lys | p.E148K | O95716 | protein_coding | deleterious(0.02) | possibly_damaging(0.593) | TCGA-DR-A0ZM-01 | Cervix | cervical & endocervical cancer | Female | <65 | III/IV | Unspecific | Cisplatin | SD | |
| RAB3D | SNV | Missense_Mutation | rs144435530 | c.313N>A | p.Ala105Thr | p.A105T | O95716 | protein_coding | tolerated(1) | benign(0) | TCGA-VS-A959-01 | Cervix | cervical & endocervical cancer | Female | >=65 | I/II | Unknown | Unknown | SD |
| RAB3D | SNV | Missense_Mutation | rs762283527 | c.427N>T | p.Arg143Cys | p.R143C | O95716 | protein_coding | deleterious(0) | probably_damaging(0.99) | TCGA-AA-3819-01 | Colorectum | colon adenocarcinoma | Female | <65 | I/II | Unknown | Unknown | SD |
| RAB3D | SNV | Missense_Mutation | c.235G>A | p.Ala79Thr | p.A79T | O95716 | protein_coding | deleterious(0) | probably_damaging(1) | TCGA-AA-A01P-01 | Colorectum | colon adenocarcinoma | Female | >=65 | III/IV | Unknown | Unknown | PD | |
| RAB3D | SNV | Missense_Mutation | rs145958698 | c.452N>A | p.Arg151Gln | p.R151Q | O95716 | protein_coding | tolerated(0.88) | benign(0) | TCGA-AA-A01R-01 | Colorectum | colon adenocarcinoma | Male | <65 | III/IV | Chemotherapy | 5-fluorouracil | PD |
| RAB3D | SNV | Missense_Mutation | c.483C>A | p.Phe161Leu | p.F161L | O95716 | protein_coding | deleterious(0) | benign(0.442) | TCGA-CA-6717-01 | Colorectum | colon adenocarcinoma | Male | <65 | I/II | Chemotherapy | oxaliplatin | CR | |
| RAB3D | SNV | Missense_Mutation | c.408G>T | p.Lys136Asn | p.K136N | O95716 | protein_coding | deleterious(0.01) | probably_damaging(0.991) | TCGA-CM-6165-01 | Colorectum | colon adenocarcinoma | Male | >=65 | I/II | Unknown | Unknown | SD |
| Page: 1 2 |
Top |
Related drugs of malignant transformation related genes |
| Identification of chemicals and drugs interact with genes involved in malignant transfromation |
| (DGIdb 4.0) |
| Entrez ID | Symbol | Category | Interaction Types | Drug Claim Name | Drug Name | PMIDs |
| Page: 1 |

Copyright 2023-Present -The University of Texas Health Science Center at Houston |