
|
|||||
|
 | |
| |
| |
| |
| |
| |
|
Gene: PUS7 |
Gene summary for PUS7 |
| Gene information | Species | Human | Gene symbol | PUS7 | Gene ID | 54517 |
| Gene name | pseudouridine synthase 7 | |
| Gene Alias | IDDABS | |
| Cytomap | 7q22.3 | |
| Gene Type | protein-coding | GO ID | GO:0001522 | UniProtAcc | B3KY42 |
Top |
Malignant transformation analysis |
| Identification of the aberrant gene expression in precancerous and cancerous lesions by comparing the gene expression of stem-like cells in diseased tissues with normal stem cells |
| Entrez ID | Symbol | Replicates | Species | Organ | Tissue | Adj P-value | Log2FC | Malignancy |
| 54517 | PUS7 | CCI_2 | Human | Cervix | CC | 1.17e-08 | 6.56e-01 | 0.5249 |
| 54517 | PUS7 | CCI_3 | Human | Cervix | CC | 1.82e-12 | 5.89e-01 | 0.516 |
| 54517 | PUS7 | LZE4T | Human | Esophagus | ESCC | 8.42e-08 | 1.75e-01 | 0.0811 |
| 54517 | PUS7 | LZE7T | Human | Esophagus | ESCC | 3.45e-06 | 3.36e-01 | 0.0667 |
| 54517 | PUS7 | LZE24T | Human | Esophagus | ESCC | 5.77e-04 | 1.51e-01 | 0.0596 |
| 54517 | PUS7 | P2T-E | Human | Esophagus | ESCC | 1.57e-11 | 1.72e-01 | 0.1177 |
| 54517 | PUS7 | P4T-E | Human | Esophagus | ESCC | 4.37e-10 | 3.62e-01 | 0.1323 |
| 54517 | PUS7 | P5T-E | Human | Esophagus | ESCC | 2.77e-17 | 2.86e-01 | 0.1327 |
| 54517 | PUS7 | P9T-E | Human | Esophagus | ESCC | 3.37e-09 | 3.31e-01 | 0.1131 |
| 54517 | PUS7 | P10T-E | Human | Esophagus | ESCC | 1.62e-13 | 2.26e-01 | 0.116 |
| 54517 | PUS7 | P11T-E | Human | Esophagus | ESCC | 2.33e-08 | 4.79e-01 | 0.1426 |
| 54517 | PUS7 | P12T-E | Human | Esophagus | ESCC | 1.87e-28 | 5.02e-01 | 0.1122 |
| 54517 | PUS7 | P15T-E | Human | Esophagus | ESCC | 6.89e-20 | 5.86e-01 | 0.1149 |
| 54517 | PUS7 | P16T-E | Human | Esophagus | ESCC | 5.13e-31 | 6.06e-01 | 0.1153 |
| 54517 | PUS7 | P17T-E | Human | Esophagus | ESCC | 2.28e-10 | 5.12e-01 | 0.1278 |
| 54517 | PUS7 | P19T-E | Human | Esophagus | ESCC | 1.85e-03 | 4.43e-01 | 0.1662 |
| 54517 | PUS7 | P20T-E | Human | Esophagus | ESCC | 1.06e-34 | 9.31e-01 | 0.1124 |
| 54517 | PUS7 | P21T-E | Human | Esophagus | ESCC | 7.32e-38 | 6.83e-01 | 0.1617 |
| 54517 | PUS7 | P22T-E | Human | Esophagus | ESCC | 1.92e-16 | 3.17e-01 | 0.1236 |
| 54517 | PUS7 | P23T-E | Human | Esophagus | ESCC | 3.52e-38 | 9.85e-01 | 0.108 |
| Page: 1 2 3 4 5 |
| Tissue | Expression Dynamics | Abbreviation |
| Cervix |  | CC: Cervix cancer |
| HSIL_HPV: HPV-infected high-grade squamous intraepithelial lesions | ||
| N_HPV: HPV-infected normal cervix | ||
| Esophagus | 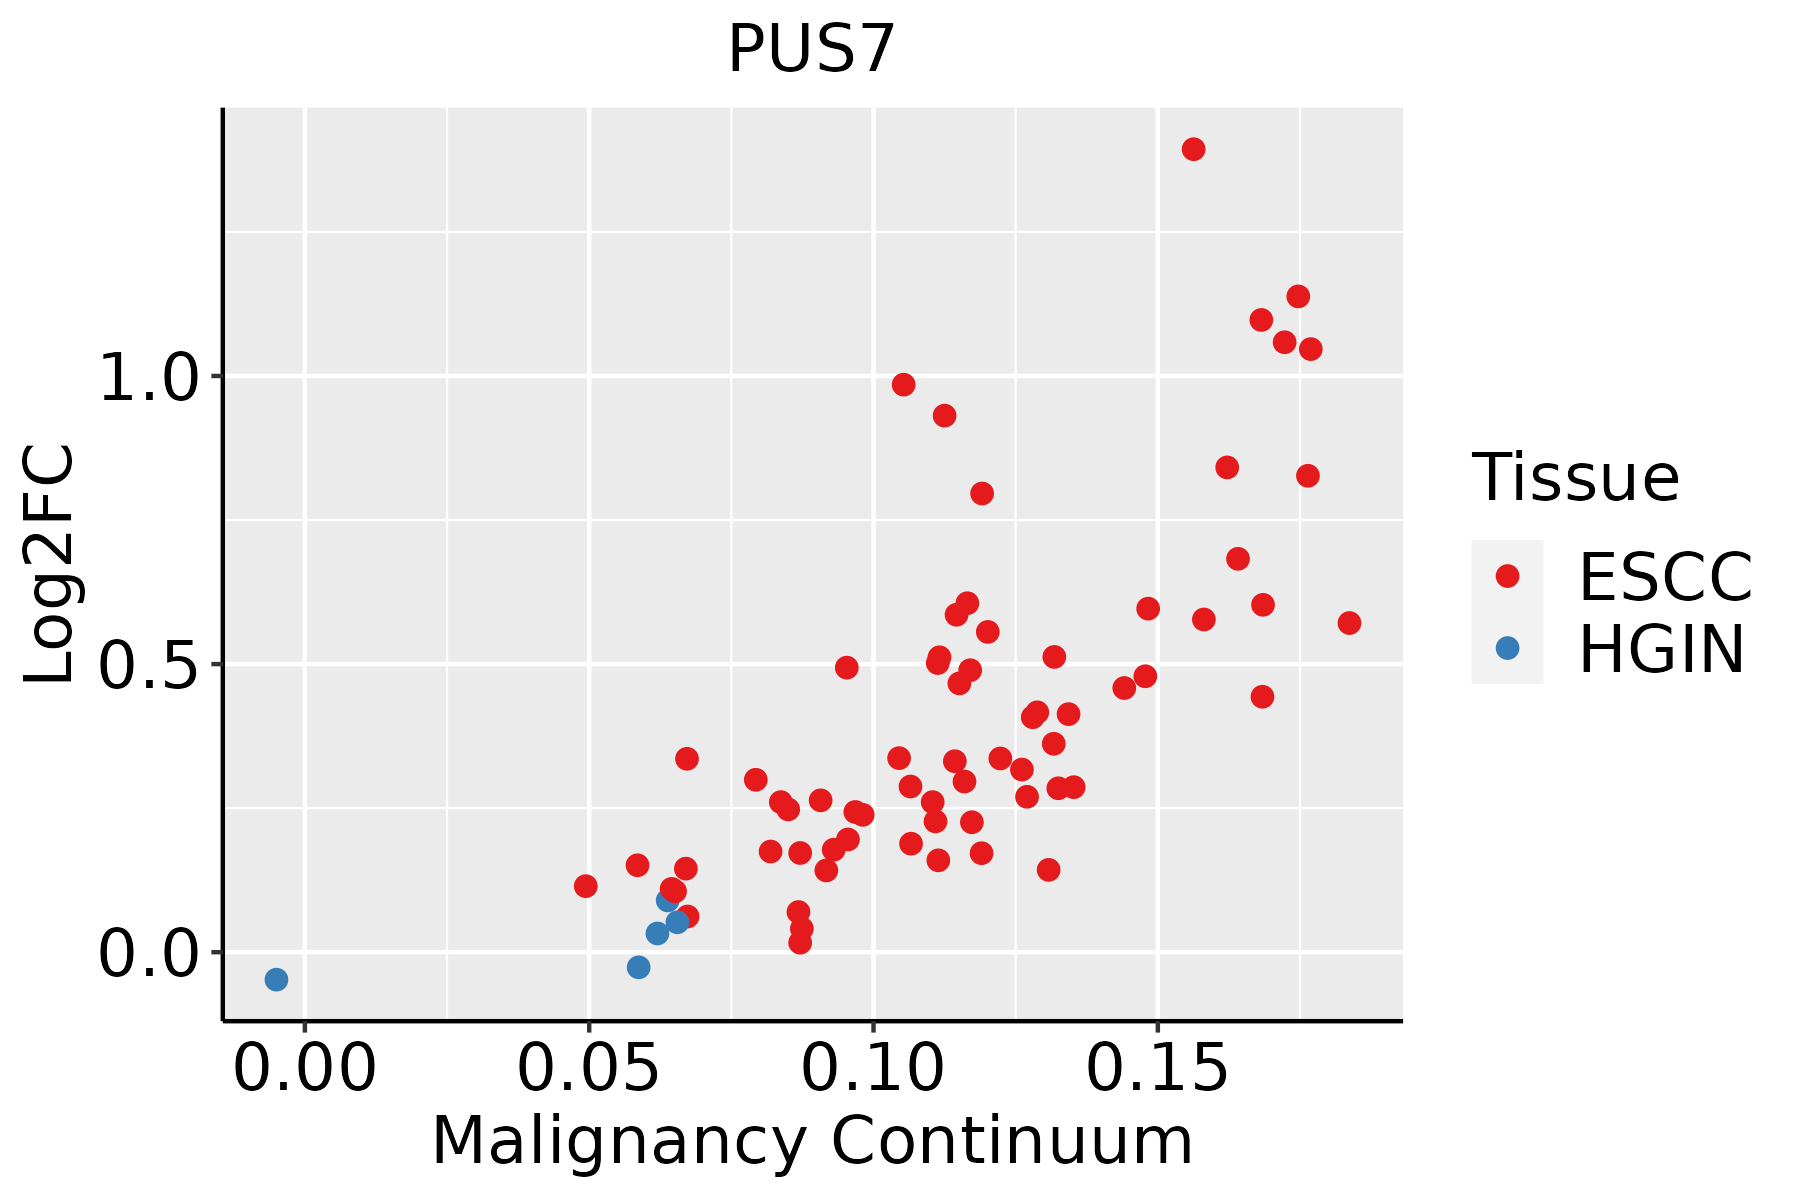 | ESCC: Esophageal squamous cell carcinoma |
| HGIN: High-grade intraepithelial neoplasias | ||
| LGIN: Low-grade intraepithelial neoplasias | ||
| Liver | 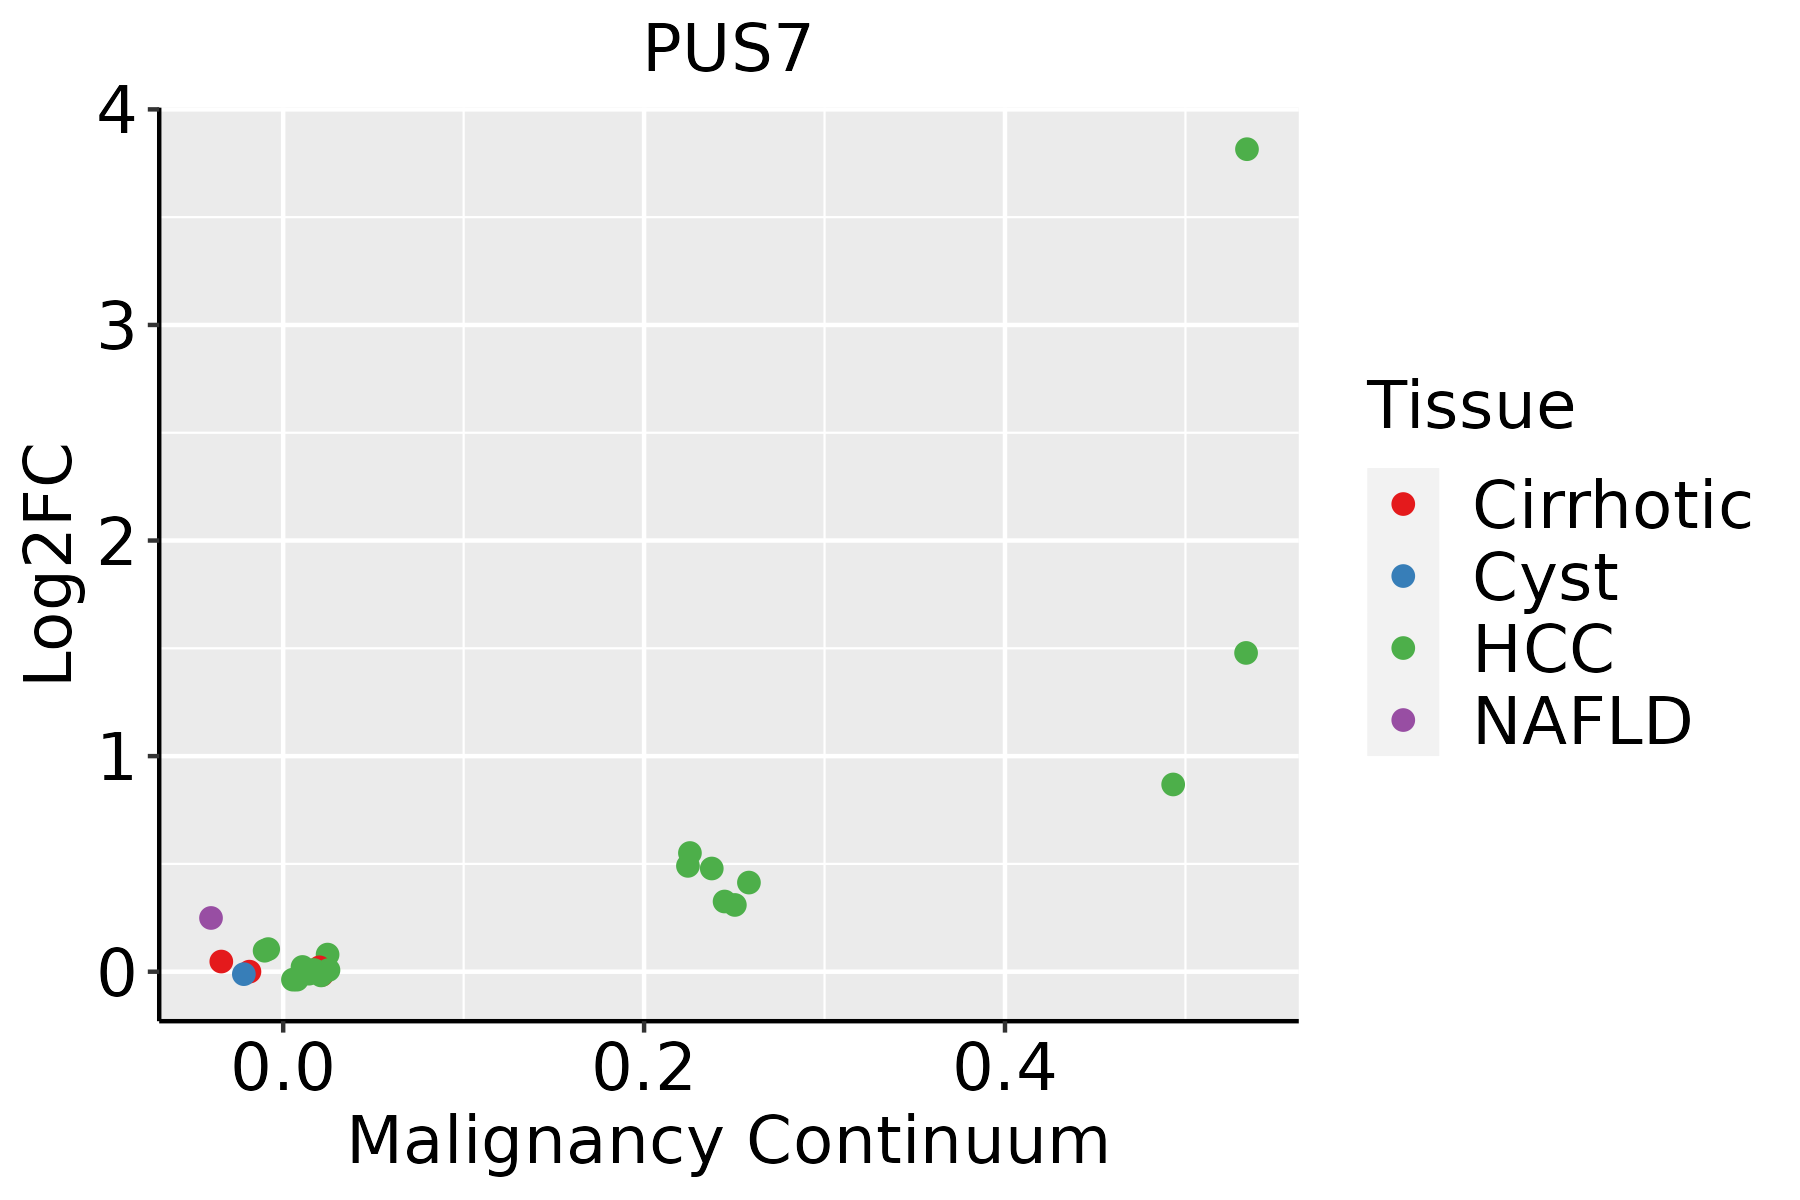 | HCC: Hepatocellular carcinoma |
| NAFLD: Non-alcoholic fatty liver disease | ||
| Oral Cavity | 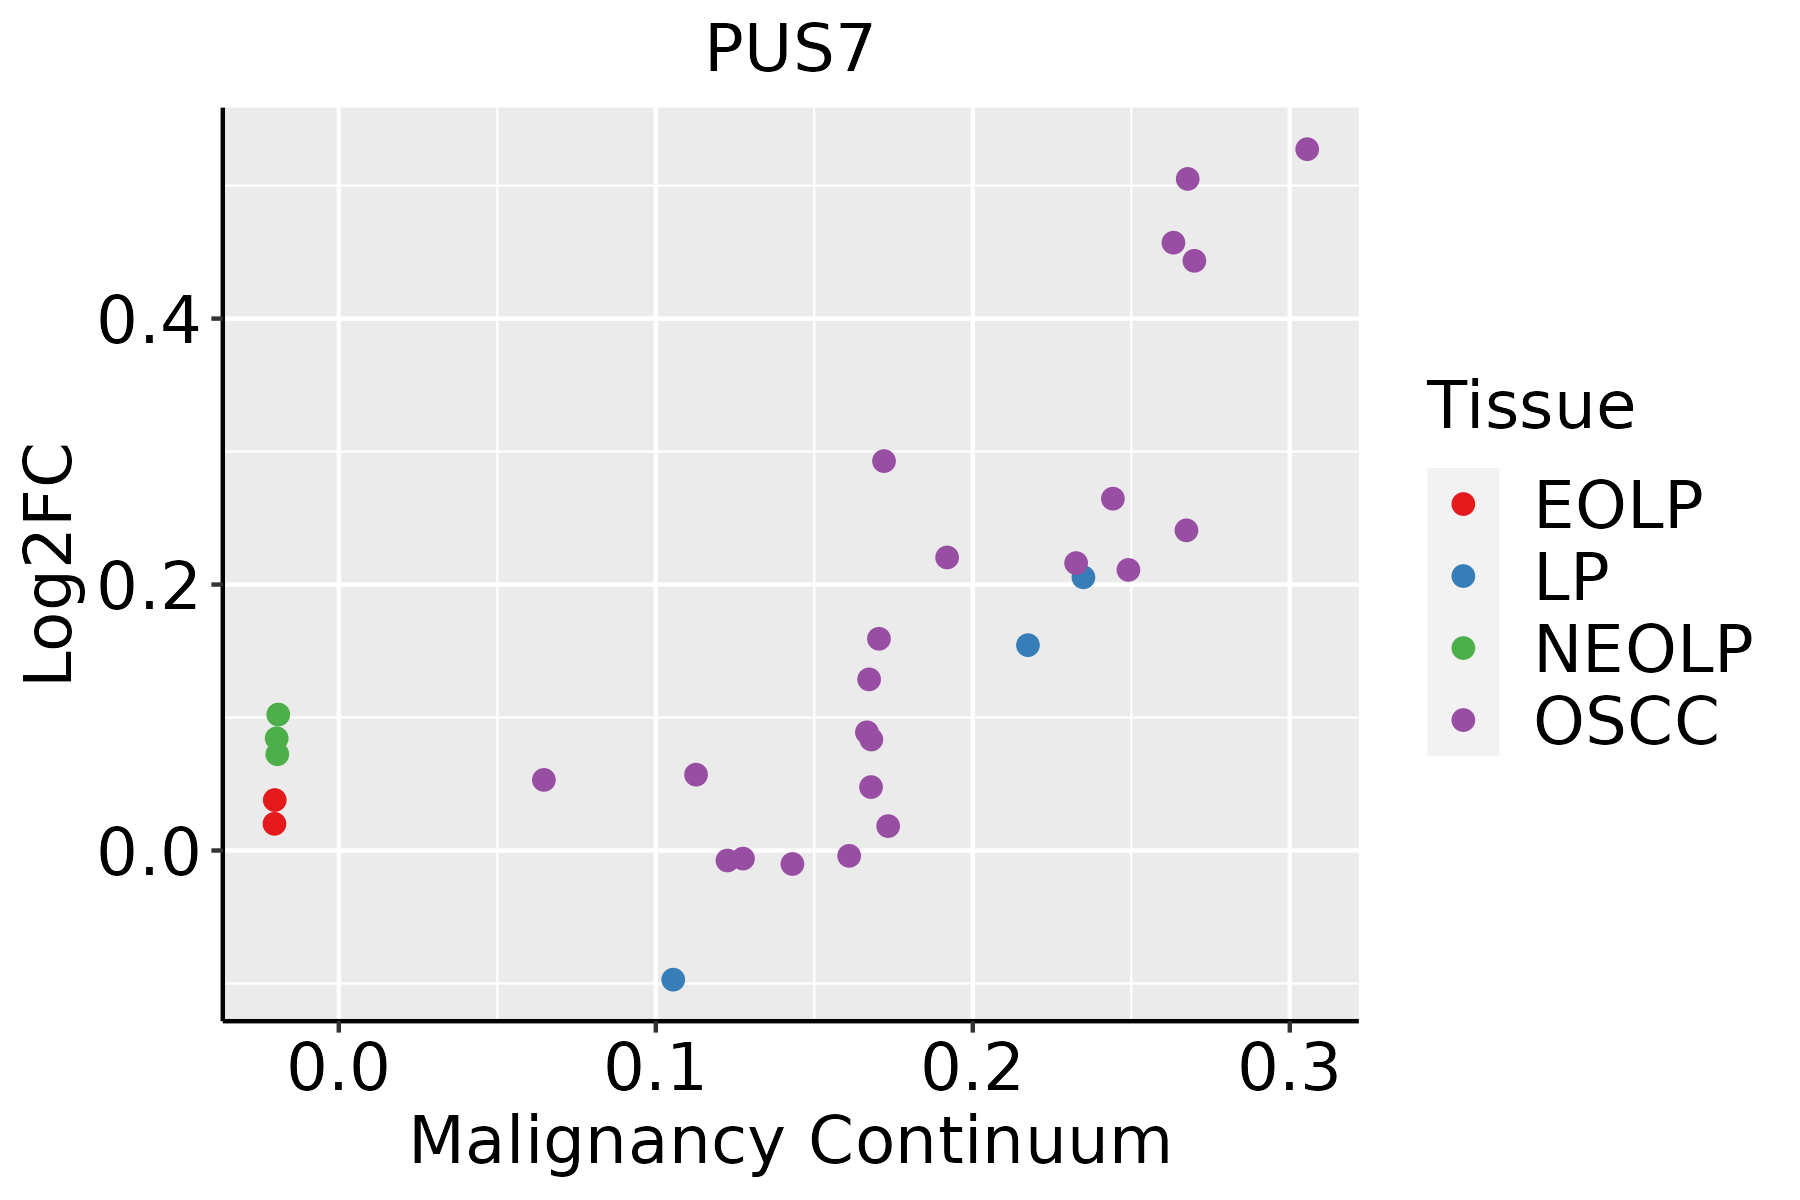 | EOLP: Erosive Oral lichen planus |
| LP: leukoplakia | ||
| NEOLP: Non-erosive oral lichen planus | ||
| OSCC: Oral squamous cell carcinoma | ||
| Skin | 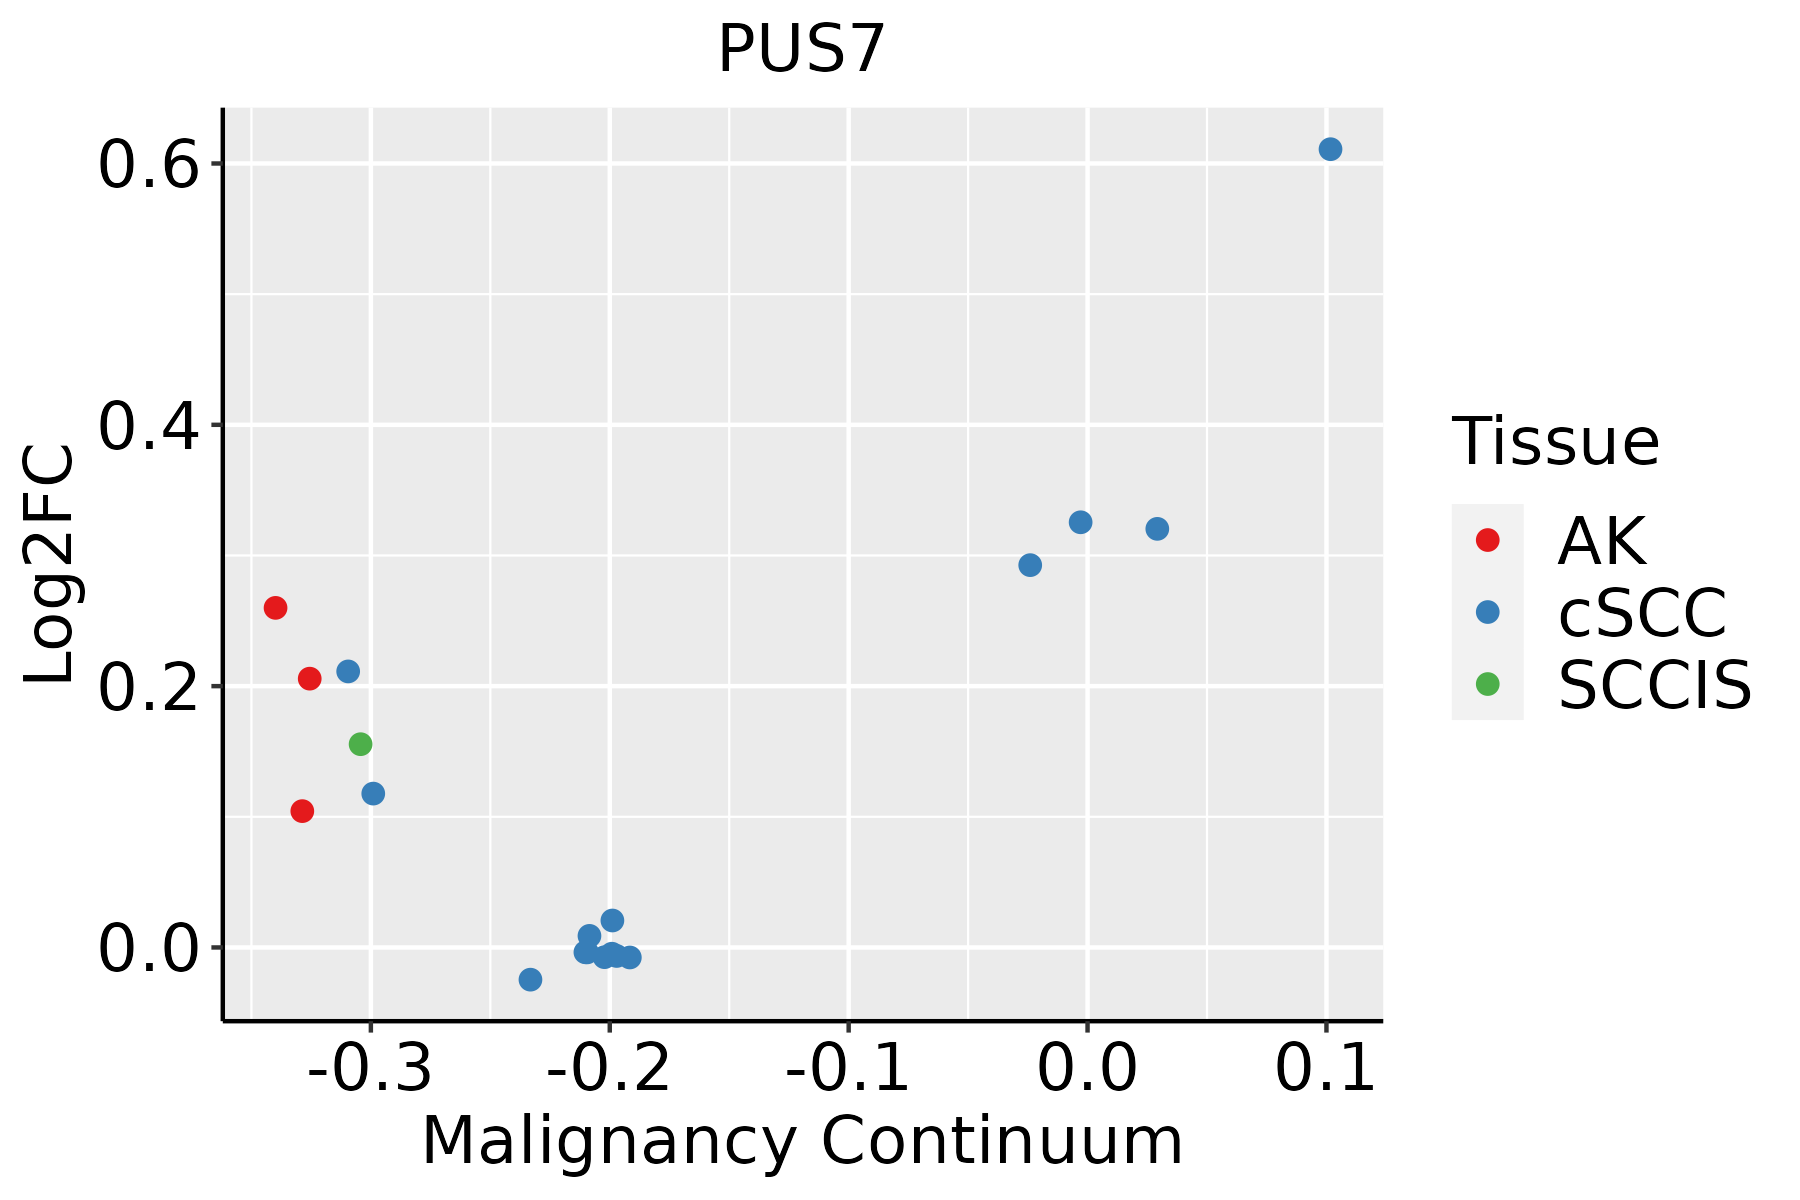 | AK: Actinic keratosis |
| cSCC: Cutaneous squamous cell carcinoma | ||
| SCCIS:squamous cell carcinoma in situ |
| ∗log2FC in expression of this searched gene in stem-like cells from each diseased tissue sample relative to stem-like cells in normal samples in each tissue plotted against the malignancy continuum. Samples are colored based on if they are from different disease stage. |
Top |
Malignant transformation related pathway analysis |
| Find out the enriched GO biological processes and KEGG pathways involved in transition from healthy to precancer to cancer |
| Tissue | Disease Stage | Enriched GO biological Processes |
| Colorectum | AD |  |
| Colorectum | SER |  |
| Colorectum | MSS |  |
| Colorectum | MSI-H |  |
| Colorectum | FAP |  |
| ∗Top 15 enriched GO BP terms are showed in the bar plot of each disease state in each tissue. Each row represents a significant GO biological process which is colored according to the -log10(p.adjust). |
| Page: 1 2 3 4 5 6 7 8 9 |
| GO ID | Tissue | Disease Stage | Description | Gene Ratio | Bg Ratio | pvalue | p.adjust | Count |
| GO:003424914 | Esophagus | ESCC | negative regulation of cellular amide metabolic process | 144/8552 | 273/18723 | 1.08e-02 | 3.67e-02 | 144 |
| GO:00344702 | Liver | HCC | ncRNA processing | 293/7958 | 395/18723 | 4.26e-38 | 6.76e-35 | 293 |
| GO:00346601 | Liver | HCC | ncRNA metabolic process | 332/7958 | 485/18723 | 1.48e-31 | 7.80e-29 | 332 |
| GO:000641722 | Liver | HCC | regulation of translation | 287/7958 | 468/18723 | 8.79e-17 | 8.08e-15 | 287 |
| GO:0008033 | Liver | HCC | tRNA processing | 87/7958 | 127/18723 | 2.66e-09 | 7.23e-08 | 87 |
| GO:0006399 | Liver | HCC | tRNA metabolic process | 108/7958 | 179/18723 | 1.07e-06 | 1.59e-05 | 108 |
| GO:0009451 | Liver | HCC | RNA modification | 101/7958 | 167/18723 | 2.02e-06 | 2.78e-05 | 101 |
| GO:0006400 | Liver | HCC | tRNA modification | 60/7958 | 90/18723 | 3.09e-06 | 4.09e-05 | 60 |
| GO:003424921 | Liver | HCC | negative regulation of cellular amide metabolic process | 144/7958 | 273/18723 | 3.80e-04 | 2.61e-03 | 144 |
| GO:001714821 | Liver | HCC | negative regulation of translation | 129/7958 | 245/18723 | 8.14e-04 | 4.87e-03 | 129 |
| GO:0016556 | Liver | HCC | mRNA modification | 18/7958 | 27/18723 | 9.75e-03 | 3.66e-02 | 18 |
| GO:00344709 | Oral cavity | OSCC | ncRNA processing | 263/7305 | 395/18723 | 4.38e-29 | 2.78e-26 | 263 |
| GO:00346605 | Oral cavity | OSCC | ncRNA metabolic process | 296/7305 | 485/18723 | 2.94e-23 | 6.65e-21 | 296 |
| GO:000641720 | Oral cavity | OSCC | regulation of translation | 274/7305 | 468/18723 | 4.39e-18 | 4.63e-16 | 274 |
| GO:00080332 | Oral cavity | OSCC | tRNA processing | 78/7305 | 127/18723 | 2.56e-07 | 4.00e-06 | 78 |
| GO:00063991 | Oral cavity | OSCC | tRNA metabolic process | 101/7305 | 179/18723 | 1.65e-06 | 2.15e-05 | 101 |
| GO:00094511 | Oral cavity | OSCC | RNA modification | 95/7305 | 167/18723 | 2.05e-06 | 2.62e-05 | 95 |
| GO:00064001 | Oral cavity | OSCC | tRNA modification | 53/7305 | 90/18723 | 1.04e-04 | 7.70e-04 | 53 |
| GO:00342495 | Oral cavity | OSCC | negative regulation of cellular amide metabolic process | 130/7305 | 273/18723 | 2.20e-03 | 1.00e-02 | 130 |
| GO:20007364 | Oral cavity | OSCC | regulation of stem cell differentiation | 33/7305 | 58/18723 | 4.32e-03 | 1.75e-02 | 33 |
| Page: 1 2 3 4 |
| Pathway ID | Tissue | Disease Stage | Description | Gene Ratio | Bg Ratio | pvalue | p.adjust | qvalue | Count |
| Page: 1 |
Top |
Cell-cell communication analysis |
| Identification of potential cell-cell interactions between two cell types and their ligand-receptor pairs for different disease states |
| Ligand | Receptor | LRpair | Pathway | Tissue | Disease Stage |
| Page: 1 |
Top |
Single-cell gene regulatory network inference analysis |
| Find out the significant the regulons (TFs) and the target genes of each regulon across cell types for different disease states |
| TF | Cell Type | Tissue | Disease Stage | Target Gene | RSS | Regulon Activity |
| ∗The dot plots of a searched regulon are shown for all cell subpopulations in each disease state of each tissue based on the regulon specific score inferred using pySCENIC and by calculating the average expression. |
| Page: 1 |
Top |
Somatic mutation of malignant transformation related genes |
| Annotation of somatic variants for genes involved in malignant transformation |
| Hugo Symbol | Variant Class | Variant Classification | dbSNP RS | HGVSc | HGVSp | HGVSp Short | SWISSPROT | BIOTYPE | SIFT | PolyPhen | Tumor Sample Barcode | Tissue | Histology | Sex | Age | Stage | Therapy Types | Drugs | Outcome |
| PUS7 | SNV | Missense_Mutation | novel | c.238G>C | p.Asp80His | p.D80H | Q96PZ0 | protein_coding | deleterious(0.02) | benign(0.092) | TCGA-A7-A4SE-01 | Breast | breast invasive carcinoma | Female | <65 | I/II | Chemotherapy | adriamycin | CR |
| PUS7 | SNV | Missense_Mutation | rs776732227 | c.1981N>T | p.Arg661Cys | p.R661C | Q96PZ0 | protein_coding | deleterious_low_confidence(0) | probably_damaging(0.993) | TCGA-AC-A23H-01 | Breast | breast invasive carcinoma | Female | >=65 | I/II | Unknown | Unknown | PD |
| PUS7 | SNV | Missense_Mutation | c.1193C>T | p.Ser398Phe | p.S398F | Q96PZ0 | protein_coding | deleterious(0.01) | possibly_damaging(0.447) | TCGA-AN-A046-01 | Breast | breast invasive carcinoma | Female | >=65 | I/II | Unknown | Unknown | SD | |
| PUS7 | SNV | Missense_Mutation | c.453N>C | p.Leu151Phe | p.L151F | Q96PZ0 | protein_coding | deleterious(0) | probably_damaging(0.999) | TCGA-D8-A27G-01 | Breast | breast invasive carcinoma | Female | >=65 | I/II | Unknown | Unknown | SD | |
| PUS7 | SNV | Missense_Mutation | novel | c.1957N>G | p.Thr653Ala | p.T653A | Q96PZ0 | protein_coding | tolerated(0.15) | benign(0.026) | TCGA-OL-A66P-01 | Breast | breast invasive carcinoma | Female | >=65 | I/II | Chemotherapy | cytoxan | CR |
| PUS7 | insertion | Nonsense_Mutation | novel | c.1417_1418insAGCCGGGC | p.Leu473Ter | p.L473* | Q96PZ0 | protein_coding | TCGA-BH-A0GY-01 | Breast | breast invasive carcinoma | Female | >=65 | I/II | Chemotherapy | cyotxan | SD | ||
| PUS7 | insertion | In_Frame_Ins | novel | c.1416_1417insGTCTCTACTAAAAATACAAAAAAT | p.Arg472_Leu473insValSerThrLysAsnThrLysAsn | p.R472_L473insVSTKNTKN | Q96PZ0 | protein_coding | TCGA-BH-A0GY-01 | Breast | breast invasive carcinoma | Female | >=65 | I/II | Chemotherapy | cyotxan | SD | ||
| PUS7 | SNV | Missense_Mutation | novel | c.241N>C | p.Glu81Gln | p.E81Q | Q96PZ0 | protein_coding | tolerated(0.22) | benign(0.068) | TCGA-DS-A7WH-01 | Cervix | cervical & endocervical cancer | Female | <65 | I/II | Chemotherapy | cisplatin | CR |
| PUS7 | SNV | Missense_Mutation | c.1700A>G | p.Asp567Gly | p.D567G | Q96PZ0 | protein_coding | deleterious(0) | probably_damaging(0.978) | TCGA-EK-A2PI-01 | Cervix | cervical & endocervical cancer | Female | <65 | III/IV | Unknown | Unknown | SD | |
| PUS7 | SNV | Missense_Mutation | rs754710973 | c.1958N>T | p.Thr653Met | p.T653M | Q96PZ0 | protein_coding | deleterious(0) | benign(0.216) | TCGA-5M-AAT6-01 | Colorectum | colon adenocarcinoma | Female | <65 | III/IV | Unknown | Unknown | PD |
| Page: 1 2 3 4 5 6 7 |
Top |
Related drugs of malignant transformation related genes |
| Identification of chemicals and drugs interact with genes involved in malignant transfromation |
| (DGIdb 4.0) |
| Entrez ID | Symbol | Category | Interaction Types | Drug Claim Name | Drug Name | PMIDs |
| Page: 1 |

Copyright 2023-Present -The University of Texas Health Science Center at Houston |