Schematic overview of the cellular and molecular mechanisms involved in the cancer progression, including the proposed cellular and molecular mechanisms in cancer cells trajectory. AT1: alveolar type 1 cells; AT2: alveolar type 2 cells; AAH: atypical adenomatous hyperplasia; AIS: adenocarcinoma in situ; MIA: minimally invasive adenocarcinoma; IA: invasive adenocarcinoma; EMT: epithelial-mesenchymal transition

Home

Download

Statistics

Help

Contact

Center for Computational Systems Medicine
leaf

Gene summary

leaf

Malignant transformation analysis

leaf

Malignant transformation related pathway analysis

leaf

Cell-cell communication analysis

leaf

Single-cell gene regulatory network inference analysis

leaf

Somatic mutation of malignant transformation related genes

leaf

Related drugs of malignant transformation related genes

Gene: PTPN12

Gene summary for PTPN12

check button Gene summary.

Gene informationSpeciesHuman
Gene symbol

PTPN12

Gene ID

5782

Gene nameprotein tyrosine phosphatase non-receptor type 12
Gene AliasPTP-PEST
Cytomap7q11.23
Gene Typeprotein-coding
GO ID

GO:0006464

UniProtAcc

B4E105


Top

Malignant transformation analysis

check button Identification of the aberrant gene expression in precancerous and cancerous lesions by comparing the gene expression of stem-like cells in diseased tissues with normal stem cells
check button Malignant transformation involving gene list.
Entrez IDSymbolReplicatesSpeciesOrganTissueAdj P-valueLog2FCMalignancy
5782PTPN12CCI_1HumanCervixCC1.27e-027.87e-010.528
5782PTPN12CCI_2HumanCervixCC2.52e-141.48e+000.5249
5782PTPN12CCI_3HumanCervixCC5.39e-131.06e+000.516
5782PTPN12sample3HumanCervixCC2.34e-113.74e-010.1387
5782PTPN12T3HumanCervixCC8.75e-164.04e-010.1389
5782PTPN12HTA11_3410_2000001011HumanColorectumAD4.73e-10-4.45e-010.0155
5782PTPN12HTA11_866_3004761011HumanColorectumAD8.25e-03-3.54e-010.096
5782PTPN12HTA11_6801_2000001011HumanColorectumSER2.01e-02-6.73e-010.0171
5782PTPN12HTA11_10711_2000001011HumanColorectumAD1.38e-02-3.14e-010.0338
5782PTPN12HTA11_7696_3000711011HumanColorectumAD1.07e-05-3.55e-010.0674
5782PTPN12HTA11_6818_2000001021HumanColorectumAD3.00e-03-3.99e-010.0588
5782PTPN12A015-C-203HumanColorectumFAP3.46e-26-3.72e-01-0.1294
5782PTPN12A015-C-204HumanColorectumFAP1.19e-06-2.62e-01-0.0228
5782PTPN12A014-C-040HumanColorectumFAP1.98e-04-3.39e-01-0.1184
5782PTPN12A002-C-201HumanColorectumFAP2.52e-10-2.18e-010.0324
5782PTPN12A001-C-119HumanColorectumFAP8.11e-072.88e-01-0.1557
5782PTPN12A001-C-108HumanColorectumFAP2.14e-106.60e-02-0.0272
5782PTPN12A002-C-205HumanColorectumFAP2.89e-20-1.28e-01-0.1236
5782PTPN12A015-C-005HumanColorectumFAP1.17e-02-1.15e-01-0.0336
5782PTPN12A015-C-006HumanColorectumFAP1.44e-13-1.97e-01-0.0994
Page: 1 2 3 4 5 6 7 8 9 10 

check button Transcriptomic changes along malignancy continuum.
TissueExpression DynamicsAbbreviation
CervixThe image shows the transcriptomic changes along malignancy continuum.log2FC in expression of this searched gene in stem-like cells from each diseased tissue sample relative to stem-like cells in normal samples in each tissue plotted against the malignancy continuum. Samples are colored based on if they are from different disease stage.CC: Cervix cancer
HSIL_HPV: HPV-infected high-grade squamous intraepithelial lesions
N_HPV: HPV-infected normal cervix
Colorectum (GSE201348)The image shows the transcriptomic changes along malignancy continuum.log2FC in expression of this searched gene in stem-like cells from each diseased tissue sample relative to stem-like cells in normal samples in each tissue plotted against the malignancy continuum. Samples are colored based on if they are from different disease stage.
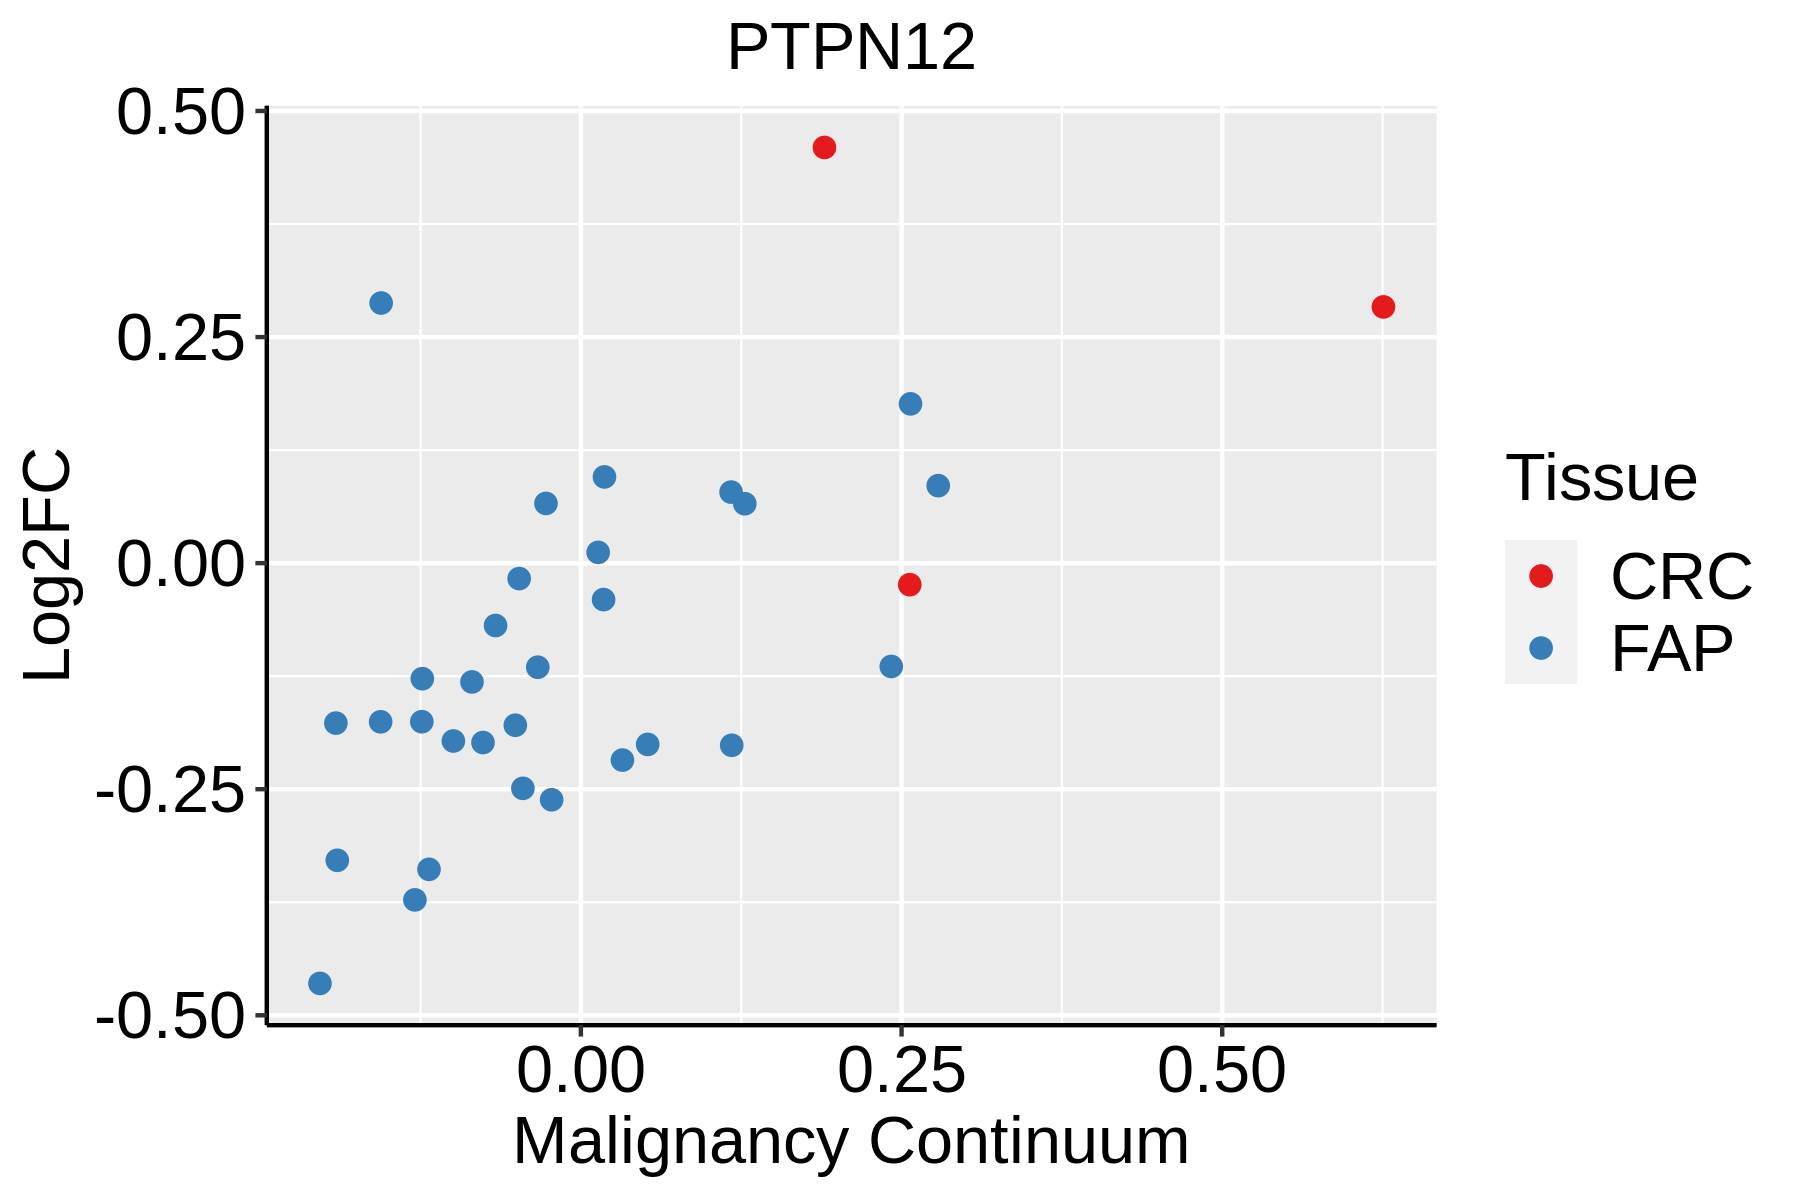
FAP: Familial adenomatous polyposis
CRC: Colorectal cancer
Colorectum (HTA11)The image shows the transcriptomic changes along malignancy continuum.log2FC in expression of this searched gene in stem-like cells from each diseased tissue sample relative to stem-like cells in normal samples in each tissue plotted against the malignancy continuum. Samples are colored based on if they are from different disease stage.AD: Adenomas
SER: Sessile serrated lesions
MSI-H: Microsatellite-high colorectal cancer
MSS: Microsatellite stable colorectal cancer
EndometriumThe image shows the transcriptomic changes along malignancy continuum.log2FC in expression of this searched gene in stem-like cells from each diseased tissue sample relative to stem-like cells in normal samples in each tissue plotted against the malignancy continuum. Samples are colored based on if they are from different disease stage.
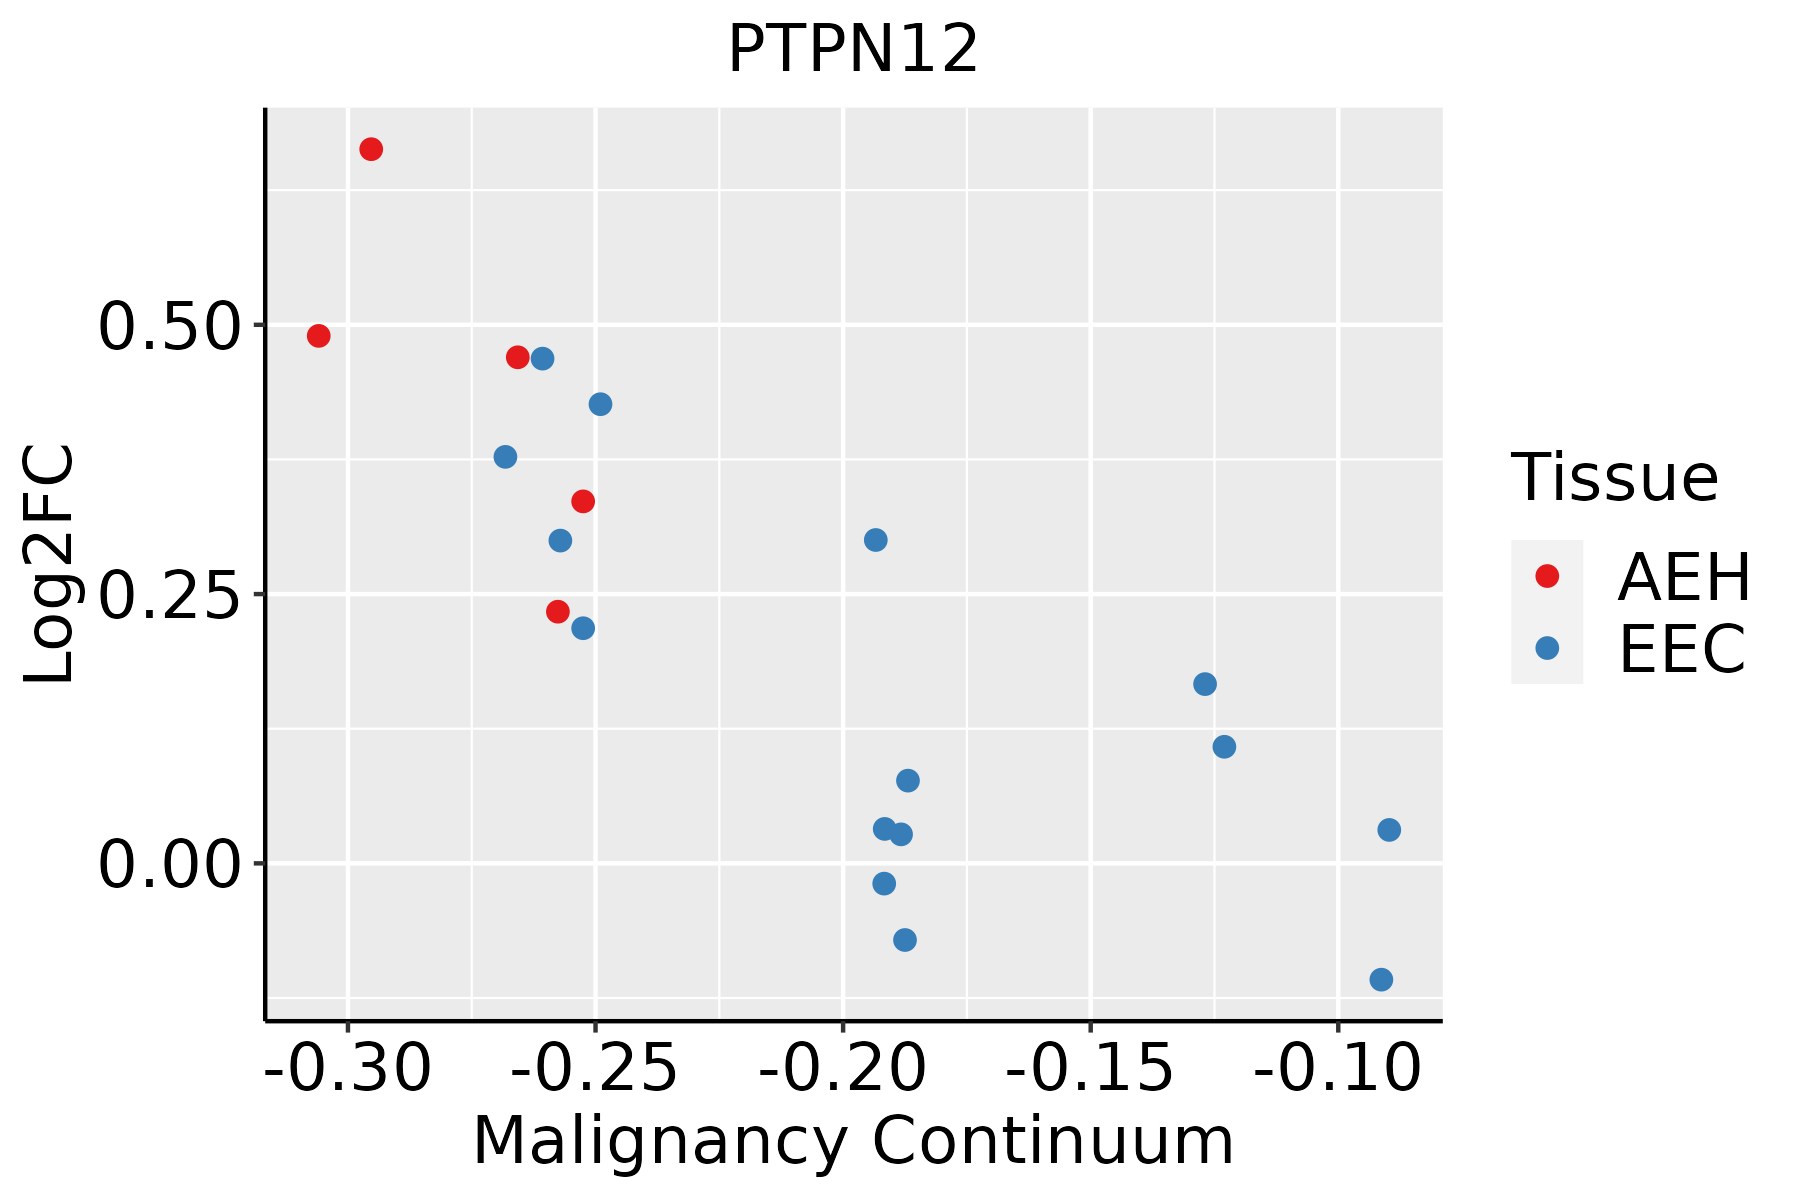
AEH: Atypical endometrial hyperplasia
EEC: Endometrioid Cancer
EsophagusThe image shows the transcriptomic changes along malignancy continuum.log2FC in expression of this searched gene in stem-like cells from each diseased tissue sample relative to stem-like cells in normal samples in each tissue plotted against the malignancy continuum. Samples are colored based on if they are from different disease stage.
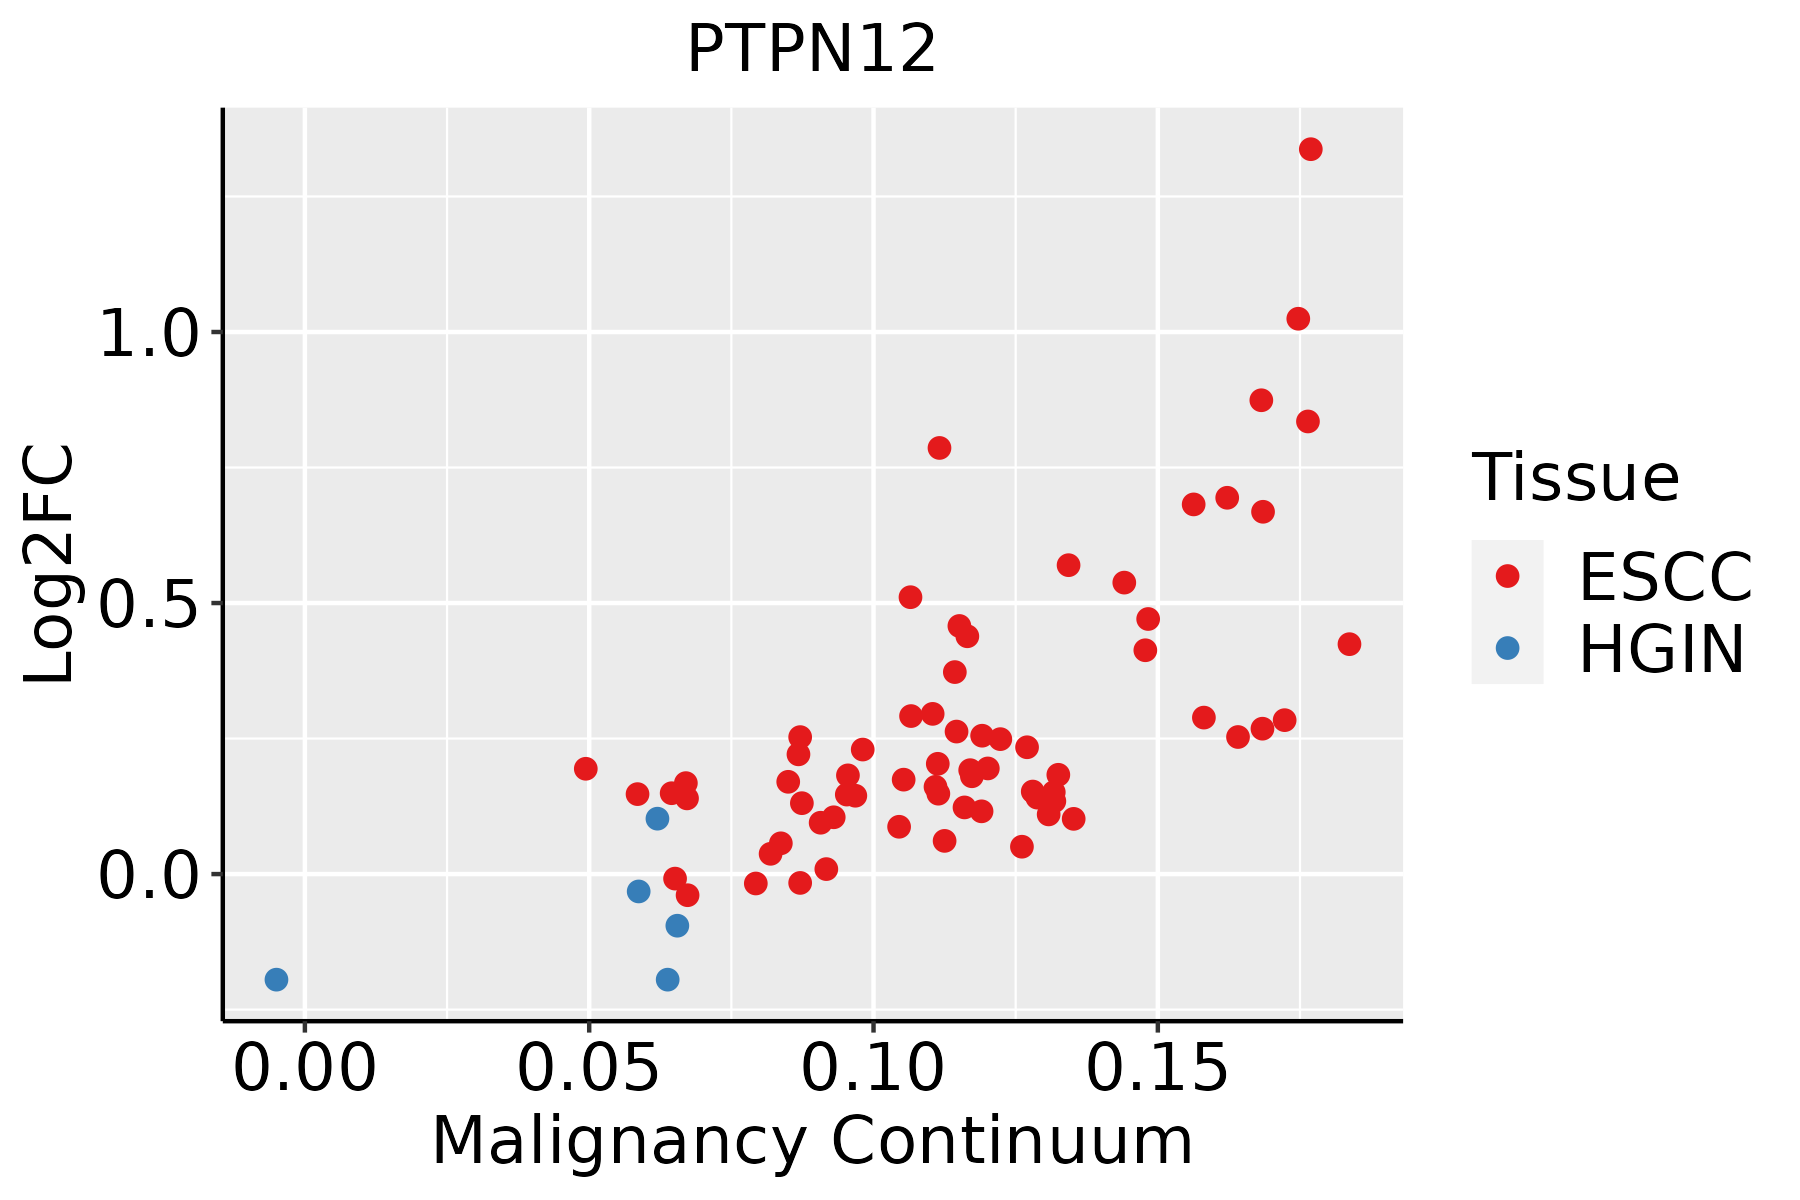
ESCC: Esophageal squamous cell carcinoma
HGIN: High-grade intraepithelial neoplasias
LGIN: Low-grade intraepithelial neoplasias
LiverThe image shows the transcriptomic changes along malignancy continuum.log2FC in expression of this searched gene in stem-like cells from each diseased tissue sample relative to stem-like cells in normal samples in each tissue plotted against the malignancy continuum. Samples are colored based on if they are from different disease stage.
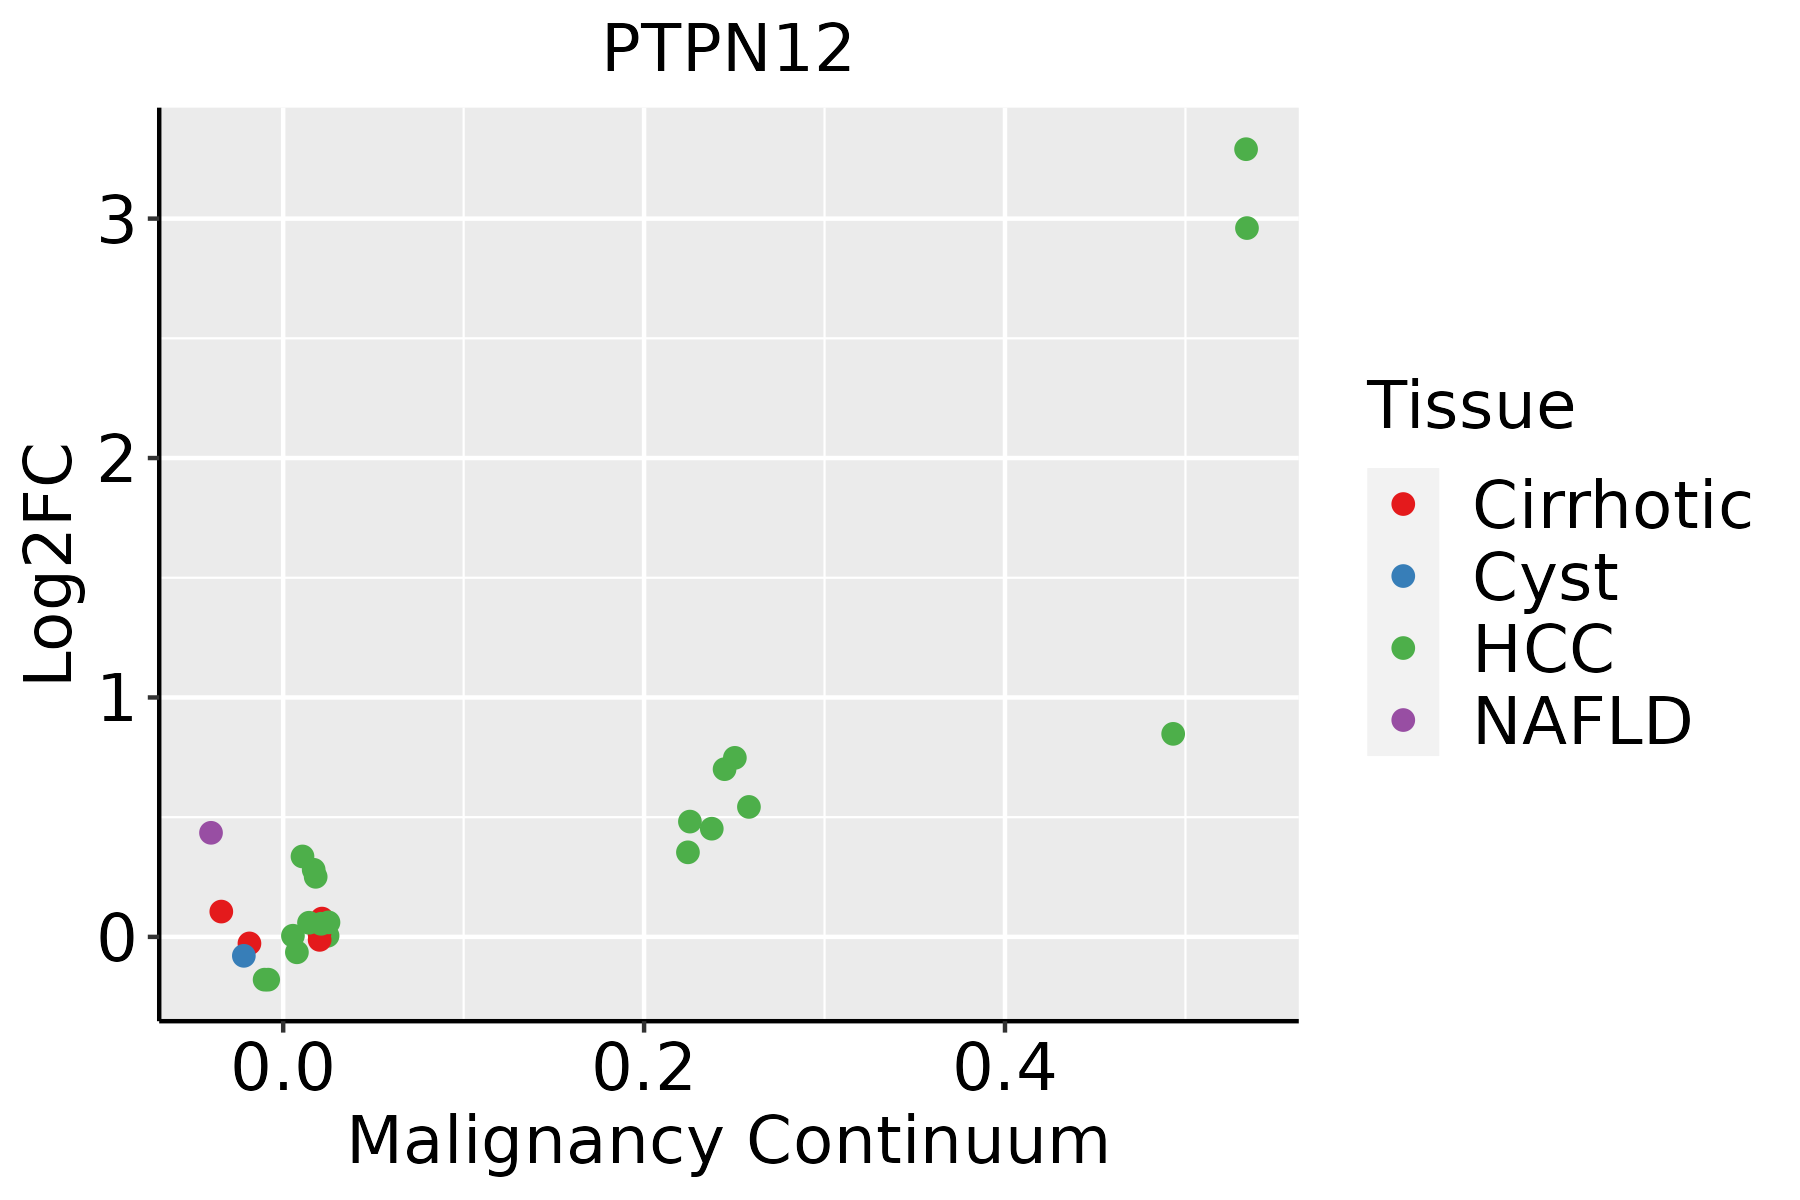
HCC: Hepatocellular carcinoma
NAFLD: Non-alcoholic fatty liver disease
LungThe image shows the transcriptomic changes along malignancy continuum.log2FC in expression of this searched gene in stem-like cells from each diseased tissue sample relative to stem-like cells in normal samples in each tissue plotted against the malignancy continuum. Samples are colored based on if they are from different disease stage.
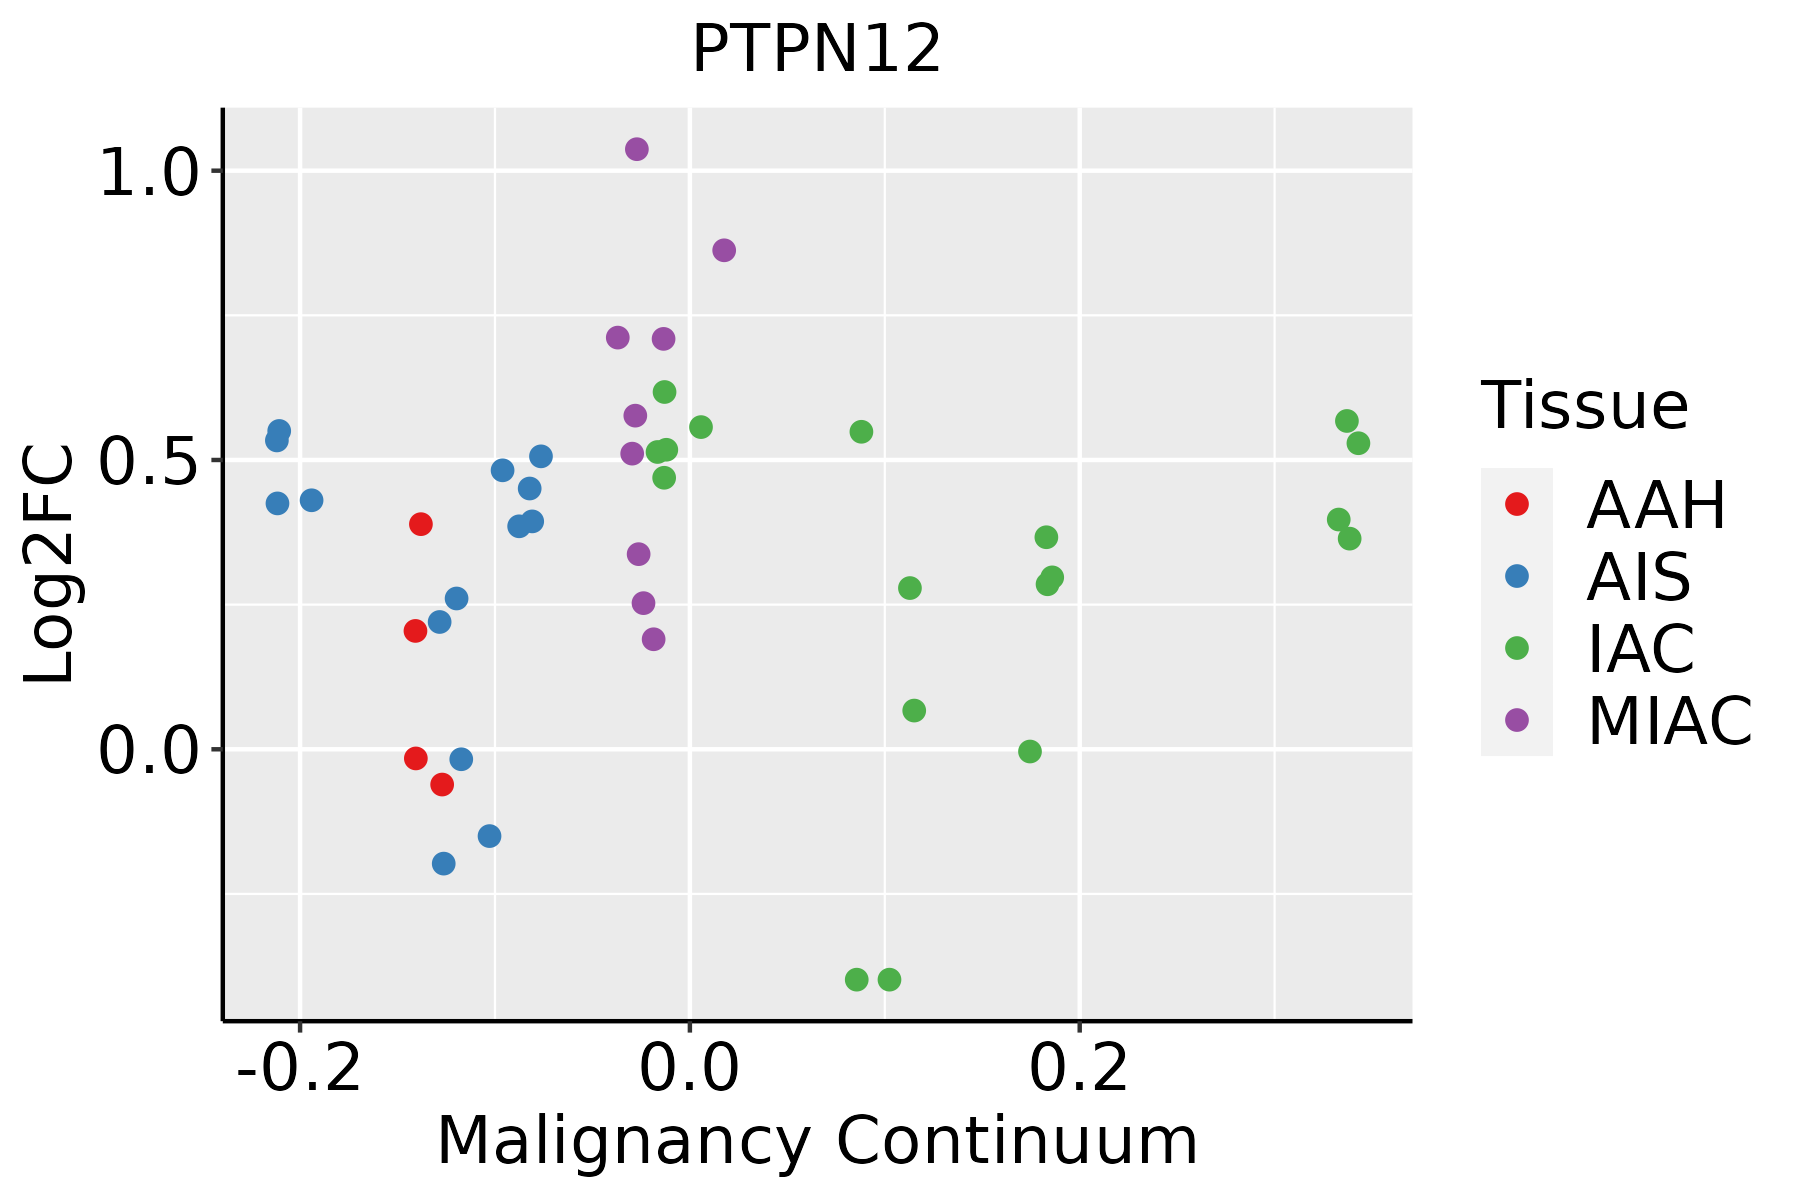
AAH: Atypical adenomatous hyperplasia
AIS: Adenocarcinoma in situ
IAC: Invasive lung adenocarcinoma
MIA: Minimally invasive adenocarcinoma
Oral CavityThe image shows the transcriptomic changes along malignancy continuum.log2FC in expression of this searched gene in stem-like cells from each diseased tissue sample relative to stem-like cells in normal samples in each tissue plotted against the malignancy continuum. Samples are colored based on if they are from different disease stage.
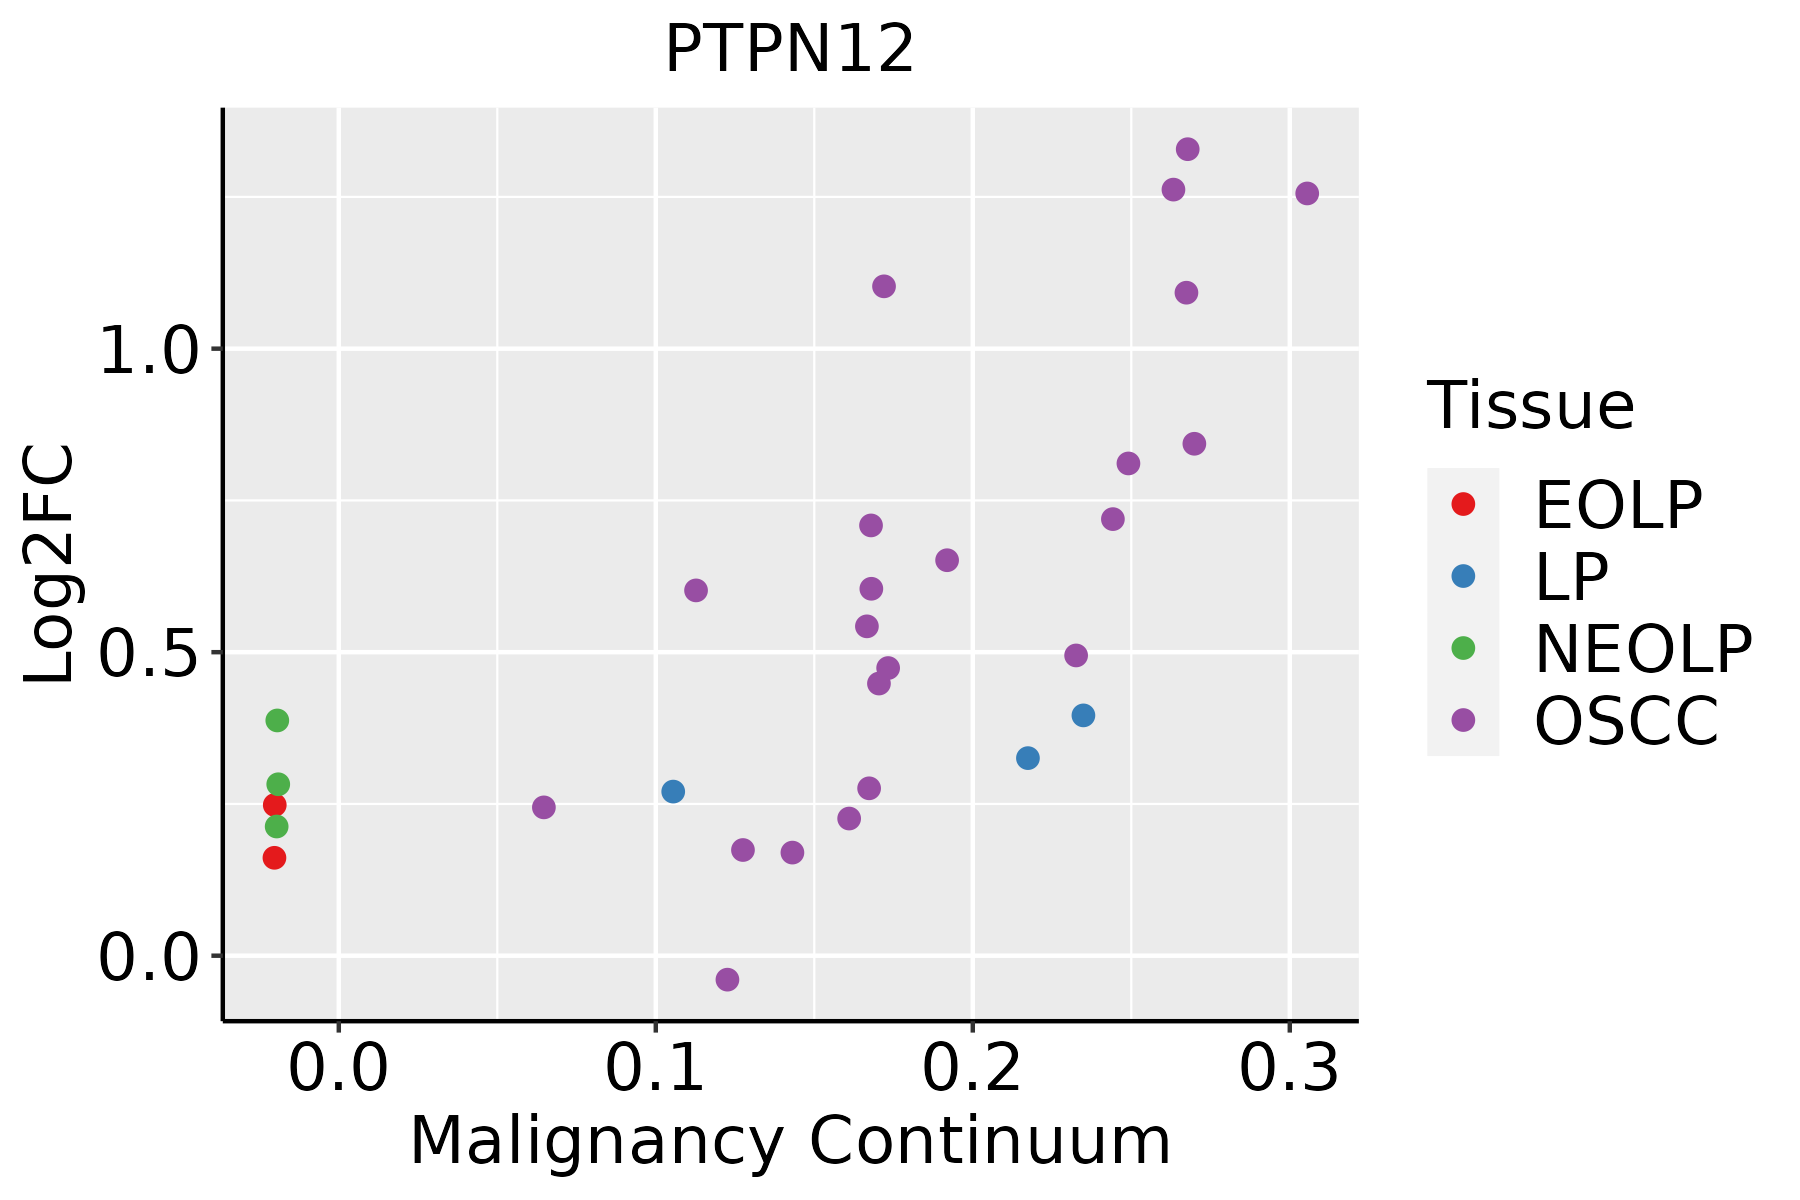
EOLP: Erosive Oral lichen planus
LP: leukoplakia
NEOLP: Non-erosive oral lichen planus
OSCC: Oral squamous cell carcinoma
SkinThe image shows the transcriptomic changes along malignancy continuum.log2FC in expression of this searched gene in stem-like cells from each diseased tissue sample relative to stem-like cells in normal samples in each tissue plotted against the malignancy continuum. Samples are colored based on if they are from different disease stage.
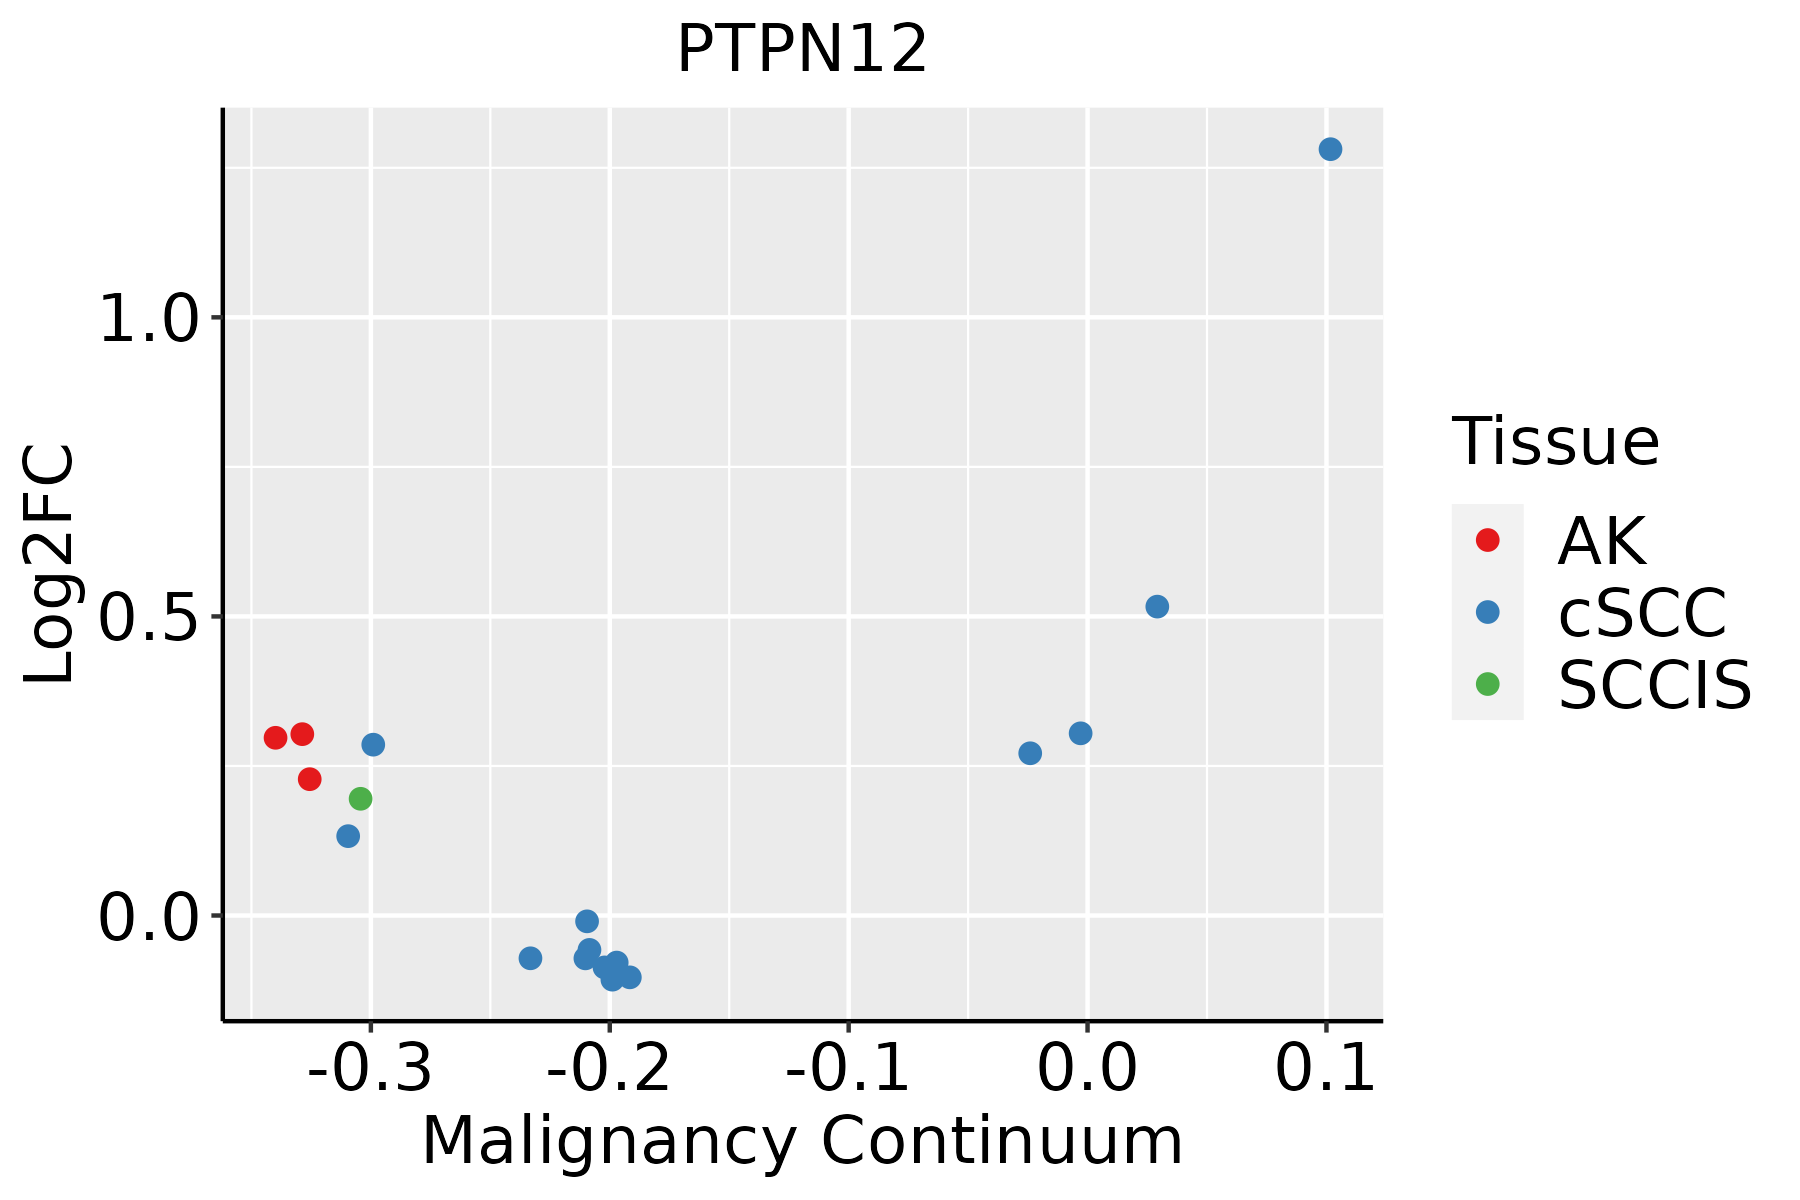
AK: Actinic keratosis
cSCC: Cutaneous squamous cell carcinoma
SCCIS:squamous cell carcinoma in situ
ThyroidThe image shows the transcriptomic changes along malignancy continuum.log2FC in expression of this searched gene in stem-like cells from each diseased tissue sample relative to stem-like cells in normal samples in each tissue plotted against the malignancy continuum. Samples are colored based on if they are from different disease stage.ATC: Anaplastic thyroid cancer
HT: Hashimoto's thyroiditis
PTC: Papillary thyroid cancer
∗log2FC in expression of this searched gene in stem-like cells from each diseased tissue sample relative to stem-like cells in normal samples in each tissue plotted against the malignancy continuum. Samples are colored based on if they are from different disease stage.

Top

Malignant transformation related pathway analysis

check buttonFind out the enriched GO biological processes and KEGG pathways involved in transition from healthy to precancer to cancer
check button Figure of enriched GO biological processes.
TissueDisease StageEnriched GO biological Processes
ColorectumADGO analysis - Figure of enriched GO biological processes: Top 15 enriched GO BP terms are showed in the bar plot of each disease state in each tissue. Each row represents a significant GO biological process which is colored according to the -log10(p.adjust).
ColorectumSERGO analysis - Figure of enriched GO biological processes: Top 15 enriched GO BP terms are showed in the bar plot of each disease state in each tissue. Each row represents a significant GO biological process which is colored according to the -log10(p.adjust).
ColorectumMSSGO analysis - Figure of enriched GO biological processes: Top 15 enriched GO BP terms are showed in the bar plot of each disease state in each tissue. Each row represents a significant GO biological process which is colored according to the -log10(p.adjust).
ColorectumMSI-HGO analysis - Figure of enriched GO biological processes: Top 15 enriched GO BP terms are showed in the bar plot of each disease state in each tissue. Each row represents a significant GO biological process which is colored according to the -log10(p.adjust).
ColorectumFAPGO analysis - Figure of enriched GO biological processes: Top 15 enriched GO BP terms are showed in the bar plot of each disease state in each tissue. Each row represents a significant GO biological process which is colored according to the -log10(p.adjust).
∗Top 15 enriched GO BP terms are showed in the bar plot of each disease state in each tissue. Each row represents a significant GO biological process which is colored according to the -log10(p.adjust).
Page: 1 2 3 4 5 6 7 8 9 

check button Enriched GO biological processes.
GO IDTissueDisease StageDescriptionGene RatioBg Ratiopvaluep.adjustCount
GO:0071364ColorectumADcellular response to epidermal growth factor stimulus21/391845/187239.94e-051.50e-0321
GO:00708491ColorectumSERresponse to epidermal growth factor20/289749/187231.72e-055.15e-0420
GO:00713641ColorectumSERcellular response to epidermal growth factor stimulus18/289745/187236.20e-051.44e-0318
GO:00381271ColorectumSERERBB signaling pathway35/2897121/187231.21e-042.49e-0335
GO:00071731ColorectumSERepidermal growth factor receptor signaling pathway32/2897108/187231.42e-042.82e-0332
GO:00064701ColorectumSERprotein dephosphorylation65/2897281/187234.44e-046.51e-0365
GO:19011851ColorectumSERnegative regulation of ERBB signaling pathway12/289732/187232.00e-031.98e-0212
GO:00163111ColorectumSERdephosphorylation86/2897417/187232.73e-032.46e-0286
GO:00071734ColorectumFAPepidermal growth factor receptor signaling pathway42/2622108/187231.29e-103.77e-0842
GO:00381274ColorectumFAPERBB signaling pathway45/2622121/187231.64e-104.38e-0845
GO:00163113ColorectumFAPdephosphorylation95/2622417/187237.07e-073.32e-0595
GO:00064704ColorectumFAPprotein dephosphorylation69/2622281/187231.47e-066.39e-0569
GO:19011842ColorectumFAPregulation of ERBB signaling pathway27/262279/187234.77e-061.57e-0427
GO:19011853ColorectumFAPnegative regulation of ERBB signaling pathway15/262232/187238.00e-062.38e-0415
GO:00420582ColorectumFAPregulation of epidermal growth factor receptor signaling pathway25/262273/187231.02e-052.93e-0425
GO:00708493ColorectumFAPresponse to epidermal growth factor17/262249/187232.17e-043.09e-0317
GO:00713643ColorectumFAPcellular response to epidermal growth factor stimulus16/262245/187232.39e-043.34e-0316
GO:0048008ColorectumFAPplatelet-derived growth factor receptor signaling pathway16/262256/187233.40e-032.47e-0216
GO:0035335ColorectumFAPpeptidyl-tyrosine dephosphorylation23/262297/187236.95e-034.26e-0223
GO:00071735ColorectumCRCepidermal growth factor receptor signaling pathway39/2078108/187236.90e-125.90e-0939
Page: 1 2 3 4 5 6 7 8 9 10 

check button Enriched KEGG pathways.
Pathway IDTissueDisease StageDescriptionGene RatioBg Ratiopvaluep.adjustqvalueCount
Page: 1 

Top

Cell-cell communication analysis

check buttonIdentification of potential cell-cell interactions between two cell types and their ligand-receptor pairs for different disease states
LigandReceptorLRpairPathwayTissueDisease Stage
Page: 1 

Top

Single-cell gene regulatory network inference analysis

check buttonFind out the significant the regulons (TFs) and the target genes of each regulon across cell types for different disease states
TFCell TypeTissueDisease StageTarget GeneRSSRegulon Activity
∗The dot plots of a searched regulon are shown for all cell subpopulations in each disease state of each tissue based on the regulon specific score inferred using pySCENIC and by calculating the average expression.
Page: 1 

Top

Somatic mutation of malignant transformation related genes

check buttonAnnotation of somatic variants for genes involved in malignant transformation
Hugo SymbolVariant ClassVariant ClassificationdbSNP RSHGVScHGVSpHGVSp ShortSWISSPROTBIOTYPESIFTPolyPhenTumor Sample BarcodeTissueHistologySexAgeStageTherapy TypesDrugsOutcome
PTPN12SNVMissense_Mutationc.824N>Gp.Ser275Cysp.S275CQ05209protein_codingdeleterious(0.02)probably_damaging(1)TCGA-A1-A0SI-01Breastbreast invasive carcinomaFemale<65I/IIUnknownUnknownSD
PTPN12SNVMissense_Mutationc.263A>Tp.Tyr88Phep.Y88FQ05209protein_codingdeleterious(0)probably_damaging(1)TCGA-A8-A07U-01Breastbreast invasive carcinomaFemale>=65III/IVChemotherapy5-fluorouracilSD
PTPN12SNVMissense_Mutationc.824N>Tp.Ser275Phep.S275FQ05209protein_codingdeleterious(0)probably_damaging(1)TCGA-BH-A0B6-01Breastbreast invasive carcinomaFemale<65I/IIUnknownUnknownSD
PTPN12SNVMissense_Mutationrs766786152c.1427N>Gp.Ser476Cysp.S476CQ05209protein_codingtolerated_low_confidence(0.08)probably_damaging(0.91)TCGA-BH-A0DK-01Breastbreast invasive carcinomaFemale<65I/IIHormone TherapytamoxiphenSD
PTPN12SNVMissense_Mutationc.2063C>Tp.Ala688Valp.A688VQ05209protein_codingdeleterious(0)benign(0.368)TCGA-BH-A0HF-01Breastbreast invasive carcinomaFemale>=65I/IIHormone TherapyarimidexSD
PTPN12SNVMissense_Mutationc.171N>Cp.Glu57Aspp.E57DQ05209protein_codingdeleterious(0.04)benign(0.375)TCGA-BH-A18T-01Breastbreast invasive carcinomaFemale>=65I/IIUnknownUnknownPD
PTPN12insertionFrame_Shift_Insnovelc.1281_1282insAp.Leu430IlefsTer8p.L430Ifs*8Q05209protein_codingTCGA-AN-A0AK-01Breastbreast invasive carcinomaFemale>=65I/IIUnknownUnknownSD
PTPN12insertionIn_Frame_Insnovelc.1187_1188insCCAATTCTTTCTGTTTTAp.Val396_Ser397insGlnPhePheLeuPheTyrp.V396_S397insQFFLFYQ05209protein_codingTCGA-AN-A0FS-01Breastbreast invasive carcinomaFemale<65I/IIUnknownUnknownSD
PTPN12SNVMissense_Mutationc.824C>Tp.Ser275Phep.S275FQ05209protein_codingdeleterious(0)probably_damaging(1)TCGA-C5-A7X5-01Cervixcervical & endocervical cancerFemale>=65I/IIChemotherapycarboplatinPD
PTPN12SNVMissense_Mutationc.772G>Cp.Glu258Glnp.E258QQ05209protein_codingdeleterious(0.02)probably_damaging(0.974)TCGA-EK-A2PI-01Cervixcervical & endocervical cancerFemale<65III/IVUnknownUnknownSD
Page: 1 2 3 4 5 6 7 8 9 

Top

Related drugs of malignant transformation related genes

check buttonIdentification of chemicals and drugs interact with genes involved in malignant transfromation
(DGIdb 4.0)
Entrez IDSymbolCategoryInteraction TypesDrug Claim NameDrug NamePMIDs
5782PTPN12PROTEIN PHOSPHATASE, DRUGGABLE GENOME, KINASECRIZOTINIBCRIZOTINIB29578538
5782PTPN12PROTEIN PHOSPHATASE, DRUGGABLE GENOME, KINASESUNITINIBSUNITINIB29578538
5782PTPN12PROTEIN PHOSPHATASE, DRUGGABLE GENOME, KINASEGNF-PF-231CHEMBL601167
Page: 1