
|
|||||
|
 | |
| |
| |
| |
| |
| |
|
Gene: PSMD14 |
Gene summary for PSMD14 |
| Gene information | Species | Human | Gene symbol | PSMD14 | Gene ID | 10213 |
| Gene name | proteasome 26S subunit, non-ATPase 14 | |
| Gene Alias | PAD1 | |
| Cytomap | 2q24.2 | |
| Gene Type | protein-coding | GO ID | GO:0000724 | UniProtAcc | A0A140VKF2 |
Top |
Malignant transformation analysis |
| Identification of the aberrant gene expression in precancerous and cancerous lesions by comparing the gene expression of stem-like cells in diseased tissues with normal stem cells |
| Entrez ID | Symbol | Replicates | Species | Organ | Tissue | Adj P-value | Log2FC | Malignancy |
| 10213 | PSMD14 | LZE2T | Human | Esophagus | ESCC | 3.12e-02 | 6.45e-01 | 0.082 |
| 10213 | PSMD14 | LZE4T | Human | Esophagus | ESCC | 1.93e-15 | 7.15e-01 | 0.0811 |
| 10213 | PSMD14 | LZE7T | Human | Esophagus | ESCC | 1.75e-13 | 1.13e+00 | 0.0667 |
| 10213 | PSMD14 | LZE8T | Human | Esophagus | ESCC | 1.20e-09 | 4.87e-01 | 0.067 |
| 10213 | PSMD14 | LZE20T | Human | Esophagus | ESCC | 1.44e-03 | 1.40e-01 | 0.0662 |
| 10213 | PSMD14 | LZE22T | Human | Esophagus | ESCC | 4.39e-08 | 6.83e-01 | 0.068 |
| 10213 | PSMD14 | LZE24T | Human | Esophagus | ESCC | 1.18e-18 | 6.69e-01 | 0.0596 |
| 10213 | PSMD14 | LZE21T | Human | Esophagus | ESCC | 7.56e-03 | 6.35e-01 | 0.0655 |
| 10213 | PSMD14 | LZE6T | Human | Esophagus | ESCC | 1.77e-10 | 6.53e-01 | 0.0845 |
| 10213 | PSMD14 | P1T-E | Human | Esophagus | ESCC | 1.44e-03 | 4.97e-01 | 0.0875 |
| 10213 | PSMD14 | P2T-E | Human | Esophagus | ESCC | 1.82e-44 | 8.59e-01 | 0.1177 |
| 10213 | PSMD14 | P4T-E | Human | Esophagus | ESCC | 4.76e-56 | 1.58e+00 | 0.1323 |
| 10213 | PSMD14 | P5T-E | Human | Esophagus | ESCC | 3.06e-45 | 1.05e+00 | 0.1327 |
| 10213 | PSMD14 | P8T-E | Human | Esophagus | ESCC | 1.17e-40 | 8.43e-01 | 0.0889 |
| 10213 | PSMD14 | P9T-E | Human | Esophagus | ESCC | 1.76e-16 | 5.21e-01 | 0.1131 |
| 10213 | PSMD14 | P10T-E | Human | Esophagus | ESCC | 7.56e-37 | 7.26e-01 | 0.116 |
| 10213 | PSMD14 | P11T-E | Human | Esophagus | ESCC | 4.06e-28 | 1.25e+00 | 0.1426 |
| 10213 | PSMD14 | P12T-E | Human | Esophagus | ESCC | 2.69e-47 | 9.94e-01 | 0.1122 |
| 10213 | PSMD14 | P15T-E | Human | Esophagus | ESCC | 1.64e-38 | 9.62e-01 | 0.1149 |
| 10213 | PSMD14 | P16T-E | Human | Esophagus | ESCC | 2.58e-29 | 6.19e-01 | 0.1153 |
| Page: 1 2 3 4 5 6 7 |
| Tissue | Expression Dynamics | Abbreviation |
| Esophagus | 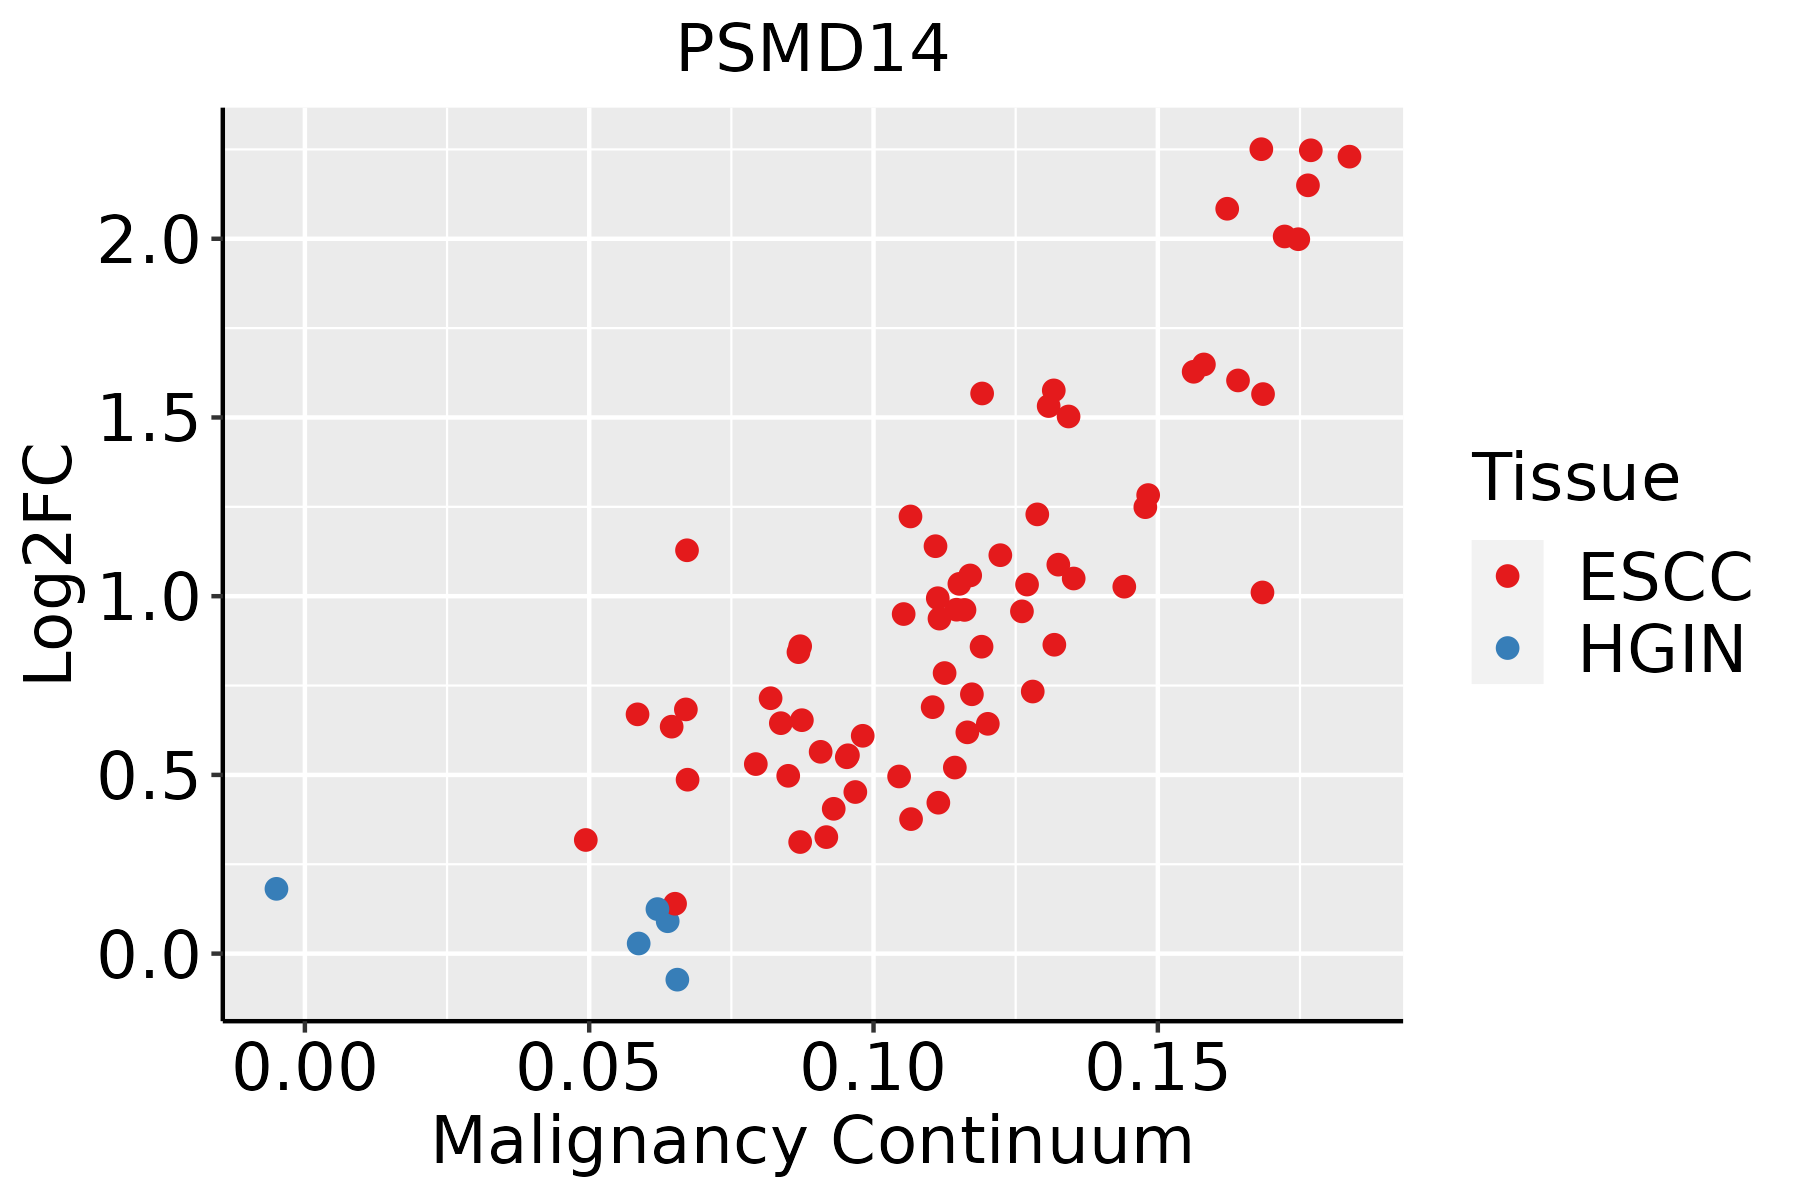 | ESCC: Esophageal squamous cell carcinoma |
| HGIN: High-grade intraepithelial neoplasias | ||
| LGIN: Low-grade intraepithelial neoplasias | ||
| Liver | 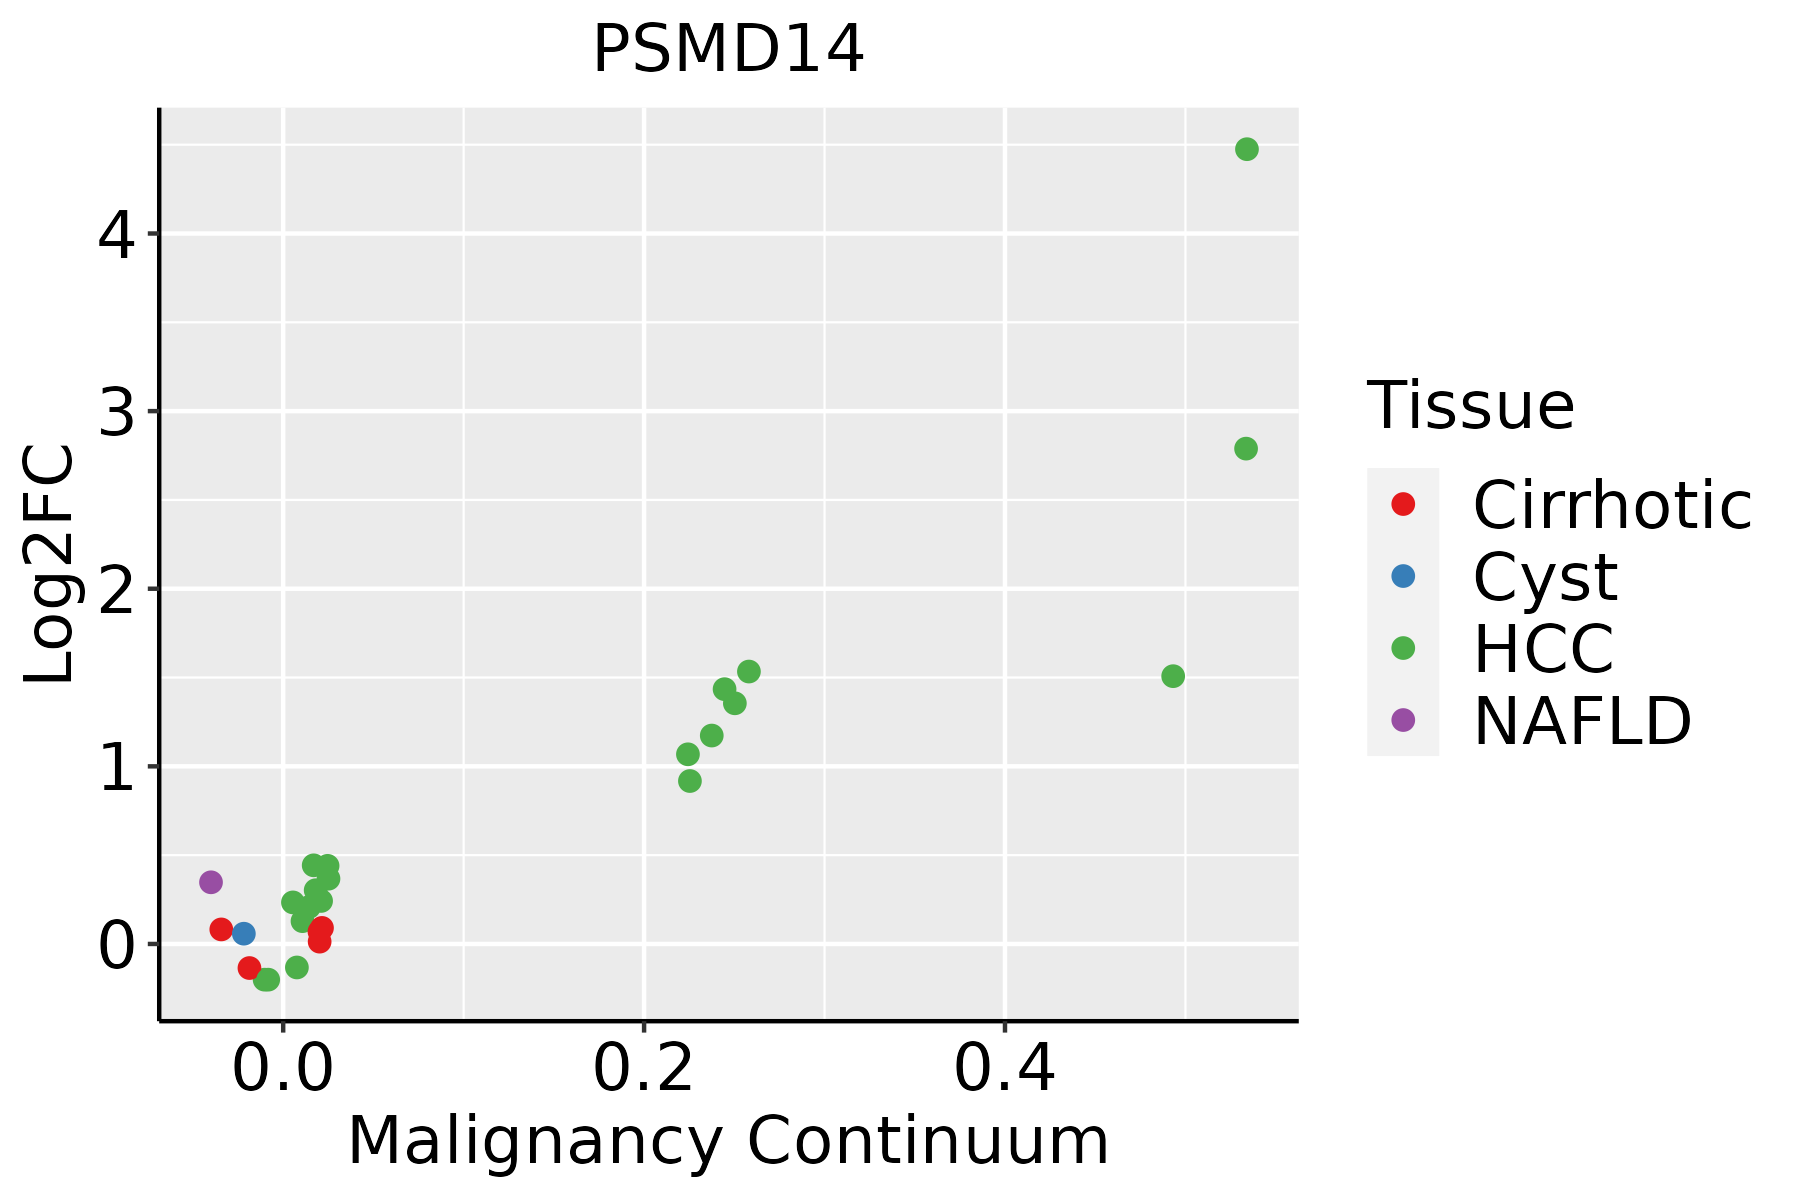 | HCC: Hepatocellular carcinoma |
| NAFLD: Non-alcoholic fatty liver disease | ||
| Oral Cavity |  | EOLP: Erosive Oral lichen planus |
| LP: leukoplakia | ||
| NEOLP: Non-erosive oral lichen planus | ||
| OSCC: Oral squamous cell carcinoma | ||
| Skin | 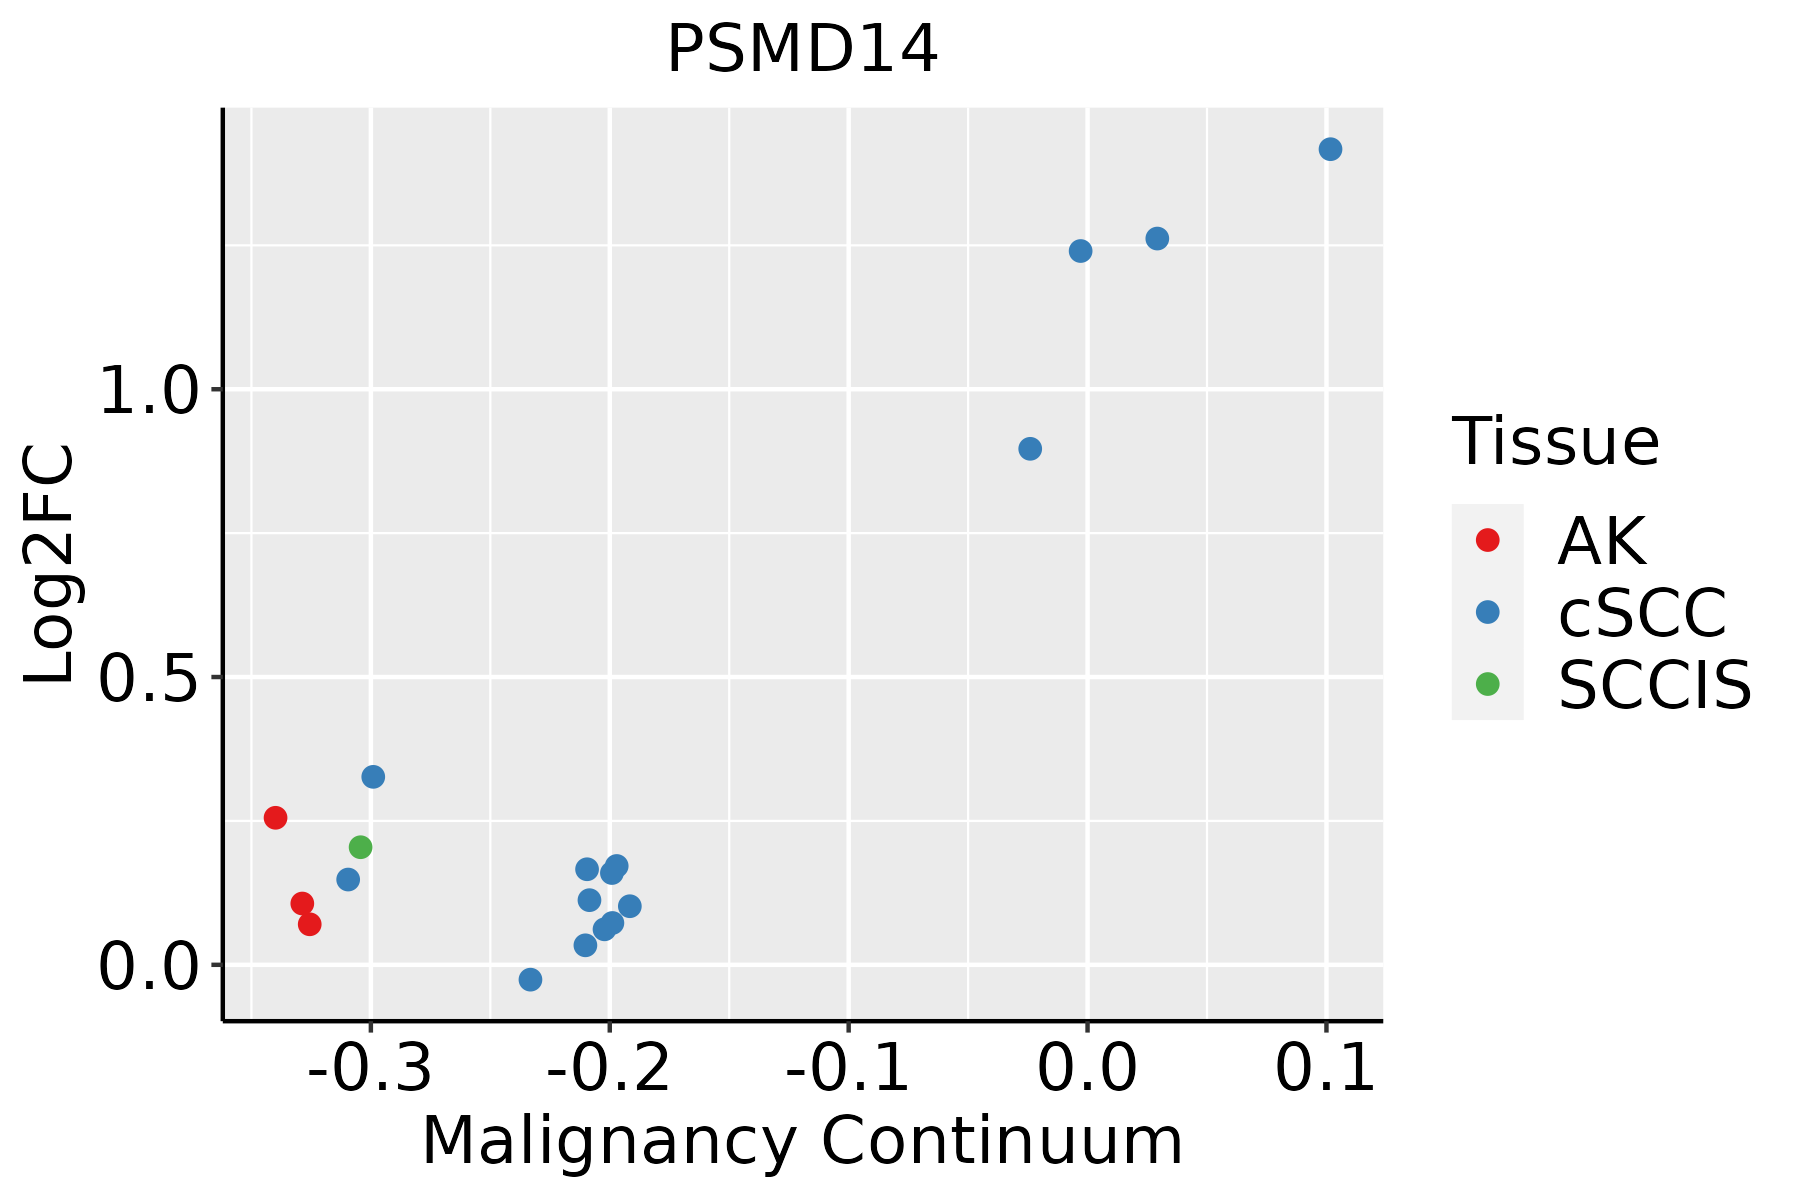 | AK: Actinic keratosis |
| cSCC: Cutaneous squamous cell carcinoma | ||
| SCCIS:squamous cell carcinoma in situ | ||
| Thyroid | 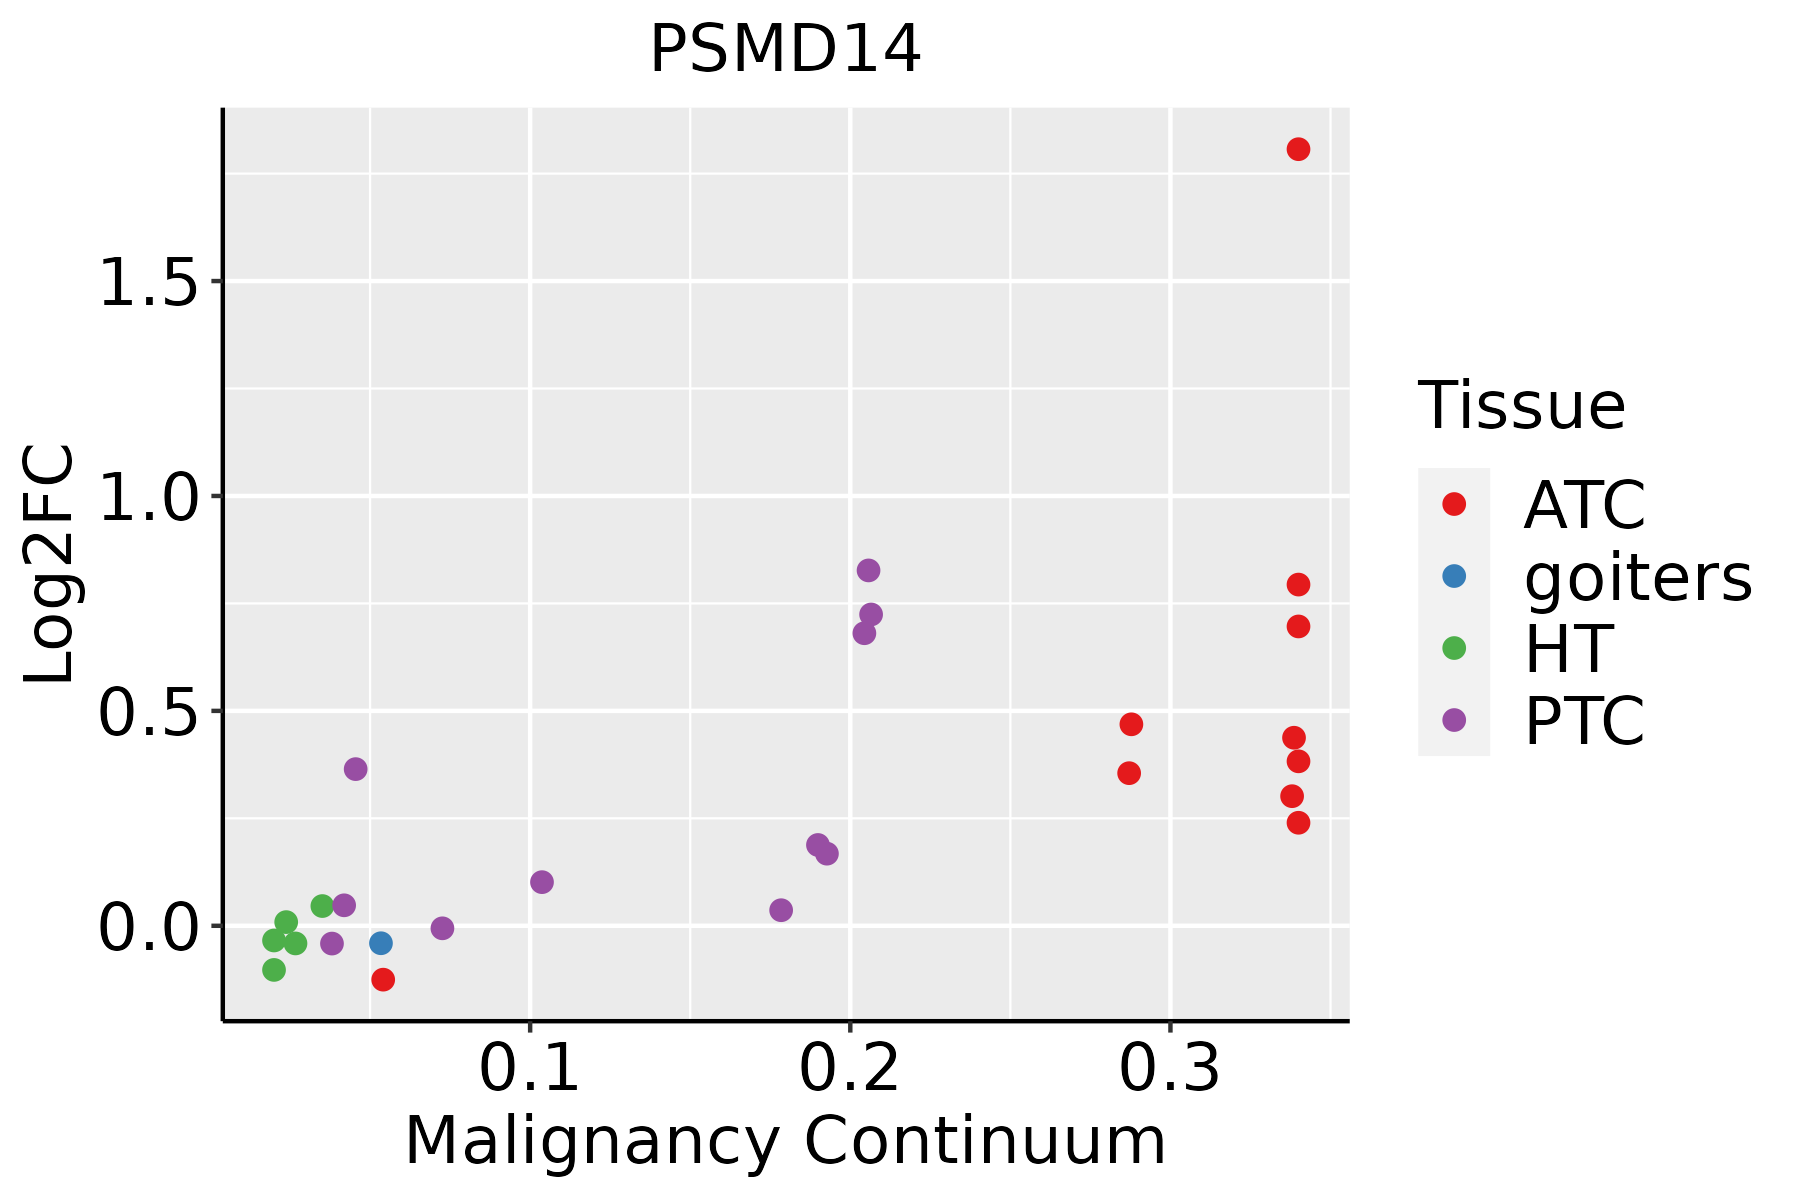 | ATC: Anaplastic thyroid cancer |
| HT: Hashimoto's thyroiditis | ||
| PTC: Papillary thyroid cancer |
| ∗log2FC in expression of this searched gene in stem-like cells from each diseased tissue sample relative to stem-like cells in normal samples in each tissue plotted against the malignancy continuum. Samples are colored based on if they are from different disease stage. |
Top |
Malignant transformation related pathway analysis |
| Find out the enriched GO biological processes and KEGG pathways involved in transition from healthy to precancer to cancer |
| Tissue | Disease Stage | Enriched GO biological Processes |
| Colorectum | AD |  |
| Colorectum | SER |  |
| Colorectum | MSS |  |
| Colorectum | MSI-H |  |
| Colorectum | FAP |  |
| ∗Top 15 enriched GO BP terms are showed in the bar plot of each disease state in each tissue. Each row represents a significant GO biological process which is colored according to the -log10(p.adjust). |
| Page: 1 2 3 4 5 6 7 8 9 |
| GO ID | Tissue | Disease Stage | Description | Gene Ratio | Bg Ratio | pvalue | p.adjust | Count |
| GO:00104987 | Liver | NAFLD | proteasomal protein catabolic process | 101/1882 | 490/18723 | 1.35e-12 | 6.09e-10 | 101 |
| GO:00421767 | Liver | NAFLD | regulation of protein catabolic process | 83/1882 | 391/18723 | 2.94e-11 | 1.01e-08 | 83 |
| GO:19030507 | Liver | NAFLD | regulation of proteolysis involved in cellular protein catabolic process | 53/1882 | 221/18723 | 1.32e-09 | 2.34e-07 | 53 |
| GO:19033627 | Liver | NAFLD | regulation of cellular protein catabolic process | 56/1882 | 255/18723 | 1.38e-08 | 1.71e-06 | 56 |
| GO:00611367 | Liver | NAFLD | regulation of proteasomal protein catabolic process | 40/1882 | 187/18723 | 3.12e-06 | 1.26e-04 | 40 |
| GO:00458627 | Liver | NAFLD | positive regulation of proteolysis | 65/1882 | 372/18723 | 6.58e-06 | 2.29e-04 | 65 |
| GO:00525477 | Liver | NAFLD | regulation of peptidase activity | 72/1882 | 461/18723 | 1.03e-04 | 2.03e-03 | 72 |
| GO:00525487 | Liver | NAFLD | regulation of endopeptidase activity | 67/1882 | 432/18723 | 2.17e-04 | 3.70e-03 | 67 |
| GO:00973056 | Liver | NAFLD | response to alcohol | 42/1882 | 253/18723 | 7.91e-04 | 9.89e-03 | 42 |
| GO:0070646 | Liver | NAFLD | protein modification by small protein removal | 29/1882 | 157/18723 | 9.11e-04 | 1.09e-02 | 29 |
| GO:0016579 | Liver | NAFLD | protein deubiquitination | 26/1882 | 139/18723 | 1.35e-03 | 1.52e-02 | 26 |
| GO:0045471 | Liver | NAFLD | response to ethanol | 24/1882 | 137/18723 | 4.89e-03 | 3.85e-02 | 24 |
| GO:0070536 | Liver | NAFLD | protein K63-linked deubiquitination | 9/1882 | 35/18723 | 6.47e-03 | 4.69e-02 | 9 |
| GO:001049822 | Liver | HCC | proteasomal protein catabolic process | 351/7958 | 490/18723 | 6.92e-40 | 1.46e-36 | 351 |
| GO:004316122 | Liver | HCC | proteasome-mediated ubiquitin-dependent protein catabolic process | 299/7958 | 412/18723 | 7.82e-36 | 8.27e-33 | 299 |
| GO:004217622 | Liver | HCC | regulation of protein catabolic process | 267/7958 | 391/18723 | 2.45e-25 | 7.38e-23 | 267 |
| GO:190336222 | Liver | HCC | regulation of cellular protein catabolic process | 182/7958 | 255/18723 | 5.91e-21 | 8.52e-19 | 182 |
| GO:190305022 | Liver | HCC | regulation of proteolysis involved in cellular protein catabolic process | 157/7958 | 221/18723 | 5.93e-18 | 6.83e-16 | 157 |
| GO:006113622 | Liver | HCC | regulation of proteasomal protein catabolic process | 134/7958 | 187/18723 | 5.03e-16 | 4.09e-14 | 134 |
| GO:004586222 | Liver | HCC | positive regulation of proteolysis | 232/7958 | 372/18723 | 5.66e-15 | 3.98e-13 | 232 |
| Page: 1 2 3 4 5 6 7 8 |
| Pathway ID | Tissue | Disease Stage | Description | Gene Ratio | Bg Ratio | pvalue | p.adjust | qvalue | Count |
| hsa05014210 | Esophagus | ESCC | Amyotrophic lateral sclerosis | 266/4205 | 364/8465 | 1.31e-20 | 2.20e-18 | 1.13e-18 | 266 |
| hsa05016210 | Esophagus | ESCC | Huntington disease | 226/4205 | 306/8465 | 1.38e-18 | 8.72e-17 | 4.46e-17 | 226 |
| hsa05012211 | Esophagus | ESCC | Parkinson disease | 201/4205 | 266/8465 | 1.56e-18 | 8.72e-17 | 4.46e-17 | 201 |
| hsa05022210 | Esophagus | ESCC | Pathways of neurodegeneration - multiple diseases | 318/4205 | 476/8465 | 6.10e-15 | 2.04e-13 | 1.05e-13 | 318 |
| hsa05010210 | Esophagus | ESCC | Alzheimer disease | 263/4205 | 384/8465 | 1.80e-14 | 5.47e-13 | 2.80e-13 | 263 |
| hsa05169210 | Esophagus | ESCC | Epstein-Barr virus infection | 151/4205 | 202/8465 | 1.55e-13 | 3.45e-12 | 1.77e-12 | 151 |
| hsa05020210 | Esophagus | ESCC | Prion disease | 193/4205 | 273/8465 | 6.42e-13 | 1.34e-11 | 6.89e-12 | 193 |
| hsa0305028 | Esophagus | ESCC | Proteasome | 44/4205 | 46/8465 | 1.05e-11 | 1.60e-10 | 8.21e-11 | 44 |
| hsa0501728 | Esophagus | ESCC | Spinocerebellar ataxia | 94/4205 | 143/8465 | 6.77e-05 | 2.90e-04 | 1.48e-04 | 94 |
| hsa0501438 | Esophagus | ESCC | Amyotrophic lateral sclerosis | 266/4205 | 364/8465 | 1.31e-20 | 2.20e-18 | 1.13e-18 | 266 |
| hsa0501638 | Esophagus | ESCC | Huntington disease | 226/4205 | 306/8465 | 1.38e-18 | 8.72e-17 | 4.46e-17 | 226 |
| hsa05012310 | Esophagus | ESCC | Parkinson disease | 201/4205 | 266/8465 | 1.56e-18 | 8.72e-17 | 4.46e-17 | 201 |
| hsa0502238 | Esophagus | ESCC | Pathways of neurodegeneration - multiple diseases | 318/4205 | 476/8465 | 6.10e-15 | 2.04e-13 | 1.05e-13 | 318 |
| hsa0501038 | Esophagus | ESCC | Alzheimer disease | 263/4205 | 384/8465 | 1.80e-14 | 5.47e-13 | 2.80e-13 | 263 |
| hsa0516937 | Esophagus | ESCC | Epstein-Barr virus infection | 151/4205 | 202/8465 | 1.55e-13 | 3.45e-12 | 1.77e-12 | 151 |
| hsa0502038 | Esophagus | ESCC | Prion disease | 193/4205 | 273/8465 | 6.42e-13 | 1.34e-11 | 6.89e-12 | 193 |
| hsa0305037 | Esophagus | ESCC | Proteasome | 44/4205 | 46/8465 | 1.05e-11 | 1.60e-10 | 8.21e-11 | 44 |
| hsa0501736 | Esophagus | ESCC | Spinocerebellar ataxia | 94/4205 | 143/8465 | 6.77e-05 | 2.90e-04 | 1.48e-04 | 94 |
| hsa0501222 | Liver | HCC | Parkinson disease | 198/4020 | 266/8465 | 9.40e-20 | 1.58e-17 | 8.76e-18 | 198 |
| hsa0501622 | Liver | HCC | Huntington disease | 219/4020 | 306/8465 | 3.06e-18 | 3.42e-16 | 1.90e-16 | 219 |
| Page: 1 2 3 4 5 |
Top |
Cell-cell communication analysis |
| Identification of potential cell-cell interactions between two cell types and their ligand-receptor pairs for different disease states |
| Ligand | Receptor | LRpair | Pathway | Tissue | Disease Stage |
| Page: 1 |
Top |
Single-cell gene regulatory network inference analysis |
| Find out the significant the regulons (TFs) and the target genes of each regulon across cell types for different disease states |
| TF | Cell Type | Tissue | Disease Stage | Target Gene | RSS | Regulon Activity |
| ∗The dot plots of a searched regulon are shown for all cell subpopulations in each disease state of each tissue based on the regulon specific score inferred using pySCENIC and by calculating the average expression. |
| Page: 1 |
Top |
Somatic mutation of malignant transformation related genes |
| Annotation of somatic variants for genes involved in malignant transformation |
| Hugo Symbol | Variant Class | Variant Classification | dbSNP RS | HGVSc | HGVSp | HGVSp Short | SWISSPROT | BIOTYPE | SIFT | PolyPhen | Tumor Sample Barcode | Tissue | Histology | Sex | Age | Stage | Therapy Types | Drugs | Outcome |
| PSMD14 | SNV | Missense_Mutation | c.104N>T | p.Ser35Phe | p.S35F | O00487 | protein_coding | deleterious(0) | probably_damaging(0.987) | TCGA-AC-A23H-01 | Breast | breast invasive carcinoma | Female | >=65 | I/II | Unknown | Unknown | PD | |
| PSMD14 | SNV | Missense_Mutation | novel | c.536N>T | p.Ser179Leu | p.S179L | O00487 | protein_coding | deleterious(0) | probably_damaging(0.99) | TCGA-AZ-4315-01 | Colorectum | colon adenocarcinoma | Male | <65 | I/II | Unknown | Unknown | SD |
| PSMD14 | SNV | Missense_Mutation | c.511N>C | p.Gly171Arg | p.G171R | O00487 | protein_coding | deleterious(0.05) | benign(0.031) | TCGA-QG-A5YW-01 | Colorectum | colon adenocarcinoma | Female | <65 | III/IV | Chemotherapy | capecitabine | CR | |
| PSMD14 | SNV | Missense_Mutation | c.615T>G | p.Ile205Met | p.I205M | O00487 | protein_coding | deleterious(0.02) | probably_damaging(0.98) | TCGA-AG-3892-01 | Colorectum | rectum adenocarcinoma | Female | <65 | I/II | Unknown | Unknown | SD | |
| PSMD14 | SNV | Missense_Mutation | rs756139595 | c.845G>A | p.Arg282His | p.R282H | O00487 | protein_coding | deleterious(0.01) | benign(0.082) | TCGA-EI-6917-01 | Colorectum | rectum adenocarcinoma | Male | <65 | III/IV | Chemotherapy | 5fluorouracil+oxaciplatina+l-folinian | SD |
| PSMD14 | SNV | Missense_Mutation | rs774696886 | c.922N>A | p.Val308Ile | p.V308I | O00487 | protein_coding | tolerated(0.37) | benign(0.015) | TCGA-AP-A0LM-01 | Endometrium | uterine corpus endometrioid carcinoma | Female | <65 | III/IV | Chemotherapy | cisplatin | SD |
| PSMD14 | SNV | Missense_Mutation | c.277N>T | p.Ala93Ser | p.A93S | O00487 | protein_coding | tolerated(0.08) | benign(0.023) | TCGA-AP-A1DV-01 | Endometrium | uterine corpus endometrioid carcinoma | Female | <65 | I/II | Unknown | Unknown | SD | |
| PSMD14 | SNV | Missense_Mutation | rs774696886 | c.922N>A | p.Val308Ile | p.V308I | O00487 | protein_coding | tolerated(0.37) | benign(0.015) | TCGA-AX-A1CE-01 | Endometrium | uterine corpus endometrioid carcinoma | Female | <65 | I/II | Unspecific | Paclitaxel | SD |
| PSMD14 | SNV | Missense_Mutation | novel | c.245T>C | p.Val82Ala | p.V82A | O00487 | protein_coding | tolerated(0.06) | benign(0.377) | TCGA-AX-A2HA-01 | Endometrium | uterine corpus endometrioid carcinoma | Female | <65 | I/II | Unknown | Unknown | SD |
| PSMD14 | SNV | Missense_Mutation | c.226C>T | p.Pro76Ser | p.P76S | O00487 | protein_coding | deleterious(0) | probably_damaging(1) | TCGA-AX-A2HD-01 | Endometrium | uterine corpus endometrioid carcinoma | Female | >=65 | III/IV | Unknown | Unknown | SD |
| Page: 1 2 3 |
Top |
Related drugs of malignant transformation related genes |
| Identification of chemicals and drugs interact with genes involved in malignant transfromation |
| (DGIdb 4.0) |
| Entrez ID | Symbol | Category | Interaction Types | Drug Claim Name | Drug Name | PMIDs |
| 10213 | PSMD14 | PROTEASE, NEUTRAL ZINC METALLOPEPTIDASE, ENZYME, DRUGGABLE GENOME | inhibitor | CHEMBL451887 | CARFILZOMIB | |
| 10213 | PSMD14 | PROTEASE, NEUTRAL ZINC METALLOPEPTIDASE, ENZYME, DRUGGABLE GENOME | SULFURETIN | SULFURETIN | ||
| 10213 | PSMD14 | PROTEASE, NEUTRAL ZINC METALLOPEPTIDASE, ENZYME, DRUGGABLE GENOME | CARFILZOMIB | CARFILZOMIB | 24524217 | |
| 10213 | PSMD14 | PROTEASE, NEUTRAL ZINC METALLOPEPTIDASE, ENZYME, DRUGGABLE GENOME | inhibitor | CHEMBL2103884 | OPROZOMIB | |
| 10213 | PSMD14 | PROTEASE, NEUTRAL ZINC METALLOPEPTIDASE, ENZYME, DRUGGABLE GENOME | inhibitor | BORTEZOMIB | BORTEZOMIB | |
| 10213 | PSMD14 | PROTEASE, NEUTRAL ZINC METALLOPEPTIDASE, ENZYME, DRUGGABLE GENOME | DNDI1417884 | CHEMBL1346025 | ||
| 10213 | PSMD14 | PROTEASE, NEUTRAL ZINC METALLOPEPTIDASE, ENZYME, DRUGGABLE GENOME | BAS03450373 | CHEMBL1576310 | ||
| 10213 | PSMD14 | PROTEASE, NEUTRAL ZINC METALLOPEPTIDASE, ENZYME, DRUGGABLE GENOME | inhibitor | CHEMBL3545432 | IXAZOMIB CITRATE | |
| 10213 | PSMD14 | PROTEASE, NEUTRAL ZINC METALLOPEPTIDASE, ENZYME, DRUGGABLE GENOME | DNDI1416969 | CHEMBL1453126 | ||
| 10213 | PSMD14 | PROTEASE, NEUTRAL ZINC METALLOPEPTIDASE, ENZYME, DRUGGABLE GENOME | inhibitor | CARFILZOMIB | CARFILZOMIB |
| Page: 1 2 |

Copyright 2023-Present -The University of Texas Health Science Center at Houston |