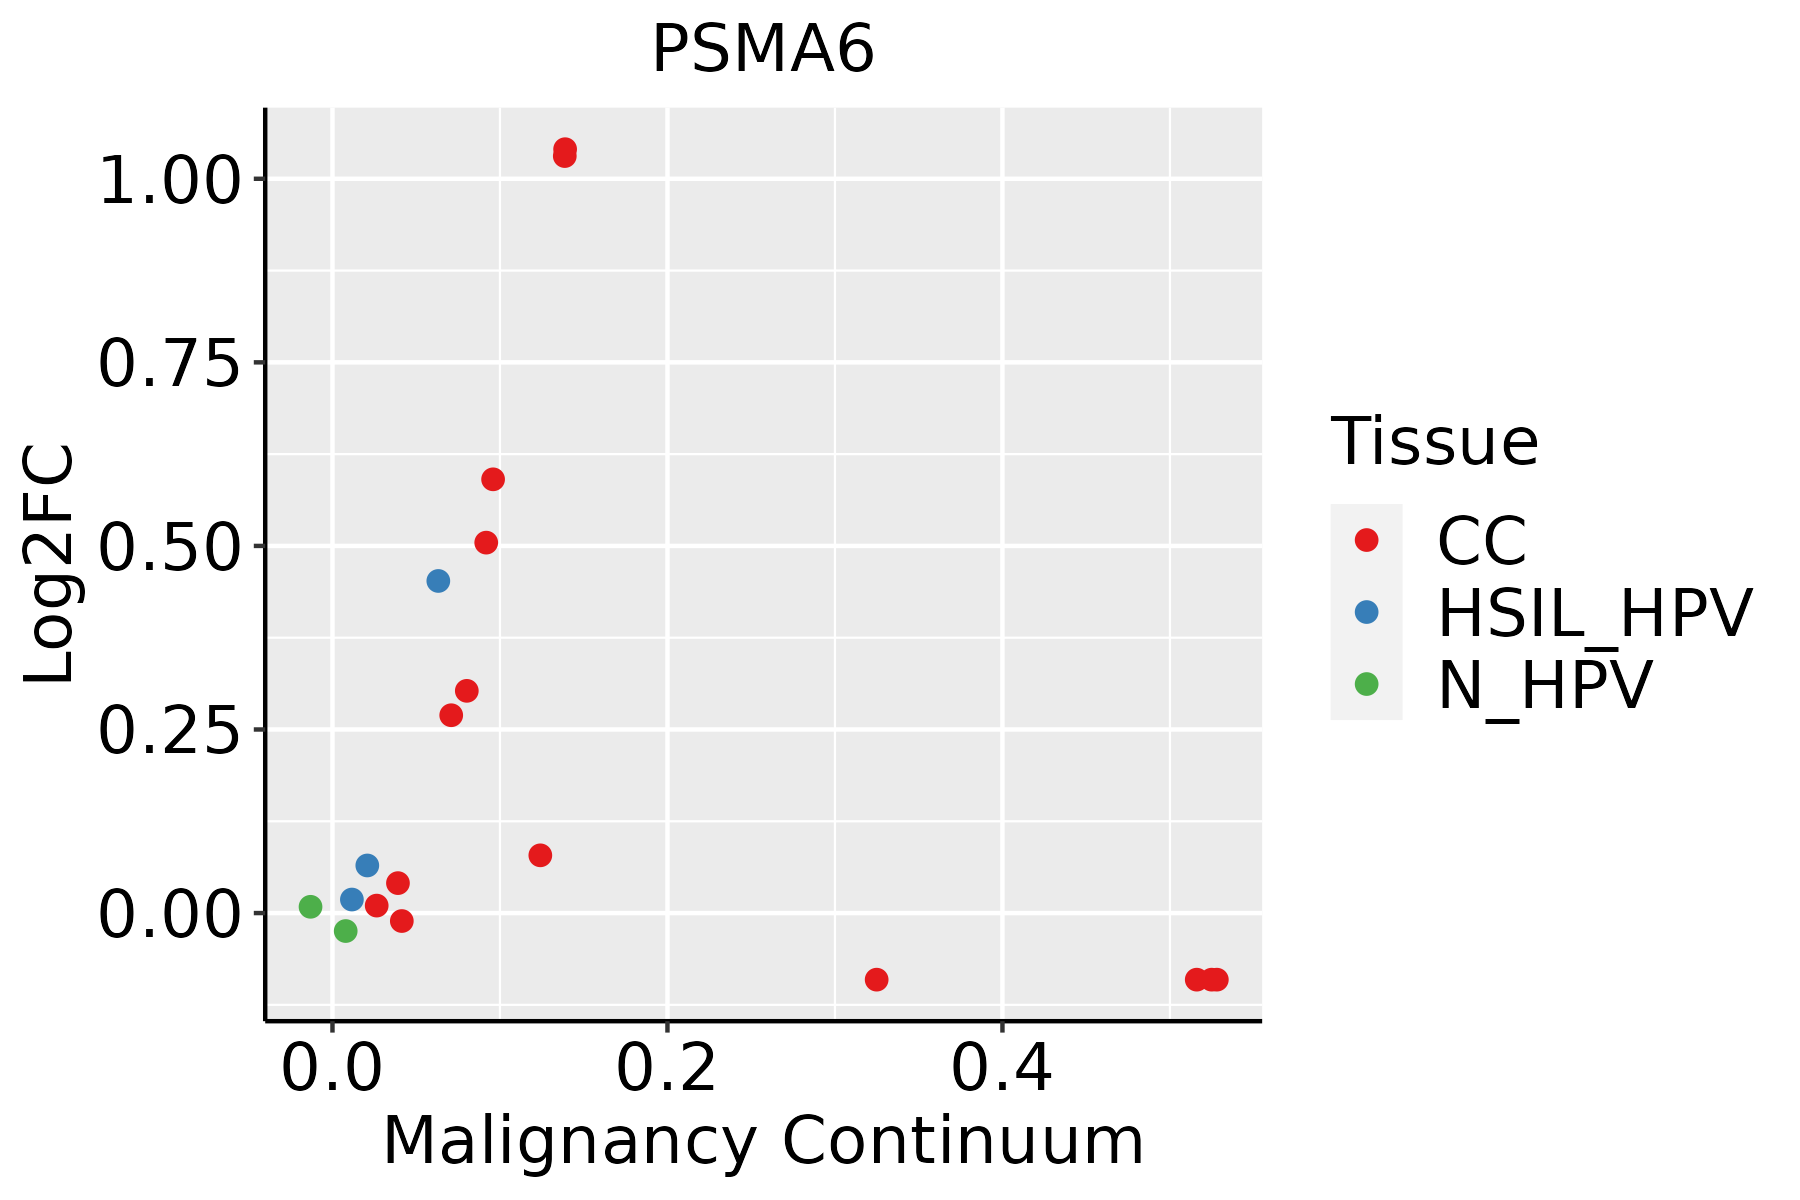
| Tissue | Expression Dynamics | Abbreviation |
| Cervix |  | CC: Cervix cancer |
| HSIL_HPV: HPV-infected high-grade squamous intraepithelial lesions |
| N_HPV: HPV-infected normal cervix |
| Esophagus |  | ESCC: Esophageal squamous cell carcinoma |
| HGIN: High-grade intraepithelial neoplasias |
| LGIN: Low-grade intraepithelial neoplasias |
| GC |  | CAG: Chronic atrophic gastritis |
| CAG with IM: Chronic atrophic gastritis with intestinal metaplasia |
| CSG: Chronic superficial gastritis |
| GC: Gastric cancer |
| SIM: Severe intestinal metaplasia |
| WIM: Wild intestinal metaplasia |
| Liver |  | HCC: Hepatocellular carcinoma |
| NAFLD: Non-alcoholic fatty liver disease |
| Lung |  | AAH: Atypical adenomatous hyperplasia |
| AIS: Adenocarcinoma in situ |
| IAC: Invasive lung adenocarcinoma |
| MIA: Minimally invasive adenocarcinoma |
| Oral Cavity |  | EOLP: Erosive Oral lichen planus |
| LP: leukoplakia |
| NEOLP: Non-erosive oral lichen planus |
| OSCC: Oral squamous cell carcinoma |
| Prostate |  | BPH: Benign Prostatic Hyperplasia |
| Skin |  | AK: Actinic keratosis |
| cSCC: Cutaneous squamous cell carcinoma |
| SCCIS:squamous cell carcinoma in situ |
| GO ID | Tissue | Disease Stage | Description | Gene Ratio | Bg Ratio | pvalue | p.adjust | Count |
| GO:00510914 | Lung | IAC | positive regulation of DNA-binding transcription factor activity | 50/2061 | 260/18723 | 5.87e-05 | 1.29e-03 | 50 |
| GO:0051092 | Lung | IAC | positive regulation of NF-kappaB transcription factor activity | 32/2061 | 152/18723 | 2.25e-04 | 3.90e-03 | 32 |
| GO:001049813 | Lung | AIS | proteasomal protein catabolic process | 87/1849 | 490/18723 | 4.15e-08 | 5.03e-06 | 87 |
| GO:00510921 | Lung | AIS | positive regulation of NF-kappaB transcription factor activity | 28/1849 | 152/18723 | 8.81e-04 | 1.19e-02 | 28 |
| GO:005109011 | Lung | AIS | regulation of DNA-binding transcription factor activity | 64/1849 | 440/18723 | 1.04e-03 | 1.36e-02 | 64 |
| GO:005109111 | Lung | AIS | positive regulation of DNA-binding transcription factor activity | 41/1849 | 260/18723 | 1.77e-03 | 2.01e-02 | 41 |
| GO:001049820 | Oral cavity | OSCC | proteasomal protein catabolic process | 336/7305 | 490/18723 | 5.45e-41 | 8.63e-38 | 336 |
| GO:00510907 | Oral cavity | OSCC | regulation of DNA-binding transcription factor activity | 221/7305 | 440/18723 | 9.06e-07 | 1.23e-05 | 221 |
| GO:00510917 | Oral cavity | OSCC | positive regulation of DNA-binding transcription factor activity | 134/7305 | 260/18723 | 2.52e-05 | 2.35e-04 | 134 |
| GO:00510925 | Oral cavity | OSCC | positive regulation of NF-kappaB transcription factor activity | 82/7305 | 152/18723 | 1.28e-04 | 9.13e-04 | 82 |
| GO:0010498110 | Oral cavity | LP | proteasomal protein catabolic process | 224/4623 | 490/18723 | 9.57e-25 | 4.00e-22 | 224 |
| GO:005109213 | Oral cavity | LP | positive regulation of NF-kappaB transcription factor activity | 61/4623 | 152/18723 | 1.82e-05 | 3.11e-04 | 61 |
| GO:005109015 | Oral cavity | LP | regulation of DNA-binding transcription factor activity | 147/4623 | 440/18723 | 2.00e-05 | 3.35e-04 | 147 |
| GO:005109114 | Oral cavity | LP | positive regulation of DNA-binding transcription factor activity | 86/4623 | 260/18723 | 1.35e-03 | 1.08e-02 | 86 |
| GO:001049825 | Oral cavity | EOLP | proteasomal protein catabolic process | 108/2218 | 490/18723 | 7.79e-11 | 9.51e-09 | 108 |
| GO:005109021 | Oral cavity | EOLP | regulation of DNA-binding transcription factor activity | 80/2218 | 440/18723 | 5.77e-05 | 7.31e-04 | 80 |
| GO:00507274 | Oral cavity | EOLP | regulation of inflammatory response | 66/2218 | 386/18723 | 1.34e-03 | 9.33e-03 | 66 |
| GO:005109221 | Oral cavity | EOLP | positive regulation of NF-kappaB transcription factor activity | 29/2218 | 152/18723 | 6.29e-03 | 3.13e-02 | 29 |
| GO:001049831 | Oral cavity | NEOLP | proteasomal protein catabolic process | 103/2005 | 490/18723 | 1.08e-11 | 1.65e-09 | 103 |
| GO:005109031 | Oral cavity | NEOLP | regulation of DNA-binding transcription factor activity | 72/2005 | 440/18723 | 1.66e-04 | 1.84e-03 | 72 |
| Hugo Symbol | Variant Class | Variant Classification | dbSNP RS | HGVSc | HGVSp | HGVSp Short | SWISSPROT | BIOTYPE | SIFT | PolyPhen | Tumor Sample Barcode | Tissue | Histology | Sex | Age | Stage | Therapy Types | Drugs | Outcome |
| PSMA6 | SNV | Missense_Mutation | | c.253G>T | p.Ala85Ser | p.A85S | P60900 | protein_coding | deleterious(0.04) | possibly_damaging(0.506) | TCGA-A8-A07R-01 | Breast | breast invasive carcinoma | Female | >=65 | III/IV | Ancillary | zoledronic | SD |
| PSMA6 | SNV | Missense_Mutation | rs267603983 | c.506G>A | p.Gly169Glu | p.G169E | P60900 | protein_coding | deleterious(0) | probably_damaging(1) | TCGA-D8-A27G-01 | Breast | breast invasive carcinoma | Female | >=65 | I/II | Unknown | Unknown | SD |
| PSMA6 | SNV | Missense_Mutation | novel | c.355N>T | p.Ala119Ser | p.A119S | P60900 | protein_coding | deleterious(0.02) | benign(0.432) | TCGA-C5-A8ZZ-01 | Cervix | cervical & endocervical cancer | Female | <65 | I/II | Unspecific | Cisplatin | SD |
| PSMA6 | deletion | Frame_Shift_Del | | c.539delN | p.Val183Ter | p.V183* | P60900 | protein_coding | | | TCGA-EA-A410-01 | Cervix | cervical & endocervical cancer | Female | <65 | I/II | Unknown | Unknown | SD |
| PSMA6 | SNV | Missense_Mutation | rs760361768 | c.386N>T | p.Ala129Val | p.A129V | P60900 | protein_coding | deleterious(0.02) | probably_damaging(0.938) | TCGA-AD-6964-01 | Colorectum | colon adenocarcinoma | Male | <65 | III/IV | Chemotherapy | folfox | PD |
| PSMA6 | SNV | Missense_Mutation | rs752794747 | c.503C>T | p.Ala168Val | p.A168V | P60900 | protein_coding | tolerated(0.4) | benign(0.006) | TCGA-A5-A0G2-01 | Endometrium | uterine corpus endometrioid carcinoma | Female | <65 | III/IV | Unknown | Unknown | SD |
| PSMA6 | SNV | Missense_Mutation | novel | c.4T>C | p.Ser2Pro | p.S2P | P60900 | protein_coding | deleterious(0) | probably_damaging(0.939) | TCGA-AP-A051-01 | Endometrium | uterine corpus endometrioid carcinoma | Female | >=65 | I/II | Unknown | Unknown | SD |
| PSMA6 | SNV | Missense_Mutation | novel | c.400N>A | p.Leu134Ile | p.L134I | P60900 | protein_coding | deleterious(0.01) | possibly_damaging(0.908) | TCGA-FI-A2D5-01 | Endometrium | uterine corpus endometrioid carcinoma | Female | <65 | III/IV | Chemotherapy | carboplatinum | PD |
| PSMA6 | deletion | Frame_Shift_Del | | c.546delA | p.Val183Ter | p.V183* | P60900 | protein_coding | | | TCGA-B5-A0JZ-01 | Endometrium | uterine corpus endometrioid carcinoma | Female | <65 | III/IV | Chemotherapy | carboplatin | PD |
| PSMA6 | deletion | Frame_Shift_Del | | c.539delN | p.Val183Ter | p.V183* | P60900 | protein_coding | | | TCGA-D1-A0ZS-01 | Endometrium | uterine corpus endometrioid carcinoma | Female | <65 | I/II | Unknown | Unknown | SD |
| Entrez ID | Symbol | Category | Interaction Types | Drug Claim Name | Drug Name | PMIDs |
| 5687 | PSMA6 | PROTEASE, DRUGGABLE GENOME | inhibitor | CHEMBL451887 | CARFILZOMIB | |
| 5687 | PSMA6 | PROTEASE, DRUGGABLE GENOME | inhibitor | CARFILZOMIB | CARFILZOMIB | |
| 5687 | PSMA6 | PROTEASE, DRUGGABLE GENOME | inhibitor | CHEMBL2103884 | OPROZOMIB | |
| 5687 | PSMA6 | PROTEASE, DRUGGABLE GENOME | inhibitor | CHEMBL325041 | BORTEZOMIB | |
| 5687 | PSMA6 | PROTEASE, DRUGGABLE GENOME | inhibitor | CHEMBL371405 | MARIZOMIB | |
| 5687 | PSMA6 | PROTEASE, DRUGGABLE GENOME | | CARFILZOMIB | CARFILZOMIB | 24524217 |
| 5687 | PSMA6 | PROTEASE, DRUGGABLE GENOME | inhibitor | CHEMBL3545432 | IXAZOMIB CITRATE | |
| 5687 | PSMA6 | PROTEASE, DRUGGABLE GENOME | | BORTEZOMIB | BORTEZOMIB | 24524217 |
| 5687 | PSMA6 | PROTEASE, DRUGGABLE GENOME | inhibitor | BORTEZOMIB | BORTEZOMIB | |


 Identification of the aberrant gene expression in precancerous and cancerous lesions by comparing the gene expression of stem-like cells in diseased tissues with normal stem cells
 Find out the enriched GO biological processes and KEGG pathways involved in transition from healthy to precancer to cancer


 Identification of potential cell-cell interactions between two cell types and their ligand-receptor pairs for different disease states
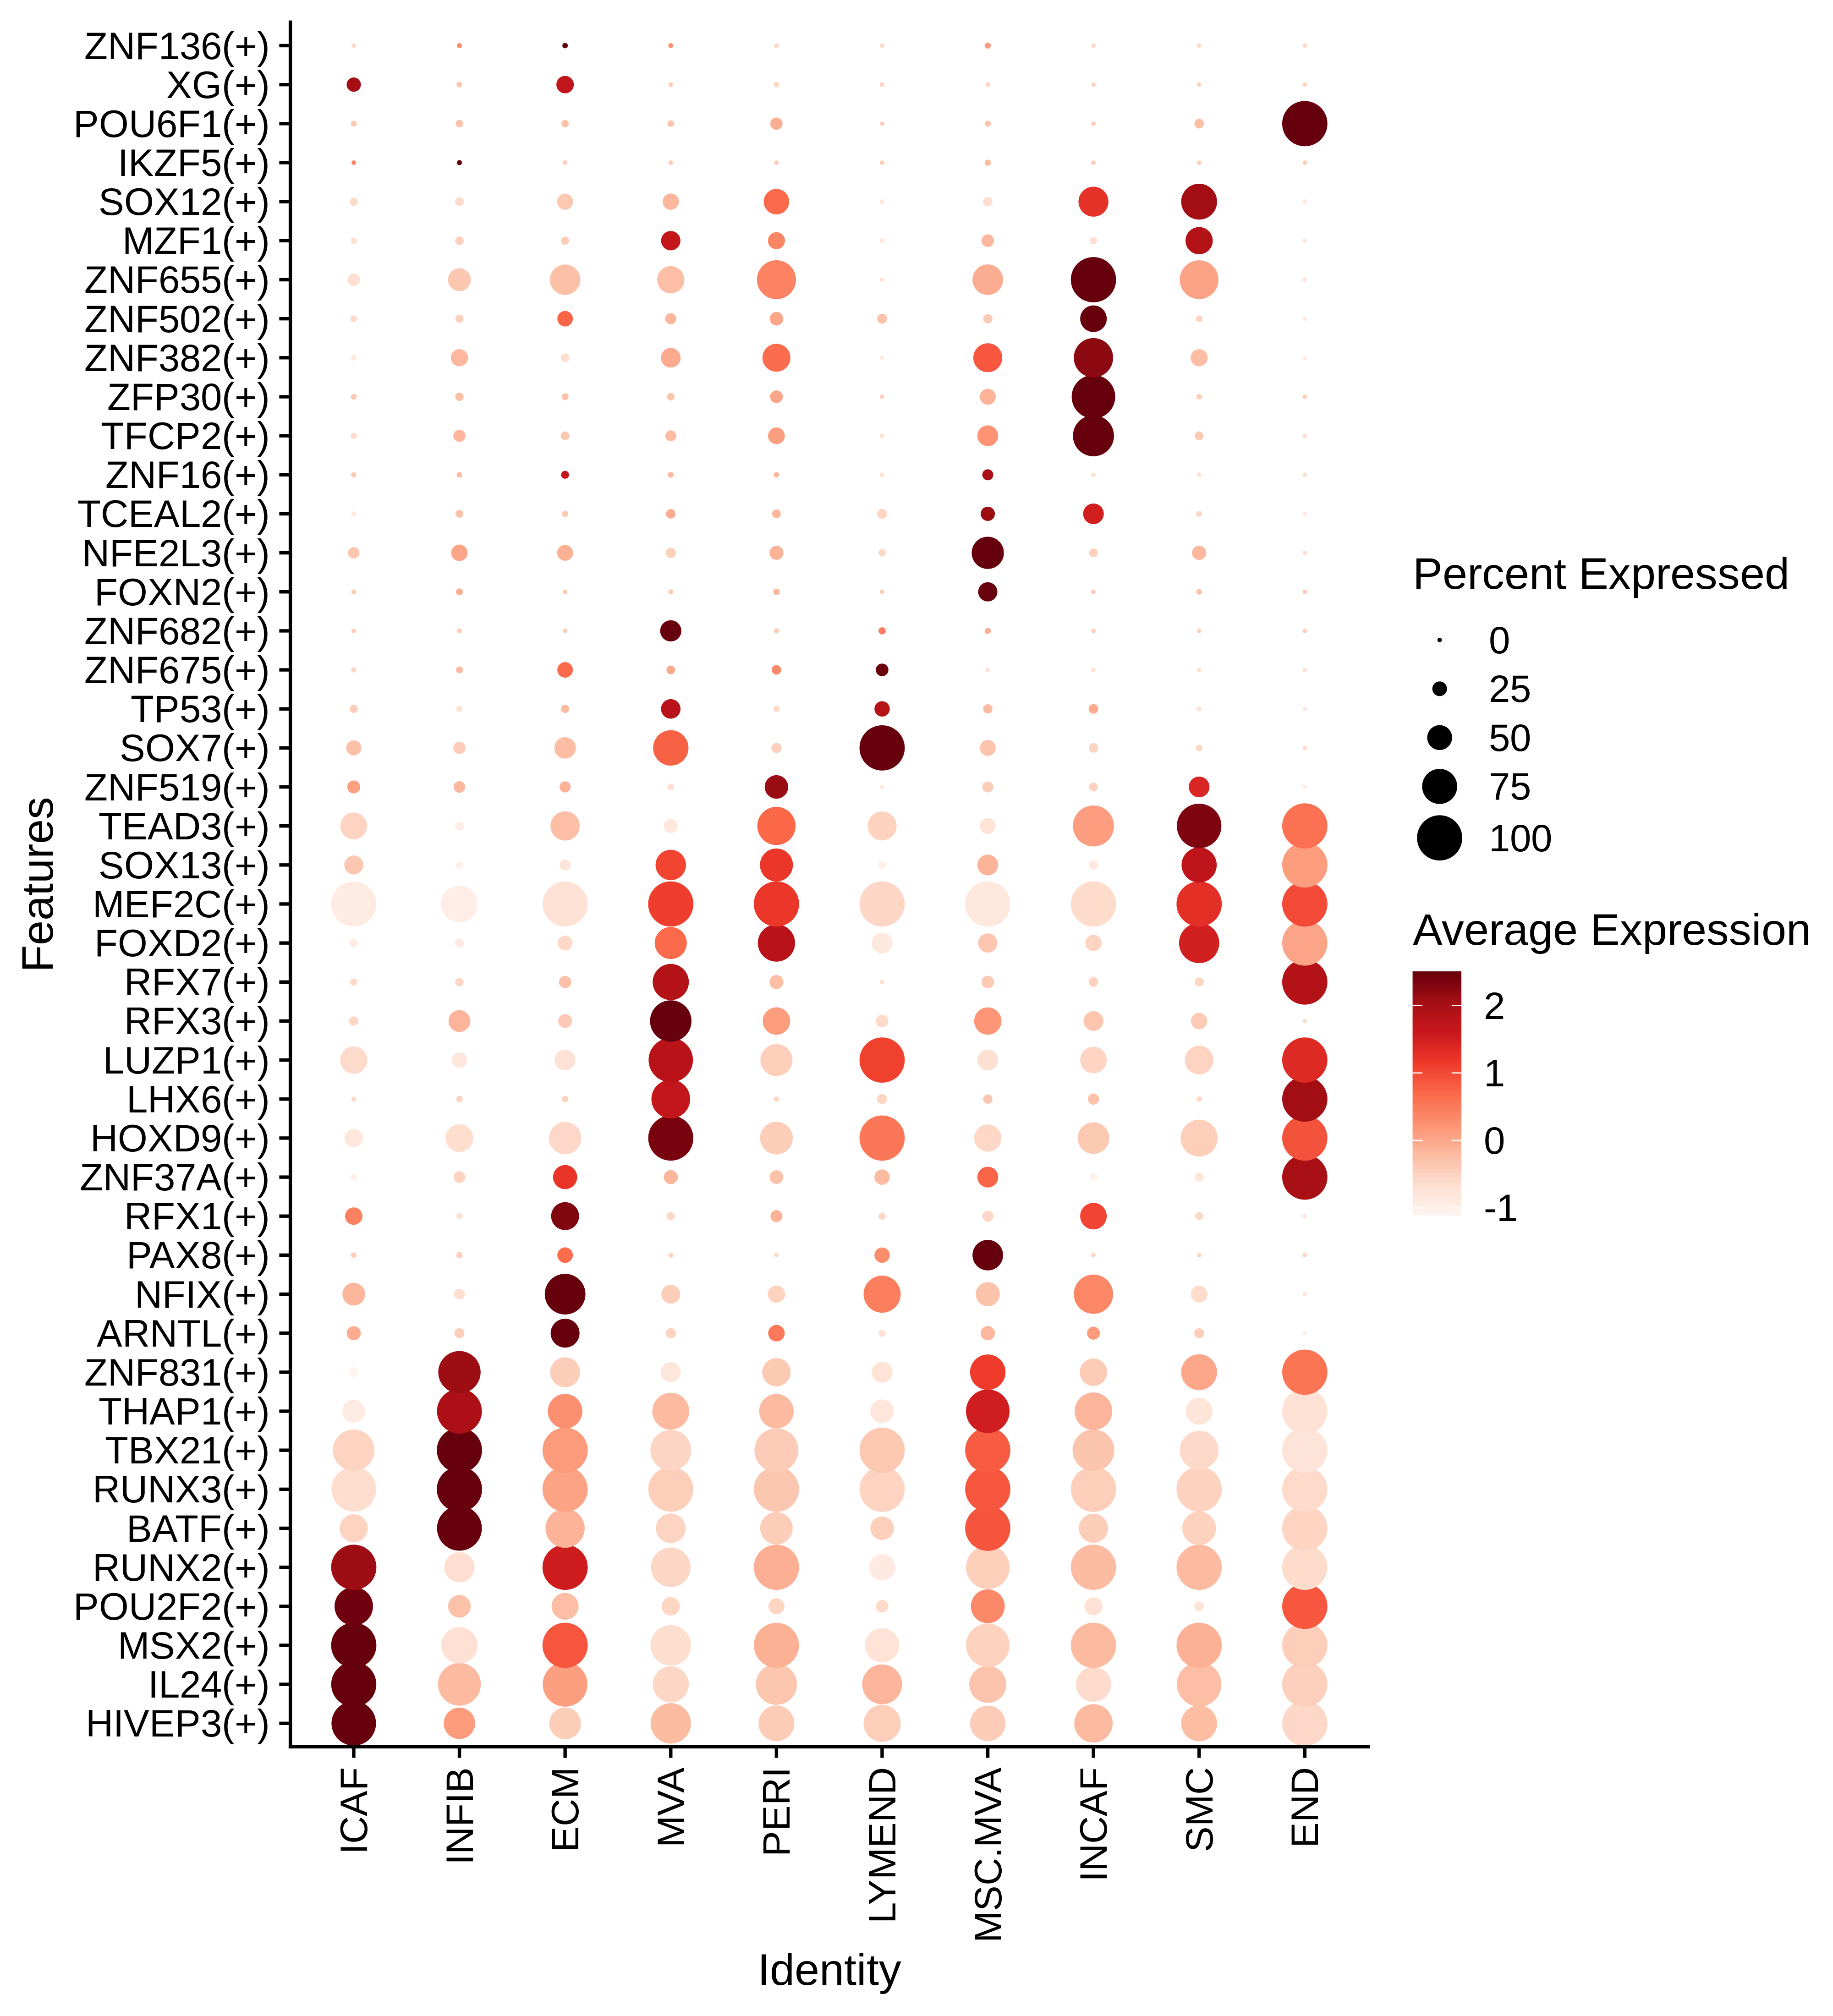
 Find out the significant the regulons (TFs) and the target genes of each regulon across cell types for different disease states

 Annotation of somatic variants for genes involved in malignant transformation
 Identification of chemicals and drugs interact with genes involved in malignant transfromation


