
|
|||||
|
 | |
| |
| |
| |
| |
| |
|
Gene: PSIP1 |
Gene summary for PSIP1 |
| Gene information | Species | Human | Gene symbol | PSIP1 | Gene ID | 11168 |
| Gene name | PC4 and SFRS1 interacting protein 1 | |
| Gene Alias | DFS70 | |
| Cytomap | 9p22.3 | |
| Gene Type | protein-coding | GO ID | GO:0000245 | UniProtAcc | O75475 |
Top |
Malignant transformation analysis |
| Identification of the aberrant gene expression in precancerous and cancerous lesions by comparing the gene expression of stem-like cells in diseased tissues with normal stem cells |
| Entrez ID | Symbol | Replicates | Species | Organ | Tissue | Adj P-value | Log2FC | Malignancy |
| 11168 | PSIP1 | GSM4909281 | Human | Breast | IDC | 9.26e-28 | 5.59e-01 | 0.21 |
| 11168 | PSIP1 | GSM4909282 | Human | Breast | IDC | 3.62e-43 | 7.38e-01 | -0.0288 |
| 11168 | PSIP1 | GSM4909285 | Human | Breast | IDC | 2.82e-25 | 4.95e-01 | 0.21 |
| 11168 | PSIP1 | GSM4909319 | Human | Breast | IDC | 4.62e-02 | -5.43e-02 | 0.1563 |
| 11168 | PSIP1 | DCIS2 | Human | Breast | DCIS | 1.27e-33 | 1.66e-01 | 0.0085 |
| 11168 | PSIP1 | HTA11_2487_2000001011 | Human | Colorectum | SER | 1.56e-03 | 3.51e-01 | -0.1808 |
| 11168 | PSIP1 | HTA11_1938_2000001011 | Human | Colorectum | AD | 2.33e-03 | 3.85e-01 | -0.0811 |
| 11168 | PSIP1 | HTA11_78_2000001011 | Human | Colorectum | AD | 2.31e-07 | 5.09e-01 | -0.1088 |
| 11168 | PSIP1 | HTA11_347_2000001011 | Human | Colorectum | AD | 6.48e-37 | 1.00e+00 | -0.1954 |
| 11168 | PSIP1 | HTA11_411_2000001011 | Human | Colorectum | SER | 7.10e-03 | 7.10e-01 | -0.2602 |
| 11168 | PSIP1 | HTA11_83_2000001011 | Human | Colorectum | SER | 2.69e-03 | 4.16e-01 | -0.1526 |
| 11168 | PSIP1 | HTA11_696_2000001011 | Human | Colorectum | AD | 2.21e-03 | 2.66e-01 | -0.1464 |
| 11168 | PSIP1 | HTA11_866_2000001011 | Human | Colorectum | AD | 1.12e-07 | 3.68e-01 | -0.1001 |
| 11168 | PSIP1 | HTA11_1391_2000001011 | Human | Colorectum | AD | 6.15e-13 | 5.55e-01 | -0.059 |
| 11168 | PSIP1 | HTA11_546_2000001011 | Human | Colorectum | AD | 1.21e-07 | 5.25e-01 | -0.0842 |
| 11168 | PSIP1 | HTA11_7862_2000001011 | Human | Colorectum | AD | 2.91e-02 | 2.67e-01 | -0.0179 |
| 11168 | PSIP1 | HTA11_7663_2000001011 | Human | Colorectum | SER | 2.20e-03 | 5.56e-01 | 0.0131 |
| 11168 | PSIP1 | HTA11_10623_2000001011 | Human | Colorectum | AD | 2.37e-02 | 4.53e-01 | -0.0177 |
| 11168 | PSIP1 | HTA11_99999965062_69753 | Human | Colorectum | MSI-H | 2.96e-03 | 1.09e+00 | 0.3487 |
| 11168 | PSIP1 | HTA11_99999965104_69814 | Human | Colorectum | MSS | 8.66e-08 | 5.27e-01 | 0.281 |
| Page: 1 2 3 4 5 6 7 8 |
| Tissue | Expression Dynamics | Abbreviation |
| Breast | 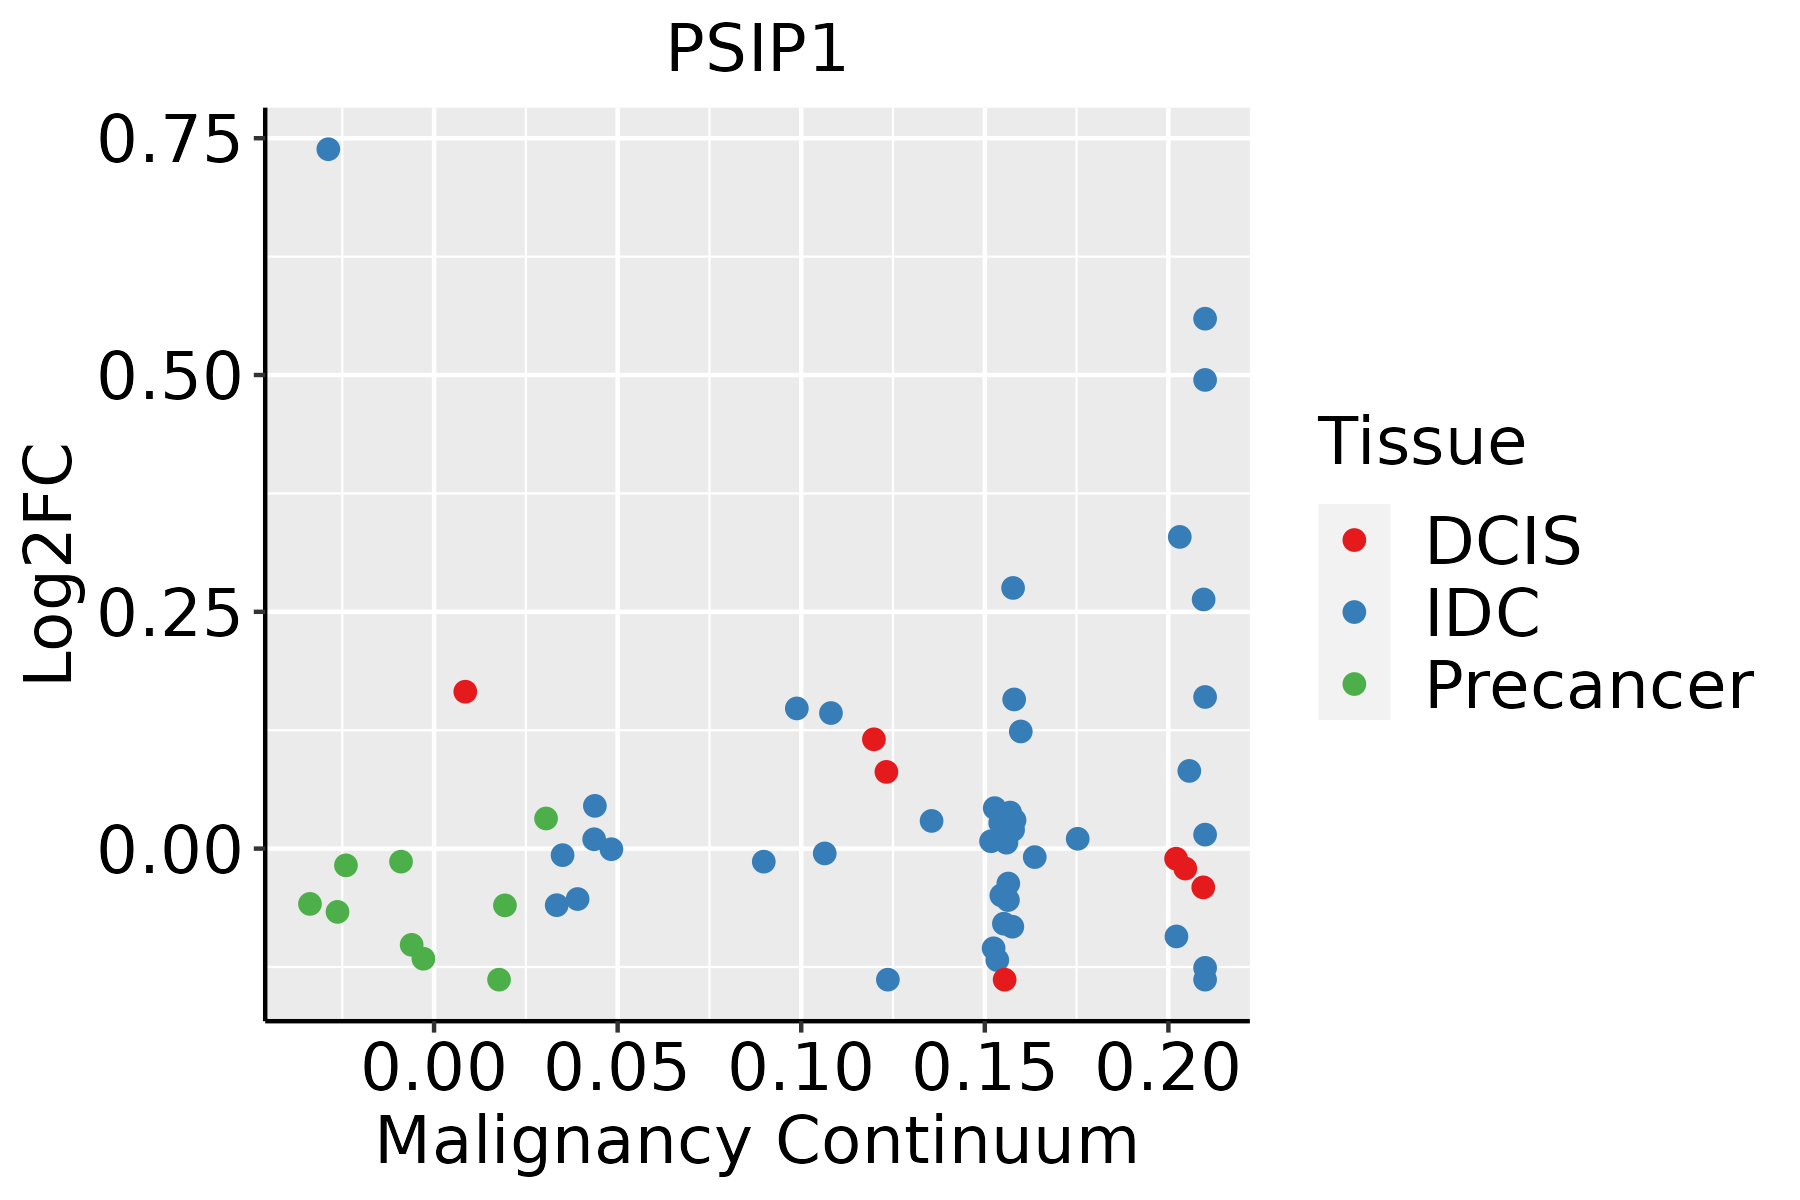 | IDC: Invasive ductal carcinoma |
| DCIS: Ductal carcinoma in situ | ||
| Precancer(BRCA1-mut): Precancerous lesion from BRCA1 mutation carriers | ||
| Colorectum (GSE201348) |  | FAP: Familial adenomatous polyposis |
| CRC: Colorectal cancer | ||
| Colorectum (HTA11) |  | AD: Adenomas |
| SER: Sessile serrated lesions | ||
| MSI-H: Microsatellite-high colorectal cancer | ||
| MSS: Microsatellite stable colorectal cancer | ||
| Esophagus |  | ESCC: Esophageal squamous cell carcinoma |
| HGIN: High-grade intraepithelial neoplasias | ||
| LGIN: Low-grade intraepithelial neoplasias | ||
| Liver | 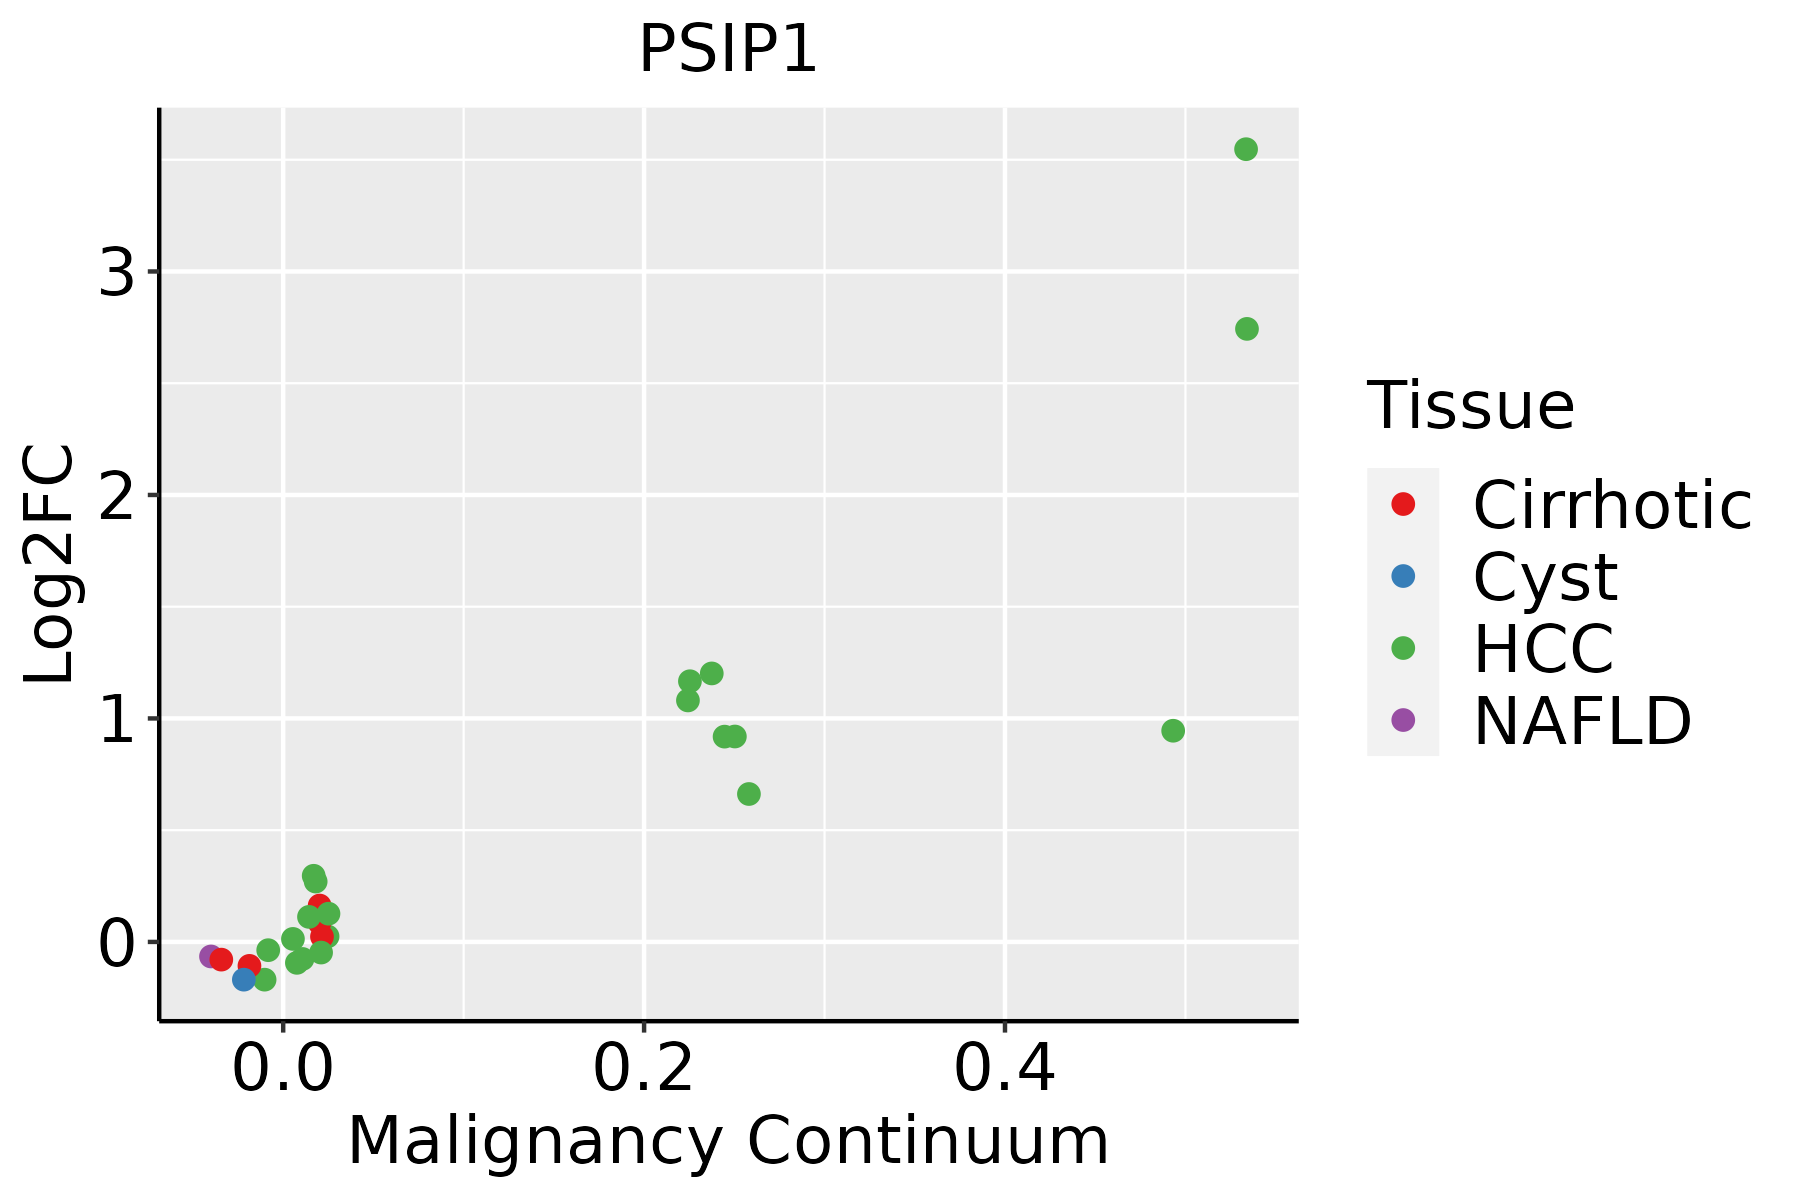 | HCC: Hepatocellular carcinoma |
| NAFLD: Non-alcoholic fatty liver disease | ||
| Oral Cavity |  | EOLP: Erosive Oral lichen planus |
| LP: leukoplakia | ||
| NEOLP: Non-erosive oral lichen planus | ||
| OSCC: Oral squamous cell carcinoma | ||
| Prostate |  | BPH: Benign Prostatic Hyperplasia |
| Thyroid |  | ATC: Anaplastic thyroid cancer |
| HT: Hashimoto's thyroiditis | ||
| PTC: Papillary thyroid cancer |
| ∗log2FC in expression of this searched gene in stem-like cells from each diseased tissue sample relative to stem-like cells in normal samples in each tissue plotted against the malignancy continuum. Samples are colored based on if they are from different disease stage. |
Top |
Malignant transformation related pathway analysis |
| Find out the enriched GO biological processes and KEGG pathways involved in transition from healthy to precancer to cancer |
| Tissue | Disease Stage | Enriched GO biological Processes |
| Colorectum | AD |  |
| Colorectum | SER |  |
| Colorectum | MSS |  |
| Colorectum | MSI-H |  |
| Colorectum | FAP |  |
| ∗Top 15 enriched GO BP terms are showed in the bar plot of each disease state in each tissue. Each row represents a significant GO biological process which is colored according to the -log10(p.adjust). |
| Page: 1 2 3 4 5 6 7 8 9 |
| GO ID | Tissue | Disease Stage | Description | Gene Ratio | Bg Ratio | pvalue | p.adjust | Count |
| GO:0008380 | Colorectum | AD | RNA splicing | 169/3918 | 434/18723 | 3.59e-18 | 2.04e-15 | 169 |
| GO:0000377 | Colorectum | AD | RNA splicing, via transesterification reactions with bulged adenosine as nucleophile | 130/3918 | 320/18723 | 5.88e-16 | 2.16e-13 | 130 |
| GO:0000398 | Colorectum | AD | mRNA splicing, via spliceosome | 130/3918 | 320/18723 | 5.88e-16 | 2.16e-13 | 130 |
| GO:0000375 | Colorectum | AD | RNA splicing, via transesterification reactions | 131/3918 | 324/18723 | 7.11e-16 | 2.22e-13 | 131 |
| GO:0022618 | Colorectum | AD | ribonucleoprotein complex assembly | 92/3918 | 220/18723 | 1.49e-12 | 2.60e-10 | 92 |
| GO:0071826 | Colorectum | AD | ribonucleoprotein complex subunit organization | 94/3918 | 227/18723 | 1.70e-12 | 2.87e-10 | 94 |
| GO:0022613 | Colorectum | AD | ribonucleoprotein complex biogenesis | 151/3918 | 463/18723 | 1.96e-09 | 1.39e-07 | 151 |
| GO:0006979 | Colorectum | AD | response to oxidative stress | 145/3918 | 446/18723 | 5.16e-09 | 3.23e-07 | 145 |
| GO:0000245 | Colorectum | AD | spliceosomal complex assembly | 33/3918 | 79/18723 | 2.15e-05 | 4.33e-04 | 33 |
| GO:0006376 | Colorectum | AD | mRNA splice site selection | 18/3918 | 49/18723 | 7.93e-03 | 4.73e-02 | 18 |
| GO:00083801 | Colorectum | SER | RNA splicing | 123/2897 | 434/18723 | 3.84e-12 | 8.41e-10 | 123 |
| GO:00226181 | Colorectum | SER | ribonucleoprotein complex assembly | 69/2897 | 220/18723 | 2.25e-09 | 2.15e-07 | 69 |
| GO:00718261 | Colorectum | SER | ribonucleoprotein complex subunit organization | 70/2897 | 227/18723 | 3.83e-09 | 3.51e-07 | 70 |
| GO:00003751 | Colorectum | SER | RNA splicing, via transesterification reactions | 90/2897 | 324/18723 | 8.68e-09 | 7.50e-07 | 90 |
| GO:00003771 | Colorectum | SER | RNA splicing, via transesterification reactions with bulged adenosine as nucleophile | 89/2897 | 320/18723 | 9.82e-09 | 8.14e-07 | 89 |
| GO:00003981 | Colorectum | SER | mRNA splicing, via spliceosome | 89/2897 | 320/18723 | 9.82e-09 | 8.14e-07 | 89 |
| GO:00069791 | Colorectum | SER | response to oxidative stress | 114/2897 | 446/18723 | 1.75e-08 | 1.28e-06 | 114 |
| GO:00226131 | Colorectum | SER | ribonucleoprotein complex biogenesis | 112/2897 | 463/18723 | 5.01e-07 | 2.48e-05 | 112 |
| GO:00083802 | Colorectum | MSS | RNA splicing | 159/3467 | 434/18723 | 1.75e-19 | 1.22e-16 | 159 |
| GO:00003772 | Colorectum | MSS | RNA splicing, via transesterification reactions with bulged adenosine as nucleophile | 121/3467 | 320/18723 | 2.52e-16 | 8.27e-14 | 121 |
| Page: 1 2 3 4 5 6 7 8 |
| Pathway ID | Tissue | Disease Stage | Description | Gene Ratio | Bg Ratio | pvalue | p.adjust | qvalue | Count |
| hsa03250 | Colorectum | MSS | Viral life cycle - HIV-1 | 23/1875 | 63/8465 | 6.55e-03 | 2.64e-02 | 1.62e-02 | 23 |
| hsa032501 | Colorectum | MSS | Viral life cycle - HIV-1 | 23/1875 | 63/8465 | 6.55e-03 | 2.64e-02 | 1.62e-02 | 23 |
| hsa032509 | Esophagus | ESCC | Viral life cycle - HIV-1 | 54/4205 | 63/8465 | 2.01e-09 | 2.17e-08 | 1.11e-08 | 54 |
| hsa0325014 | Esophagus | ESCC | Viral life cycle - HIV-1 | 54/4205 | 63/8465 | 2.01e-09 | 2.17e-08 | 1.11e-08 | 54 |
| hsa032502 | Liver | HCC | Viral life cycle - HIV-1 | 46/4020 | 63/8465 | 3.25e-05 | 1.88e-04 | 1.04e-04 | 46 |
| hsa0325011 | Liver | HCC | Viral life cycle - HIV-1 | 46/4020 | 63/8465 | 3.25e-05 | 1.88e-04 | 1.04e-04 | 46 |
| hsa032508 | Oral cavity | OSCC | Viral life cycle - HIV-1 | 45/3704 | 63/8465 | 7.62e-06 | 3.59e-05 | 1.83e-05 | 45 |
| hsa0325013 | Oral cavity | OSCC | Viral life cycle - HIV-1 | 45/3704 | 63/8465 | 7.62e-06 | 3.59e-05 | 1.83e-05 | 45 |
| hsa0325021 | Prostate | Tumor | Viral life cycle - HIV-1 | 25/1791 | 63/8465 | 6.13e-04 | 3.07e-03 | 1.91e-03 | 25 |
| hsa032503 | Prostate | Tumor | Viral life cycle - HIV-1 | 25/1791 | 63/8465 | 6.13e-04 | 3.07e-03 | 1.91e-03 | 25 |
| Page: 1 |
Top |
Cell-cell communication analysis |
| Identification of potential cell-cell interactions between two cell types and their ligand-receptor pairs for different disease states |
| Ligand | Receptor | LRpair | Pathway | Tissue | Disease Stage |
| Page: 1 |
Top |
Single-cell gene regulatory network inference analysis |
| Find out the significant the regulons (TFs) and the target genes of each regulon across cell types for different disease states |
| TF | Cell Type | Tissue | Disease Stage | Target Gene | RSS | Regulon Activity |
| ∗The dot plots of a searched regulon are shown for all cell subpopulations in each disease state of each tissue based on the regulon specific score inferred using pySCENIC and by calculating the average expression. |
| Page: 1 |
Top |
Somatic mutation of malignant transformation related genes |
| Annotation of somatic variants for genes involved in malignant transformation |
| Hugo Symbol | Variant Class | Variant Classification | dbSNP RS | HGVSc | HGVSp | HGVSp Short | SWISSPROT | BIOTYPE | SIFT | PolyPhen | Tumor Sample Barcode | Tissue | Histology | Sex | Age | Stage | Therapy Types | Drugs | Outcome |
| PSIP1 | SNV | Missense_Mutation | c.1145N>T | p.Ser382Leu | p.S382L | O75475 | protein_coding | deleterious(0) | probably_damaging(0.975) | TCGA-C8-A130-01 | Breast | breast invasive carcinoma | Female | <65 | III/IV | Unknown | Unknown | SD | |
| PSIP1 | SNV | Missense_Mutation | c.246N>T | p.Trp82Cys | p.W82C | O75475 | protein_coding | deleterious(0.04) | probably_damaging(0.974) | TCGA-D8-A1JE-01 | Breast | breast invasive carcinoma | Female | <65 | I/II | Chemotherapy | adriamicin | SD | |
| PSIP1 | SNV | Missense_Mutation | novel | c.883C>G | p.Gln295Glu | p.Q295E | O75475 | protein_coding | tolerated(0.21) | benign(0.037) | TCGA-E9-A3HO-01 | Breast | breast invasive carcinoma | Female | <65 | I/II | Chemotherapy | cyclophosphamide | CR |
| PSIP1 | insertion | Frame_Shift_Ins | novel | c.158_159insT | p.Leu53PhefsTer13 | p.L53Ffs*13 | O75475 | protein_coding | TCGA-AO-A0J5-01 | Breast | breast invasive carcinoma | Female | <65 | III/IV | Other, specify in notesBisphosphonate | zoledronic | PD | ||
| PSIP1 | deletion | Frame_Shift_Del | c.158delT | p.Leu53Ter | p.L53* | O75475 | protein_coding | TCGA-AO-A128-01 | Breast | breast invasive carcinoma | Female | <65 | I/II | Chemotherapy | doxorubicin | SD | |||
| PSIP1 | deletion | Frame_Shift_Del | novel | c.738delN | p.Glu247SerfsTer18 | p.E247Sfs*18 | O75475 | protein_coding | TCGA-D8-A27V-01 | Breast | breast invasive carcinoma | Female | <65 | I/II | Hormone Therapy | tamoxiphen | SD | ||
| PSIP1 | SNV | Missense_Mutation | c.452N>A | p.Arg151Lys | p.R151K | O75475 | protein_coding | tolerated(0.39) | probably_damaging(0.931) | TCGA-EK-A2H0-01 | Cervix | cervical & endocervical cancer | Female | <65 | I/II | Chemotherapy | cisplatin | CR | |
| PSIP1 | SNV | Missense_Mutation | c.262N>T | p.Pro88Ser | p.P88S | O75475 | protein_coding | deleterious(0) | benign(0.345) | TCGA-EK-A2R8-01 | Cervix | cervical & endocervical cancer | Female | <65 | I/II | Unknown | Unknown | SD | |
| PSIP1 | SNV | Missense_Mutation | c.452G>A | p.Arg151Lys | p.R151K | O75475 | protein_coding | tolerated(0.39) | probably_damaging(0.931) | TCGA-ZJ-A8QQ-01 | Cervix | cervical & endocervical cancer | Female | <65 | I/II | Chemotherapy | cisplatin | SD | |
| PSIP1 | SNV | Missense_Mutation | novel | c.1575T>G | p.Asp525Glu | p.D525E | O75475 | protein_coding | tolerated_low_confidence(0.59) | benign(0) | TCGA-AA-3984-01 | Colorectum | colon adenocarcinoma | Female | <65 | I/II | Unknown | Unknown | SD |
| Page: 1 2 3 4 5 6 7 8 |
Top |
Related drugs of malignant transformation related genes |
| Identification of chemicals and drugs interact with genes involved in malignant transfromation |
| (DGIdb 4.0) |
| Entrez ID | Symbol | Category | Interaction Types | Drug Claim Name | Drug Name | PMIDs |
| 11168 | PSIP1 | CLINICALLY ACTIONABLE | US9132129, Cpd002 | |||
| 11168 | PSIP1 | CLINICALLY ACTIONABLE | US9132129, Cpd047 | |||
| 11168 | PSIP1 | CLINICALLY ACTIONABLE | US9132129, Cpd023 |
| Page: 1 |

Copyright 2023-Present -The University of Texas Health Science Center at Houston |