
|
|||||
|
 | |
| |
| |
| |
| |
| |
|
Gene: PRKRIP1 |
Gene summary for PRKRIP1 |
| Gene information | Species | Human | Gene symbol | PRKRIP1 | Gene ID | 79706 |
| Gene name | PRKR interacting protein 1 | |
| Gene Alias | C114 | |
| Cytomap | 7q22.1 | |
| Gene Type | protein-coding | GO ID | GO:0001932 | UniProtAcc | A0A024QYV5 |
Top |
Malignant transformation analysis |
| Identification of the aberrant gene expression in precancerous and cancerous lesions by comparing the gene expression of stem-like cells in diseased tissues with normal stem cells |
| Entrez ID | Symbol | Replicates | Species | Organ | Tissue | Adj P-value | Log2FC | Malignancy |
| 79706 | PRKRIP1 | CCI_1 | Human | Cervix | CC | 4.44e-07 | 6.97e-01 | 0.528 |
| 79706 | PRKRIP1 | CCI_2 | Human | Cervix | CC | 6.62e-05 | 6.34e-01 | 0.5249 |
| 79706 | PRKRIP1 | CCI_3 | Human | Cervix | CC | 8.25e-11 | 6.99e-01 | 0.516 |
| 79706 | PRKRIP1 | LZE2T | Human | Esophagus | ESCC | 1.03e-02 | 3.25e-01 | 0.082 |
| 79706 | PRKRIP1 | LZE4T | Human | Esophagus | ESCC | 1.61e-06 | 2.14e-01 | 0.0811 |
| 79706 | PRKRIP1 | LZE7T | Human | Esophagus | ESCC | 2.38e-06 | 3.30e-01 | 0.0667 |
| 79706 | PRKRIP1 | LZE20T | Human | Esophagus | ESCC | 2.05e-06 | 2.54e-01 | 0.0662 |
| 79706 | PRKRIP1 | LZE22T | Human | Esophagus | ESCC | 1.41e-03 | 3.25e-01 | 0.068 |
| 79706 | PRKRIP1 | LZE24T | Human | Esophagus | ESCC | 1.50e-17 | 4.47e-01 | 0.0596 |
| 79706 | PRKRIP1 | LZE21T | Human | Esophagus | ESCC | 6.91e-04 | 2.16e-01 | 0.0655 |
| 79706 | PRKRIP1 | P1T-E | Human | Esophagus | ESCC | 6.59e-10 | 4.73e-01 | 0.0875 |
| 79706 | PRKRIP1 | P2T-E | Human | Esophagus | ESCC | 2.64e-65 | 1.07e+00 | 0.1177 |
| 79706 | PRKRIP1 | P4T-E | Human | Esophagus | ESCC | 2.51e-25 | 5.12e-01 | 0.1323 |
| 79706 | PRKRIP1 | P5T-E | Human | Esophagus | ESCC | 6.85e-29 | 4.29e-01 | 0.1327 |
| 79706 | PRKRIP1 | P8T-E | Human | Esophagus | ESCC | 4.94e-21 | 3.33e-01 | 0.0889 |
| 79706 | PRKRIP1 | P9T-E | Human | Esophagus | ESCC | 2.29e-16 | 3.24e-01 | 0.1131 |
| 79706 | PRKRIP1 | P10T-E | Human | Esophagus | ESCC | 1.83e-26 | 4.14e-01 | 0.116 |
| 79706 | PRKRIP1 | P11T-E | Human | Esophagus | ESCC | 4.50e-18 | 5.24e-01 | 0.1426 |
| 79706 | PRKRIP1 | P12T-E | Human | Esophagus | ESCC | 1.04e-32 | 5.62e-01 | 0.1122 |
| 79706 | PRKRIP1 | P15T-E | Human | Esophagus | ESCC | 5.56e-39 | 6.88e-01 | 0.1149 |
| Page: 1 2 3 4 5 6 |
| Tissue | Expression Dynamics | Abbreviation |
| Cervix | 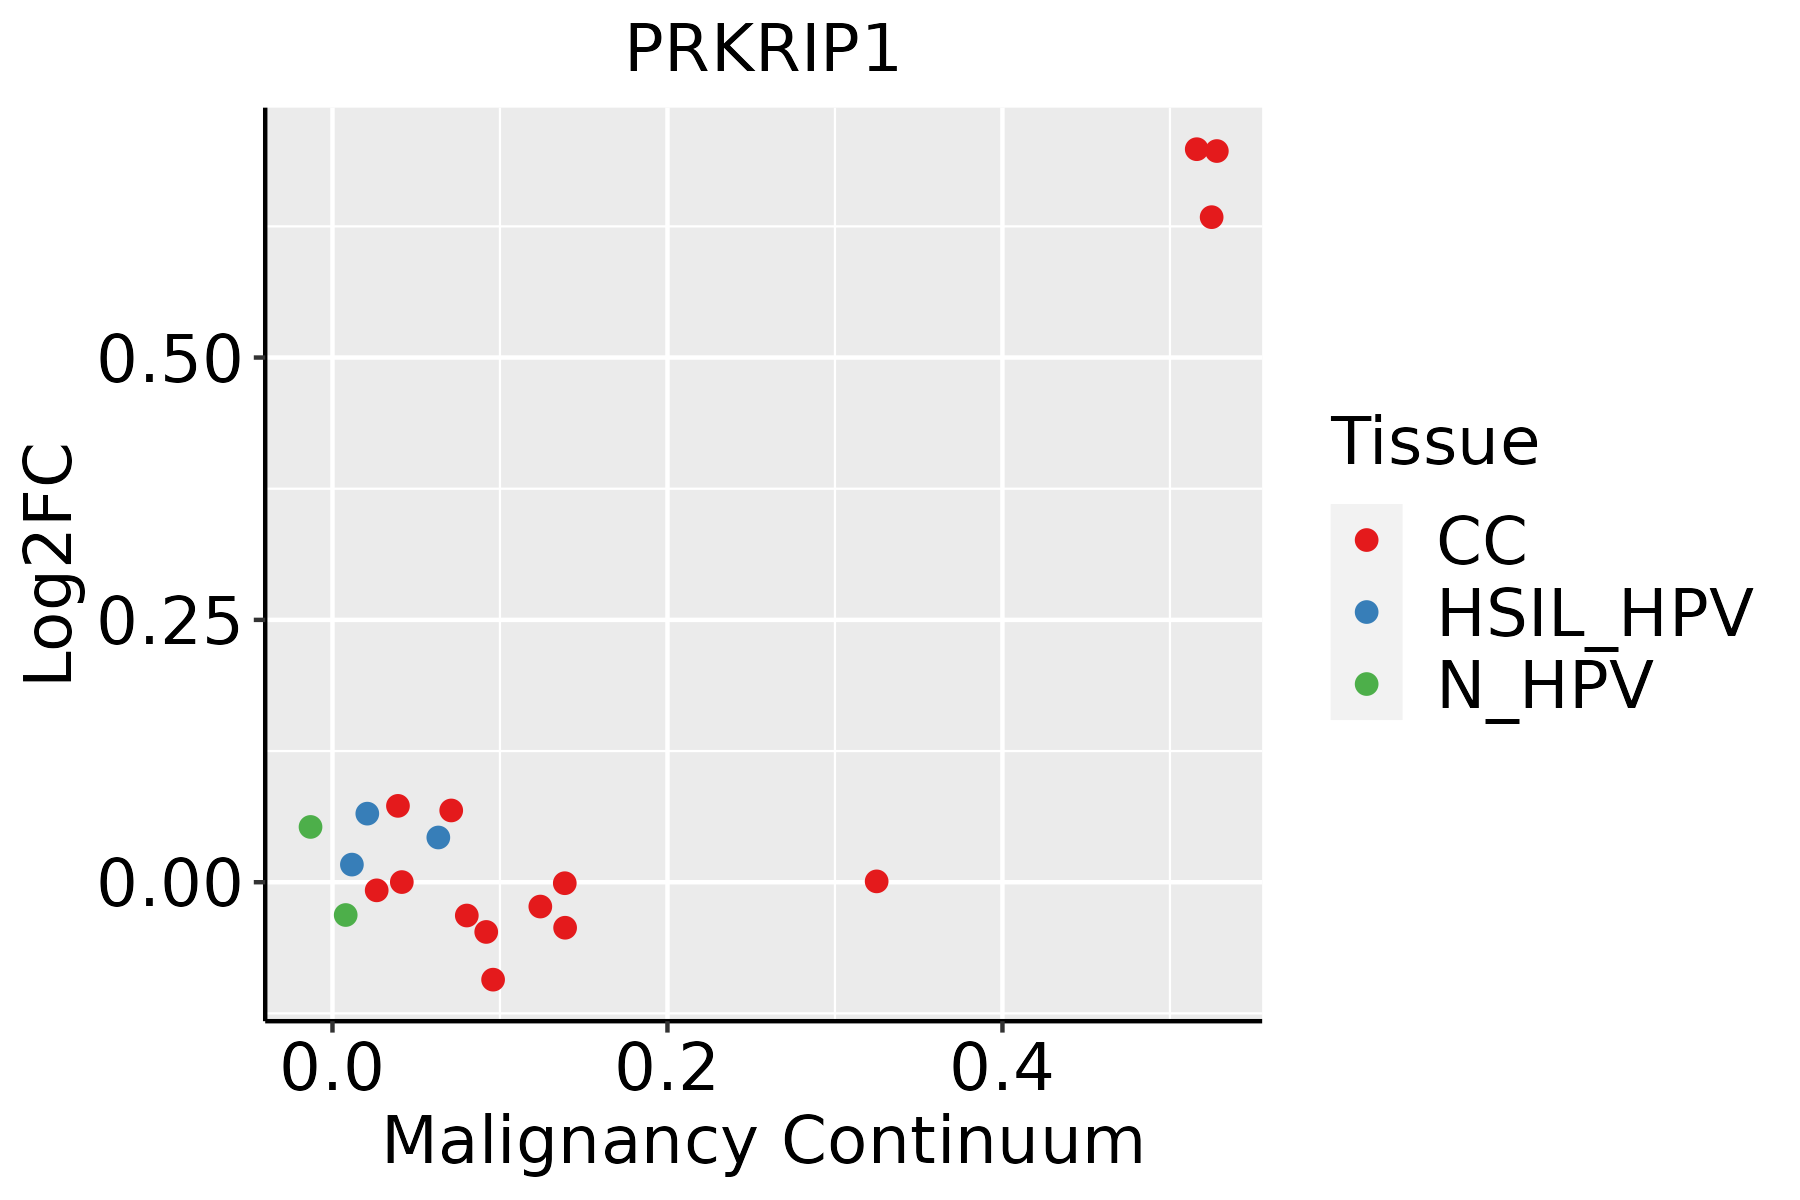 | CC: Cervix cancer |
| HSIL_HPV: HPV-infected high-grade squamous intraepithelial lesions | ||
| N_HPV: HPV-infected normal cervix | ||
| Esophagus | 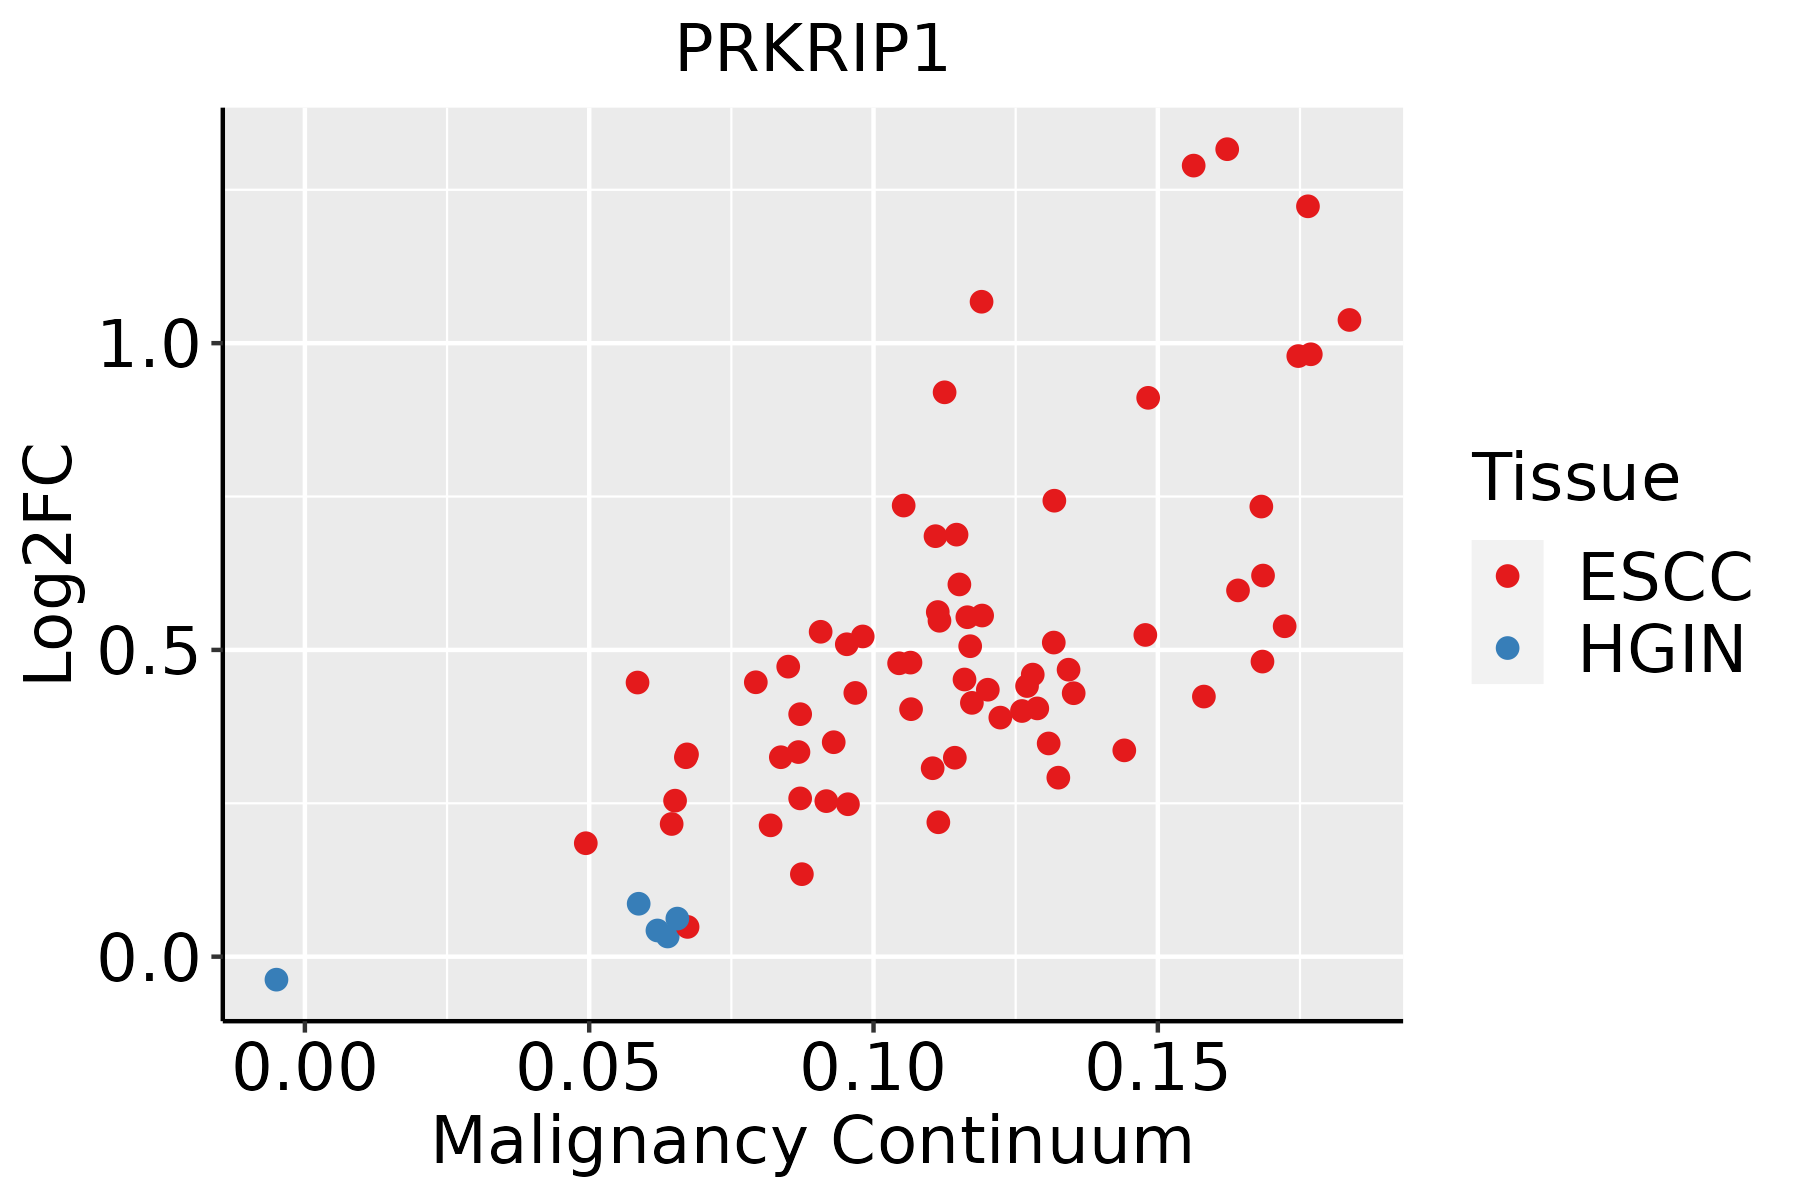 | ESCC: Esophageal squamous cell carcinoma |
| HGIN: High-grade intraepithelial neoplasias | ||
| LGIN: Low-grade intraepithelial neoplasias | ||
| Liver | 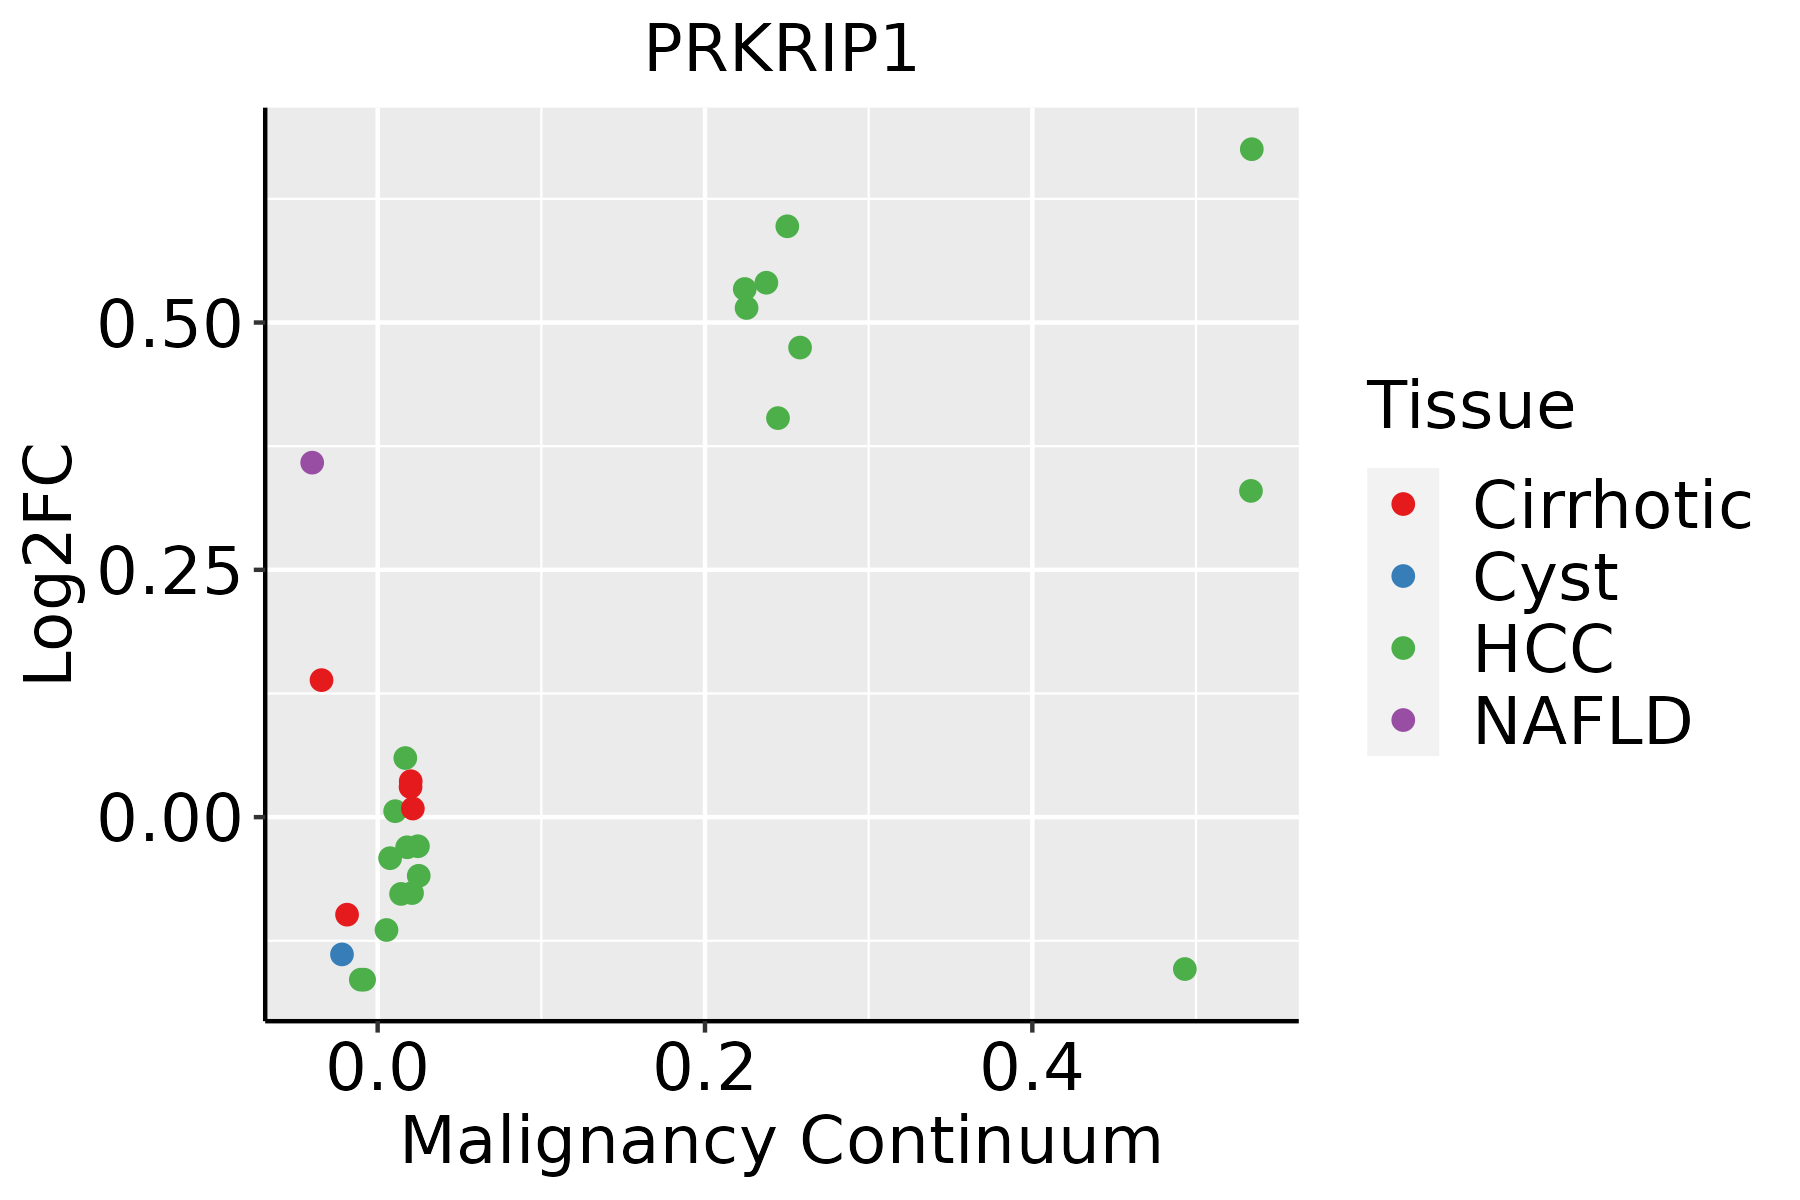 | HCC: Hepatocellular carcinoma |
| NAFLD: Non-alcoholic fatty liver disease | ||
| Lung | 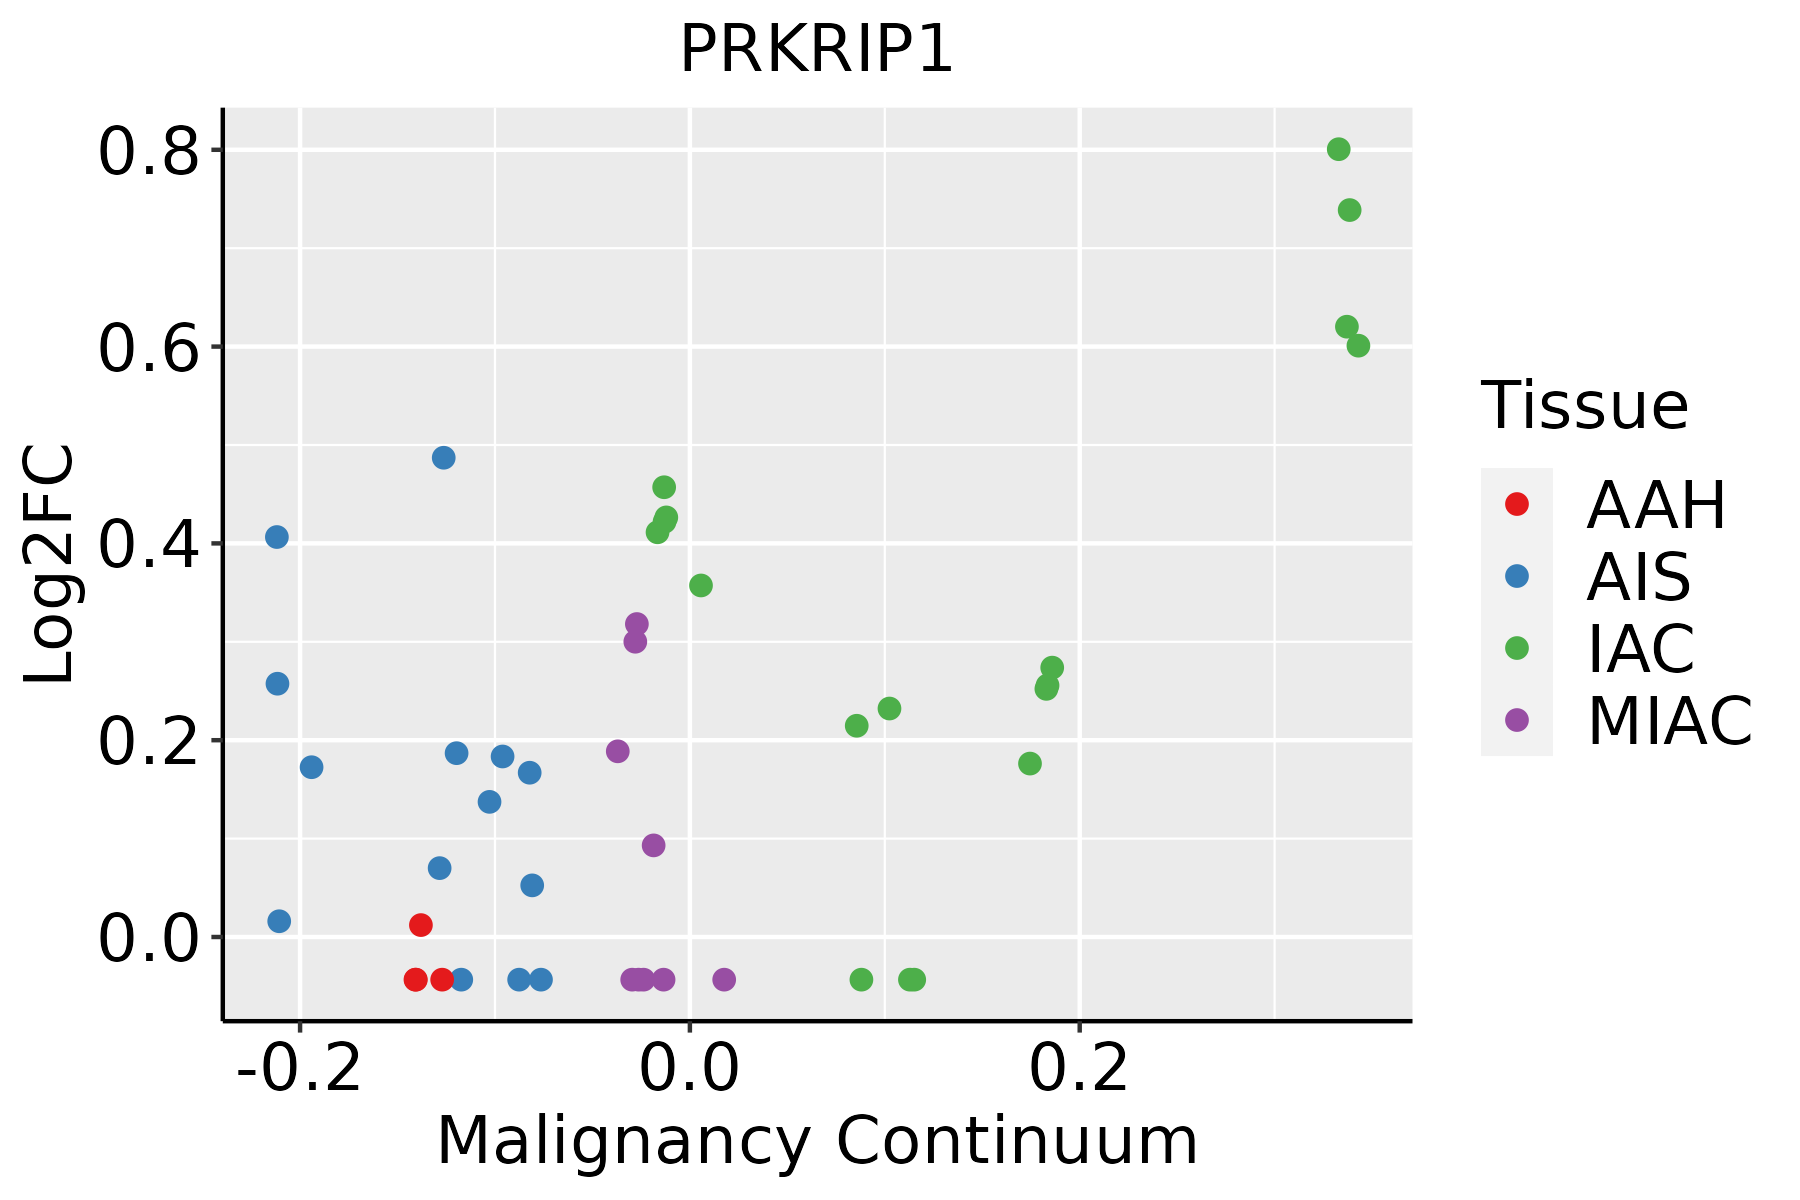 | AAH: Atypical adenomatous hyperplasia |
| AIS: Adenocarcinoma in situ | ||
| IAC: Invasive lung adenocarcinoma | ||
| MIA: Minimally invasive adenocarcinoma | ||
| Oral Cavity | 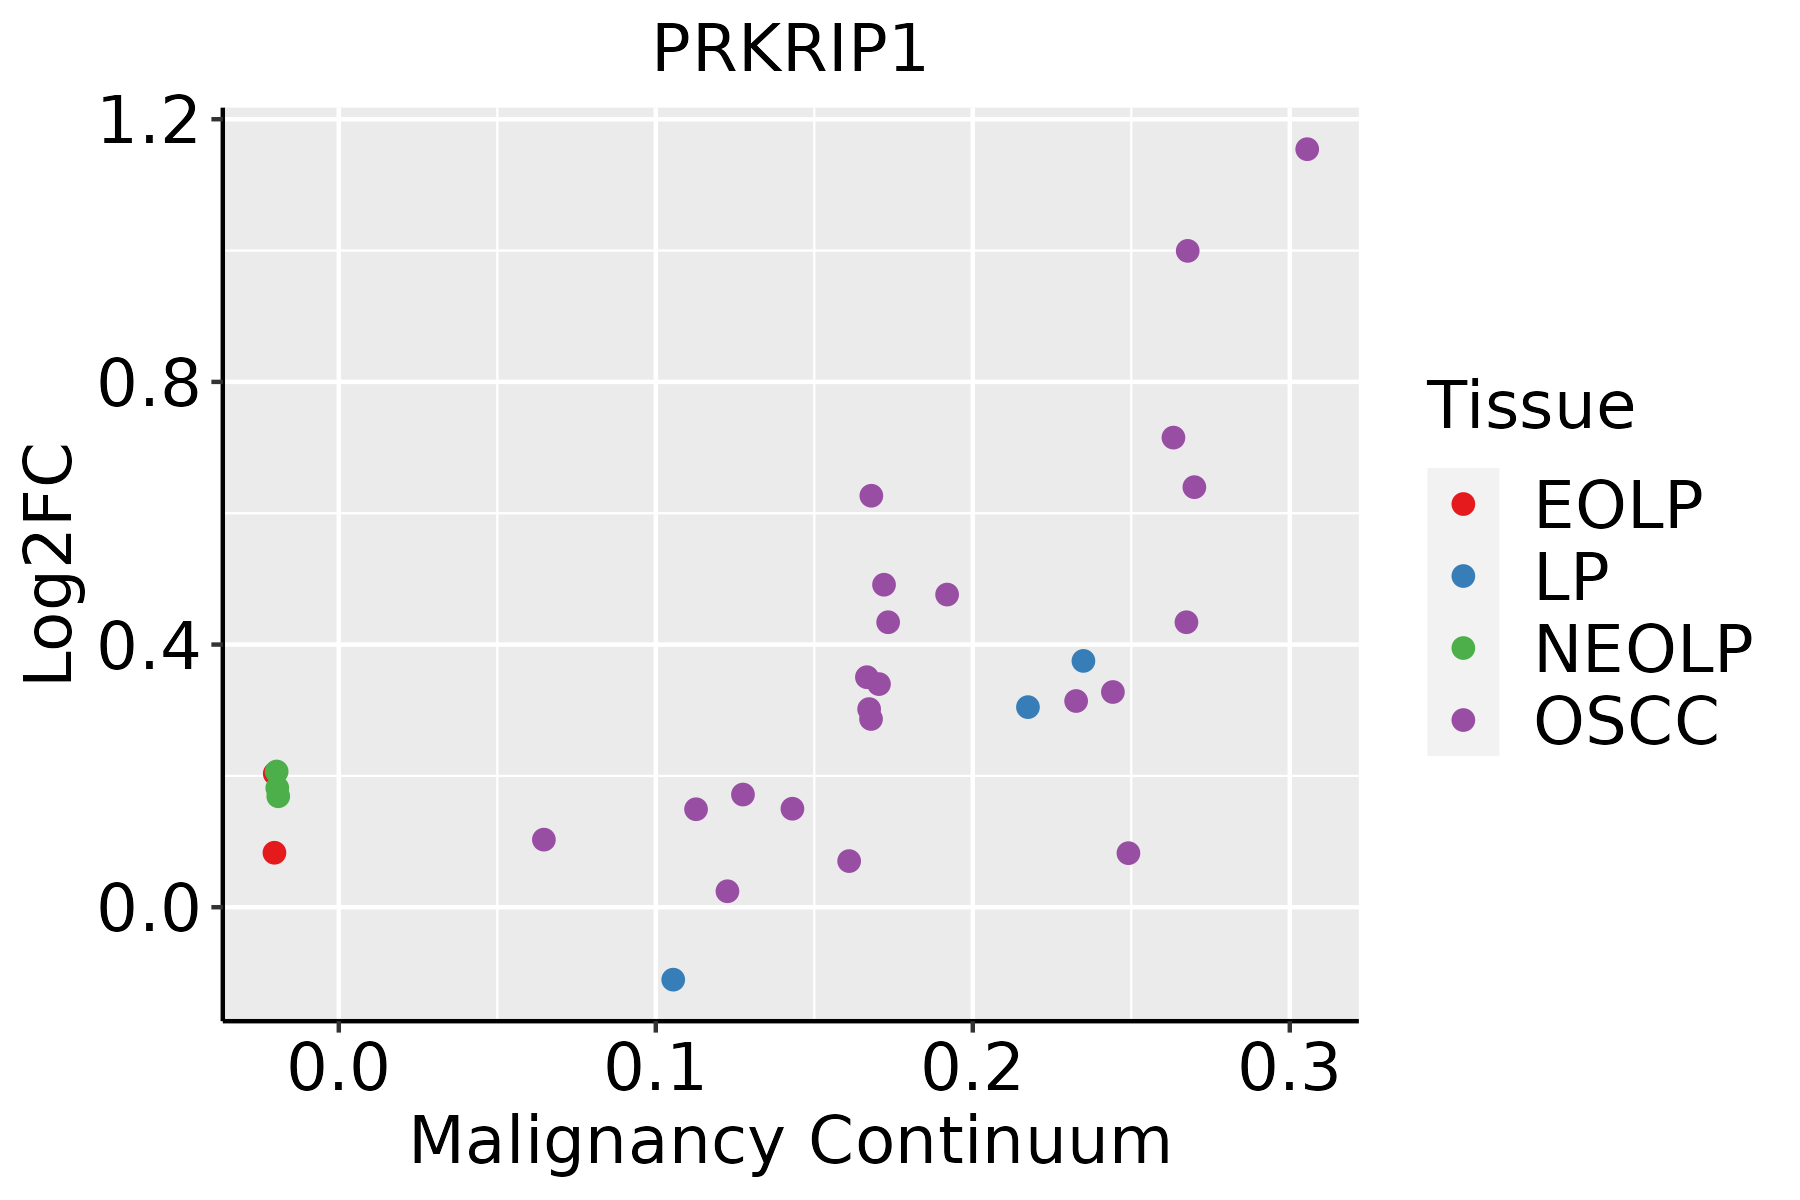 | EOLP: Erosive Oral lichen planus |
| LP: leukoplakia | ||
| NEOLP: Non-erosive oral lichen planus | ||
| OSCC: Oral squamous cell carcinoma | ||
| Thyroid | 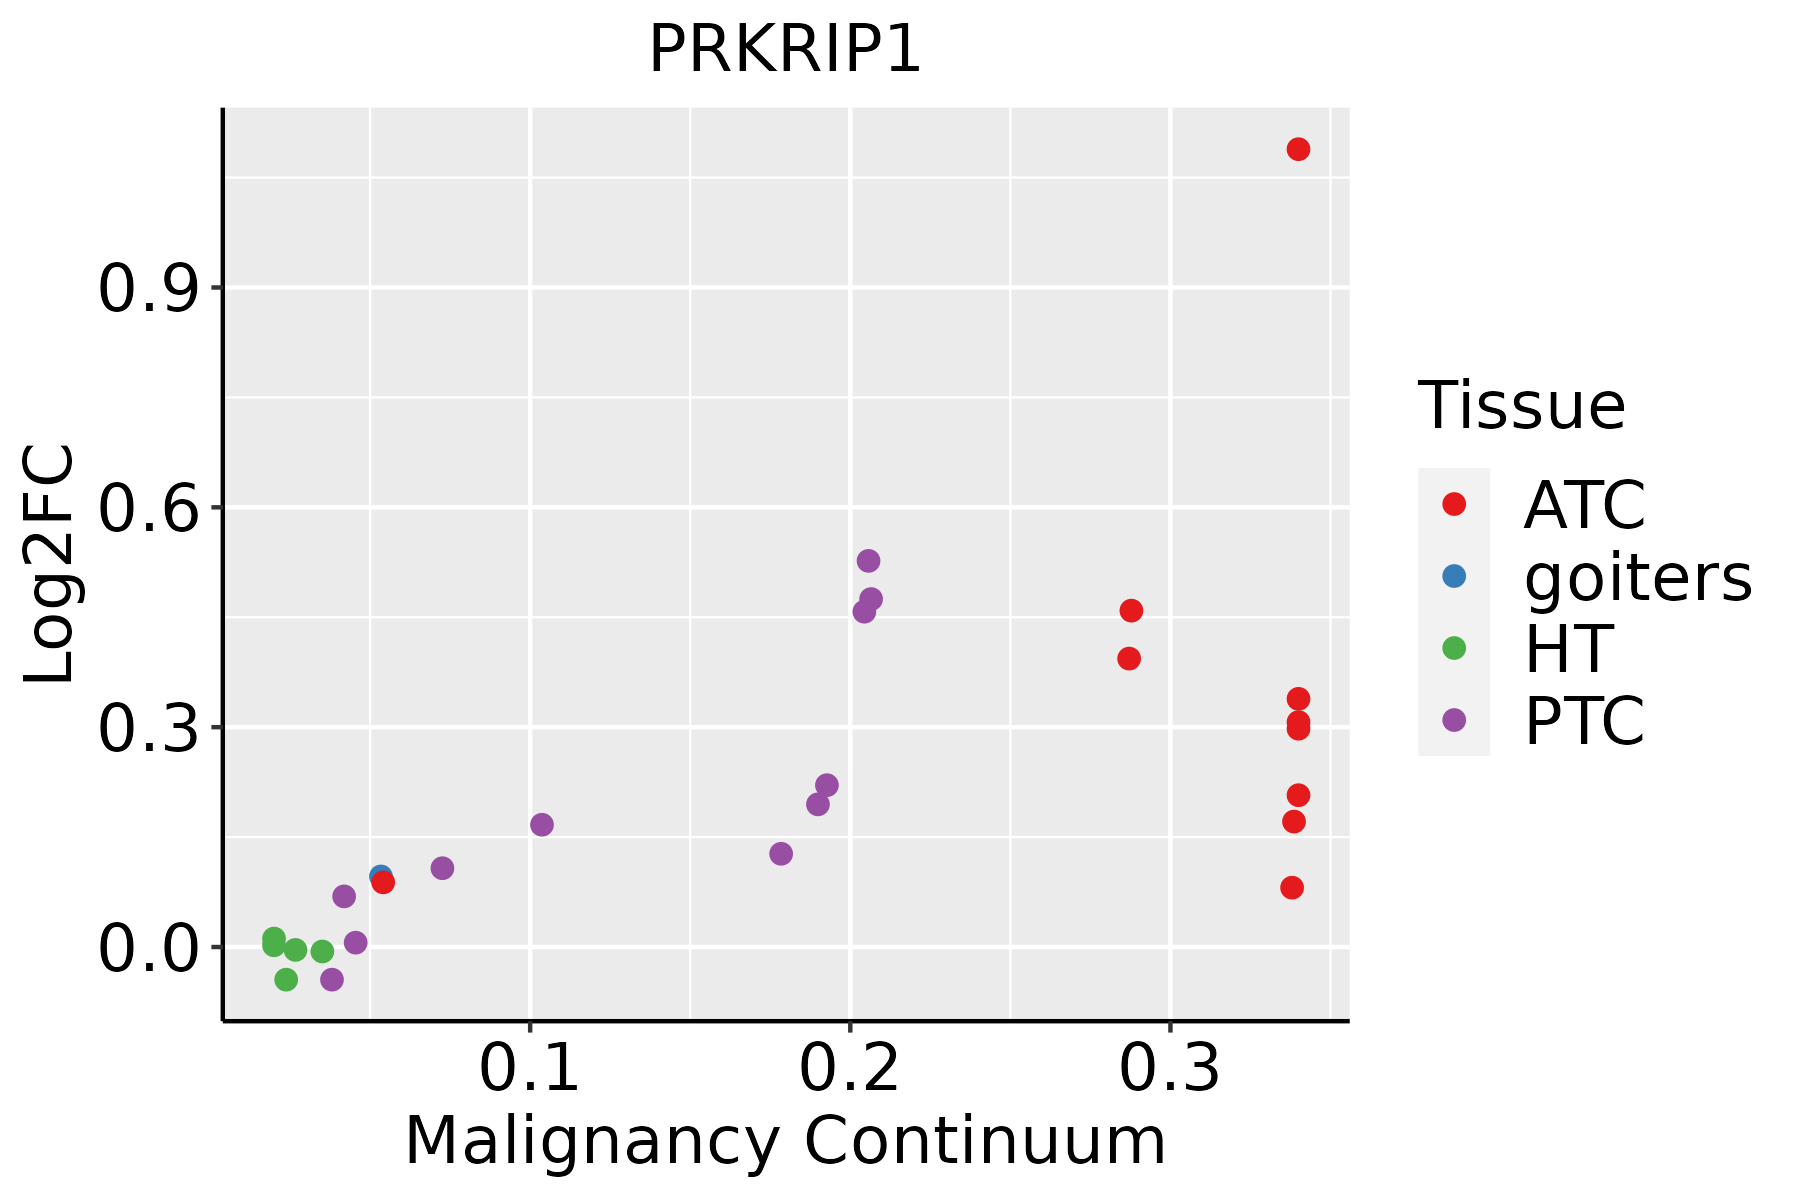 | ATC: Anaplastic thyroid cancer |
| HT: Hashimoto's thyroiditis | ||
| PTC: Papillary thyroid cancer |
| ∗log2FC in expression of this searched gene in stem-like cells from each diseased tissue sample relative to stem-like cells in normal samples in each tissue plotted against the malignancy continuum. Samples are colored based on if they are from different disease stage. |
Top |
Malignant transformation related pathway analysis |
| Find out the enriched GO biological processes and KEGG pathways involved in transition from healthy to precancer to cancer |
| Tissue | Disease Stage | Enriched GO biological Processes |
| Colorectum | AD |  |
| Colorectum | SER |  |
| Colorectum | MSS |  |
| Colorectum | MSI-H |  |
| Colorectum | FAP |  |
| ∗Top 15 enriched GO BP terms are showed in the bar plot of each disease state in each tissue. Each row represents a significant GO biological process which is colored according to the -log10(p.adjust). |
| Page: 1 2 3 4 5 6 7 8 9 |
| GO ID | Tissue | Disease Stage | Description | Gene Ratio | Bg Ratio | pvalue | p.adjust | Count |
| GO:005134822 | Liver | HCC | negative regulation of transferase activity | 166/7958 | 268/18723 | 8.97e-11 | 3.18e-09 | 166 |
| GO:003367322 | Liver | HCC | negative regulation of kinase activity | 144/7958 | 237/18723 | 9.76e-09 | 2.45e-07 | 144 |
| GO:000193322 | Liver | HCC | negative regulation of protein phosphorylation | 196/7958 | 342/18723 | 1.95e-08 | 4.63e-07 | 196 |
| GO:000646912 | Liver | HCC | negative regulation of protein kinase activity | 126/7958 | 212/18723 | 4.55e-07 | 7.49e-06 | 126 |
| GO:00459368 | Lung | IAC | negative regulation of phosphate metabolic process | 87/2061 | 441/18723 | 4.00e-08 | 4.57e-06 | 87 |
| GO:00105638 | Lung | IAC | negative regulation of phosphorus metabolic process | 87/2061 | 442/18723 | 4.46e-08 | 4.99e-06 | 87 |
| GO:00423268 | Lung | IAC | negative regulation of phosphorylation | 74/2061 | 385/18723 | 1.15e-06 | 6.18e-05 | 74 |
| GO:00019338 | Lung | IAC | negative regulation of protein phosphorylation | 66/2061 | 342/18723 | 3.72e-06 | 1.55e-04 | 66 |
| GO:00513488 | Lung | IAC | negative regulation of transferase activity | 52/2061 | 268/18723 | 3.30e-05 | 8.29e-04 | 52 |
| GO:00083808 | Lung | IAC | RNA splicing | 75/2061 | 434/18723 | 4.89e-05 | 1.12e-03 | 75 |
| GO:00064698 | Lung | IAC | negative regulation of protein kinase activity | 39/2061 | 212/18723 | 8.93e-04 | 1.11e-02 | 39 |
| GO:00336737 | Lung | IAC | negative regulation of kinase activity | 42/2061 | 237/18723 | 1.25e-03 | 1.44e-02 | 42 |
| GO:004593613 | Lung | AIS | negative regulation of phosphate metabolic process | 75/1849 | 441/18723 | 1.93e-06 | 1.12e-04 | 75 |
| GO:001056313 | Lung | AIS | negative regulation of phosphorus metabolic process | 75/1849 | 442/18723 | 2.11e-06 | 1.20e-04 | 75 |
| GO:004232613 | Lung | AIS | negative regulation of phosphorylation | 65/1849 | 385/18723 | 1.17e-05 | 4.69e-04 | 65 |
| GO:000193313 | Lung | AIS | negative regulation of protein phosphorylation | 57/1849 | 342/18723 | 5.71e-05 | 1.60e-03 | 57 |
| GO:000838013 | Lung | AIS | RNA splicing | 68/1849 | 434/18723 | 8.50e-05 | 2.11e-03 | 68 |
| GO:005134813 | Lung | AIS | negative regulation of transferase activity | 44/1849 | 268/18723 | 5.28e-04 | 8.43e-03 | 44 |
| GO:000838020 | Oral cavity | OSCC | RNA splicing | 308/7305 | 434/18723 | 2.43e-42 | 7.70e-39 | 308 |
| GO:005134820 | Oral cavity | OSCC | negative regulation of transferase activity | 165/7305 | 268/18723 | 5.02e-14 | 2.74e-12 | 165 |
| Page: 1 2 3 4 |
| Pathway ID | Tissue | Disease Stage | Description | Gene Ratio | Bg Ratio | pvalue | p.adjust | qvalue | Count |
| Page: 1 |
Top |
Cell-cell communication analysis |
| Identification of potential cell-cell interactions between two cell types and their ligand-receptor pairs for different disease states |
| Ligand | Receptor | LRpair | Pathway | Tissue | Disease Stage |
| Page: 1 |
Top |
Single-cell gene regulatory network inference analysis |
| Find out the significant the regulons (TFs) and the target genes of each regulon across cell types for different disease states |
| TF | Cell Type | Tissue | Disease Stage | Target Gene | RSS | Regulon Activity |
| ∗The dot plots of a searched regulon are shown for all cell subpopulations in each disease state of each tissue based on the regulon specific score inferred using pySCENIC and by calculating the average expression. |
| Page: 1 |
Top |
Somatic mutation of malignant transformation related genes |
| Annotation of somatic variants for genes involved in malignant transformation |
| Hugo Symbol | Variant Class | Variant Classification | dbSNP RS | HGVSc | HGVSp | HGVSp Short | SWISSPROT | BIOTYPE | SIFT | PolyPhen | Tumor Sample Barcode | Tissue | Histology | Sex | Age | Stage | Therapy Types | Drugs | Outcome |
| PRKRIP1 | SNV | Missense_Mutation | c.517N>A | p.Glu173Lys | p.E173K | Q9H875 | protein_coding | deleterious(0.02) | probably_damaging(0.973) | TCGA-JW-A5VL-01 | Cervix | cervical & endocervical cancer | Female | <65 | I/II | Unknown | Unknown | SD | |
| PRKRIP1 | SNV | Missense_Mutation | c.284A>G | p.Tyr95Cys | p.Y95C | Q9H875 | protein_coding | deleterious(0.01) | probably_damaging(0.926) | TCGA-AZ-6601-01 | Colorectum | colon adenocarcinoma | Male | >=65 | I/II | Unknown | Unknown | PD | |
| PRKRIP1 | deletion | Frame_Shift_Del | c.69delN | p.Lys25ArgfsTer15 | p.K25Rfs*15 | Q9H875 | protein_coding | TCGA-CK-5916-01 | Colorectum | colon adenocarcinoma | Female | >=65 | I/II | Unknown | Unknown | PD | |||
| PRKRIP1 | SNV | Missense_Mutation | c.363N>T | p.Glu121Asp | p.E121D | Q9H875 | protein_coding | tolerated(0.1) | benign(0.193) | TCGA-AX-A06H-01 | Endometrium | uterine corpus endometrioid carcinoma | Female | <65 | III/IV | Chemotherapy | paclitaxel | SD | |
| PRKRIP1 | SNV | Missense_Mutation | rs367627621 | c.257N>A | p.Arg86His | p.R86H | Q9H875 | protein_coding | deleterious(0) | probably_damaging(0.994) | TCGA-D1-A103-01 | Endometrium | uterine corpus endometrioid carcinoma | Female | >=65 | I/II | Unknown | Unknown | SD |
| PRKRIP1 | SNV | Missense_Mutation | c.496N>T | p.Ala166Ser | p.A166S | Q9H875 | protein_coding | tolerated(0.71) | benign(0.01) | TCGA-44-7667-01 | Lung | lung adenocarcinoma | Female | <65 | I/II | Unknown | Unknown | SD | |
| PRKRIP1 | SNV | Missense_Mutation | novel | c.269N>T | p.Tyr90Phe | p.Y90F | Q9H875 | protein_coding | deleterious(0) | benign(0.208) | TCGA-55-8506-01 | Lung | lung adenocarcinoma | Female | <65 | I/II | Unknown | Unknown | SD |
| PRKRIP1 | SNV | Missense_Mutation | novel | c.4N>A | p.Ala2Thr | p.A2T | Q9H875 | protein_coding | deleterious_low_confidence(0.01) | possibly_damaging(0.588) | TCGA-78-7539-01 | Lung | lung adenocarcinoma | Female | >=65 | I/II | Chemotherapy | cisplatin | PD |
| PRKRIP1 | SNV | Missense_Mutation | novel | c.406N>C | p.Glu136Gln | p.E136Q | Q9H875 | protein_coding | tolerated(0.3) | benign(0.137) | TCGA-90-A4EE-01 | Lung | lung squamous cell carcinoma | Male | <65 | I/II | Chemotherapy | cisplatin | CR |
| PRKRIP1 | SNV | Missense_Mutation | novel | c.448N>G | p.Lys150Glu | p.K150E | Q9H875 | protein_coding | deleterious_low_confidence(0.01) | benign(0.084) | TCGA-J1-A4AH-01 | Lung | lung squamous cell carcinoma | Male | >=65 | I/II | Chemotherapy | cisplatin | CR |
| Page: 1 2 |
Top |
Related drugs of malignant transformation related genes |
| Identification of chemicals and drugs interact with genes involved in malignant transfromation |
| (DGIdb 4.0) |
| Entrez ID | Symbol | Category | Interaction Types | Drug Claim Name | Drug Name | PMIDs |
| Page: 1 |

Copyright 2023-Present -The University of Texas Health Science Center at Houston |