
|
|||||
|
 | |
| |
| |
| |
| |
| |
|
Gene: PPP4R3B |
Gene summary for PPP4R3B |
| Gene information | Species | Human | Gene symbol | PPP4R3B | Gene ID | 57223 |
| Gene name | protein phosphatase 4 regulatory subunit 3B | |
| Gene Alias | FLFL2 | |
| Cytomap | 2p16.1 | |
| Gene Type | protein-coding | GO ID | GO:0005975 | UniProtAcc | Q5MIZ7 |
Top |
Malignant transformation analysis |
| Identification of the aberrant gene expression in precancerous and cancerous lesions by comparing the gene expression of stem-like cells in diseased tissues with normal stem cells |
| Entrez ID | Symbol | Replicates | Species | Organ | Tissue | Adj P-value | Log2FC | Malignancy |
| 57223 | PPP4R3B | LZE2T | Human | Esophagus | ESCC | 1.43e-07 | 5.90e-01 | 0.082 |
| 57223 | PPP4R3B | LZE4T | Human | Esophagus | ESCC | 9.84e-30 | 7.89e-01 | 0.0811 |
| 57223 | PPP4R3B | LZE5T | Human | Esophagus | ESCC | 3.48e-06 | 4.61e-01 | 0.0514 |
| 57223 | PPP4R3B | LZE7T | Human | Esophagus | ESCC | 2.85e-14 | 7.45e-01 | 0.0667 |
| 57223 | PPP4R3B | LZE8T | Human | Esophagus | ESCC | 4.14e-10 | 3.52e-01 | 0.067 |
| 57223 | PPP4R3B | LZE20T | Human | Esophagus | ESCC | 6.76e-06 | 1.95e-01 | 0.0662 |
| 57223 | PPP4R3B | LZE22D1 | Human | Esophagus | HGIN | 3.22e-04 | 1.45e-01 | 0.0595 |
| 57223 | PPP4R3B | LZE22T | Human | Esophagus | ESCC | 1.05e-04 | 6.71e-01 | 0.068 |
| 57223 | PPP4R3B | LZE24T | Human | Esophagus | ESCC | 6.06e-29 | 6.64e-01 | 0.0596 |
| 57223 | PPP4R3B | LZE21T | Human | Esophagus | ESCC | 4.74e-09 | 3.82e-01 | 0.0655 |
| 57223 | PPP4R3B | LZE6T | Human | Esophagus | ESCC | 1.56e-05 | 4.20e-01 | 0.0845 |
| 57223 | PPP4R3B | P1T-E | Human | Esophagus | ESCC | 2.00e-11 | 7.04e-01 | 0.0875 |
| 57223 | PPP4R3B | P2T-E | Human | Esophagus | ESCC | 1.94e-68 | 1.14e+00 | 0.1177 |
| 57223 | PPP4R3B | P4T-E | Human | Esophagus | ESCC | 3.68e-30 | 7.07e-01 | 0.1323 |
| 57223 | PPP4R3B | P5T-E | Human | Esophagus | ESCC | 6.65e-24 | 4.18e-01 | 0.1327 |
| 57223 | PPP4R3B | P8T-E | Human | Esophagus | ESCC | 2.14e-25 | 4.22e-01 | 0.0889 |
| 57223 | PPP4R3B | P9T-E | Human | Esophagus | ESCC | 1.41e-22 | 4.61e-01 | 0.1131 |
| 57223 | PPP4R3B | P10T-E | Human | Esophagus | ESCC | 4.56e-39 | 7.12e-01 | 0.116 |
| 57223 | PPP4R3B | P11T-E | Human | Esophagus | ESCC | 3.98e-23 | 9.45e-01 | 0.1426 |
| 57223 | PPP4R3B | P12T-E | Human | Esophagus | ESCC | 8.91e-48 | 7.60e-01 | 0.1122 |
| Page: 1 2 3 4 5 6 |
| Tissue | Expression Dynamics | Abbreviation |
| Esophagus |  | ESCC: Esophageal squamous cell carcinoma |
| HGIN: High-grade intraepithelial neoplasias | ||
| LGIN: Low-grade intraepithelial neoplasias | ||
| Liver | 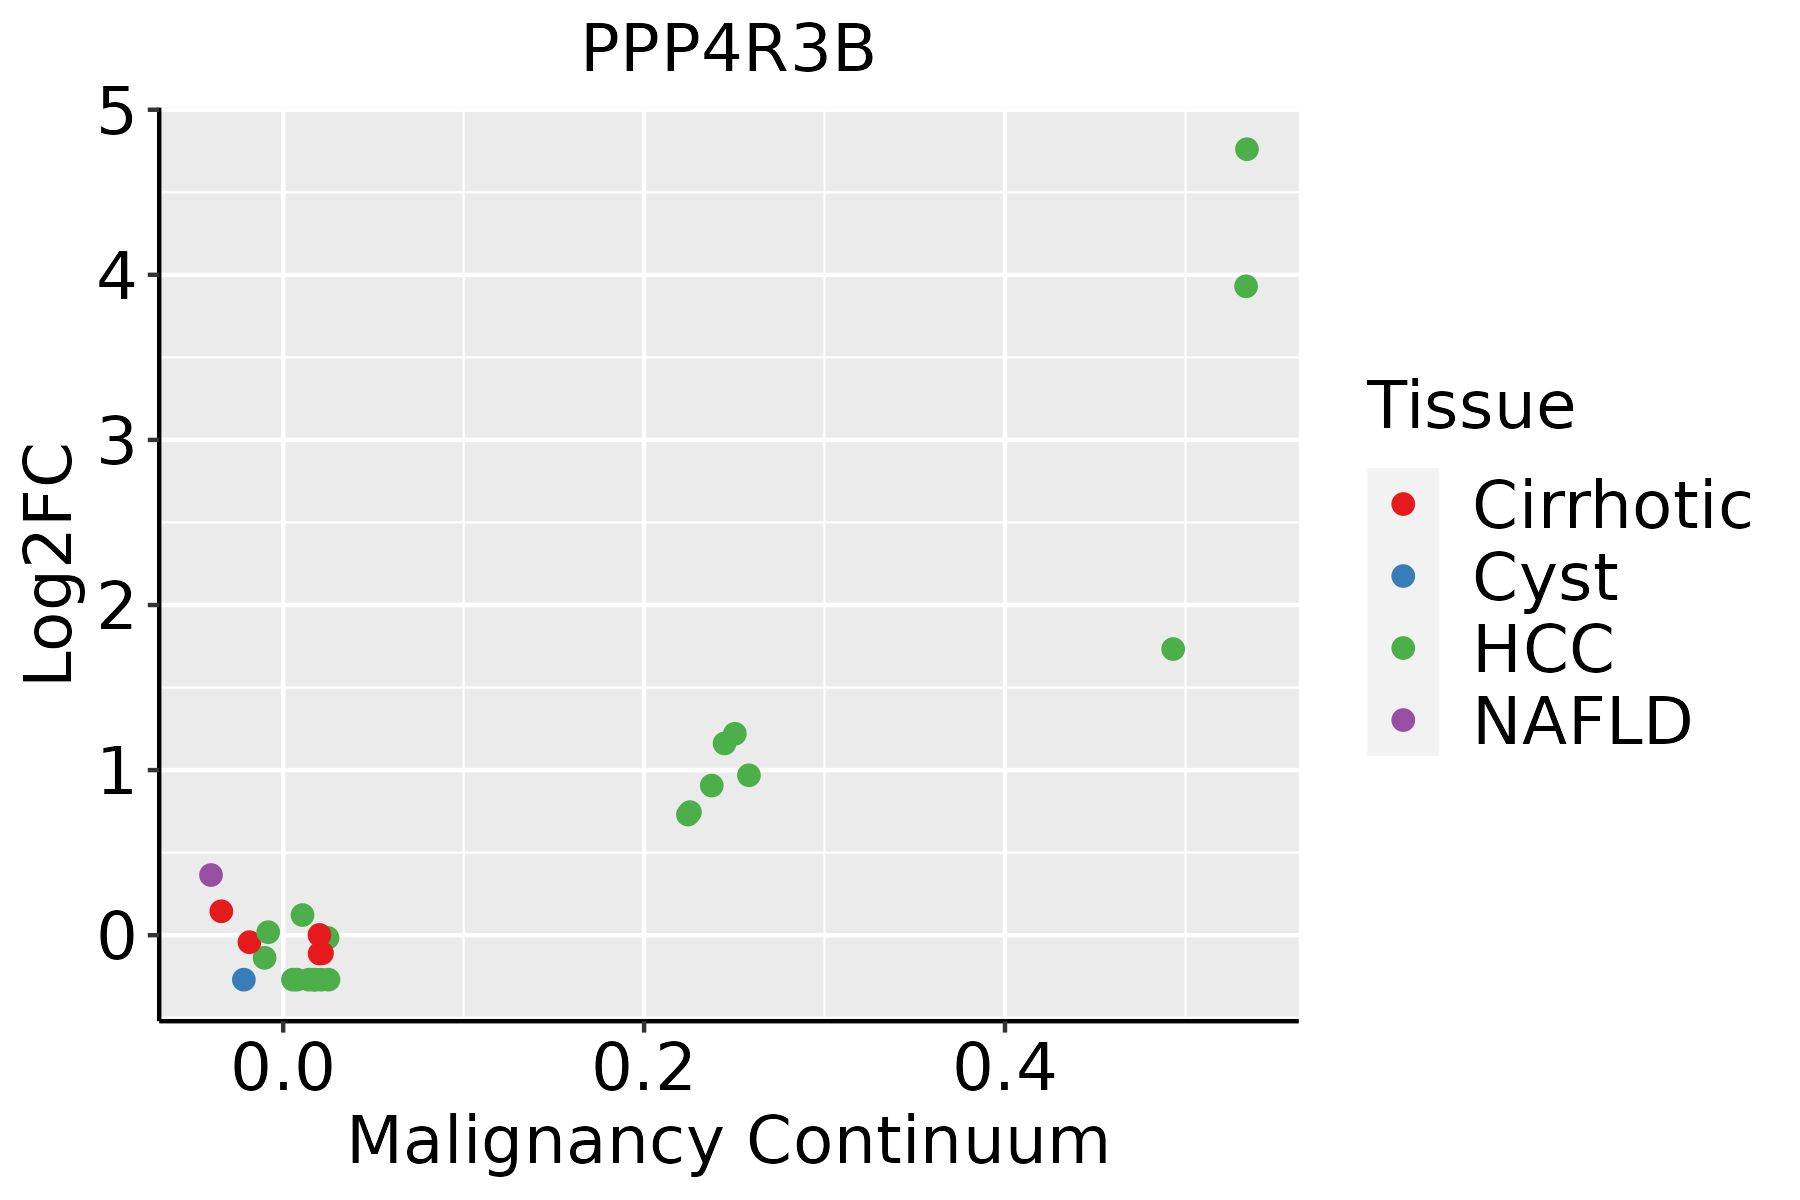 | HCC: Hepatocellular carcinoma |
| NAFLD: Non-alcoholic fatty liver disease | ||
| Oral Cavity |  | EOLP: Erosive Oral lichen planus |
| LP: leukoplakia | ||
| NEOLP: Non-erosive oral lichen planus | ||
| OSCC: Oral squamous cell carcinoma | ||
| Thyroid |  | ATC: Anaplastic thyroid cancer |
| HT: Hashimoto's thyroiditis | ||
| PTC: Papillary thyroid cancer |
| ∗log2FC in expression of this searched gene in stem-like cells from each diseased tissue sample relative to stem-like cells in normal samples in each tissue plotted against the malignancy continuum. Samples are colored based on if they are from different disease stage. |
Top |
Malignant transformation related pathway analysis |
| Find out the enriched GO biological processes and KEGG pathways involved in transition from healthy to precancer to cancer |
| Tissue | Disease Stage | Enriched GO biological Processes |
| Colorectum | AD |  |
| Colorectum | SER |  |
| Colorectum | MSS |  |
| Colorectum | MSI-H |  |
| Colorectum | FAP |  |
| ∗Top 15 enriched GO BP terms are showed in the bar plot of each disease state in each tissue. Each row represents a significant GO biological process which is colored according to the -log10(p.adjust). |
| Page: 1 2 3 4 5 6 7 8 9 |
| GO ID | Tissue | Disease Stage | Description | Gene Ratio | Bg Ratio | pvalue | p.adjust | Count |
| GO:00463641 | Liver | Cirrhotic | monosaccharide biosynthetic process | 37/4634 | 82/18723 | 4.52e-05 | 5.30e-04 | 37 |
| GO:004426211 | Liver | Cirrhotic | cellular carbohydrate metabolic process | 97/4634 | 283/18723 | 1.89e-04 | 1.76e-03 | 97 |
| GO:00160511 | Liver | Cirrhotic | carbohydrate biosynthetic process | 73/4634 | 202/18723 | 1.91e-04 | 1.77e-03 | 73 |
| GO:000647011 | Liver | Cirrhotic | protein dephosphorylation | 96/4634 | 281/18723 | 2.32e-04 | 2.11e-03 | 96 |
| GO:00109061 | Liver | Cirrhotic | regulation of glucose metabolic process | 47/4634 | 119/18723 | 2.61e-04 | 2.33e-03 | 47 |
| GO:00193191 | Liver | Cirrhotic | hexose biosynthetic process | 33/4634 | 78/18723 | 4.94e-04 | 3.96e-03 | 33 |
| GO:00060941 | Liver | Cirrhotic | gluconeogenesis | 32/4634 | 75/18723 | 5.00e-04 | 3.98e-03 | 32 |
| GO:00106751 | Liver | Cirrhotic | regulation of cellular carbohydrate metabolic process | 54/4634 | 146/18723 | 6.53e-04 | 4.96e-03 | 54 |
| GO:001631111 | Liver | Cirrhotic | dephosphorylation | 130/4634 | 417/18723 | 1.58e-03 | 1.03e-02 | 130 |
| GO:000599621 | Liver | HCC | monosaccharide metabolic process | 167/7958 | 257/18723 | 2.31e-13 | 1.25e-11 | 167 |
| GO:001931821 | Liver | HCC | hexose metabolic process | 155/7958 | 237/18723 | 7.63e-13 | 3.90e-11 | 155 |
| GO:000600621 | Liver | HCC | glucose metabolic process | 128/7958 | 196/18723 | 8.60e-11 | 3.06e-09 | 128 |
| GO:006201222 | Liver | HCC | regulation of small molecule metabolic process | 190/7958 | 334/18723 | 6.77e-08 | 1.40e-06 | 190 |
| GO:001631121 | Liver | HCC | dephosphorylation | 230/7958 | 417/18723 | 1.00e-07 | 1.96e-06 | 230 |
| GO:000647021 | Liver | HCC | protein dephosphorylation | 162/7958 | 281/18723 | 1.91e-07 | 3.46e-06 | 162 |
| GO:00463642 | Liver | HCC | monosaccharide biosynthetic process | 58/7958 | 82/18723 | 2.08e-07 | 3.75e-06 | 58 |
| GO:000610921 | Liver | HCC | regulation of carbohydrate metabolic process | 109/7958 | 178/18723 | 3.36e-07 | 5.78e-06 | 109 |
| GO:00193192 | Liver | HCC | hexose biosynthetic process | 54/7958 | 78/18723 | 1.61e-06 | 2.27e-05 | 54 |
| GO:00109062 | Liver | HCC | regulation of glucose metabolic process | 76/7958 | 119/18723 | 2.03e-06 | 2.79e-05 | 76 |
| GO:00060942 | Liver | HCC | gluconeogenesis | 52/7958 | 75/18723 | 2.34e-06 | 3.14e-05 | 52 |
| Page: 1 2 3 4 |
| Pathway ID | Tissue | Disease Stage | Description | Gene Ratio | Bg Ratio | pvalue | p.adjust | qvalue | Count |
| hsa0492214 | Esophagus | ESCC | Glucagon signaling pathway | 64/4205 | 107/8465 | 2.18e-02 | 4.80e-02 | 2.46e-02 | 64 |
| hsa0492215 | Esophagus | ESCC | Glucagon signaling pathway | 64/4205 | 107/8465 | 2.18e-02 | 4.80e-02 | 2.46e-02 | 64 |
| hsa0492221 | Liver | Cirrhotic | Glucagon signaling pathway | 43/2530 | 107/8465 | 1.42e-02 | 4.35e-02 | 2.68e-02 | 43 |
| hsa0492231 | Liver | Cirrhotic | Glucagon signaling pathway | 43/2530 | 107/8465 | 1.42e-02 | 4.35e-02 | 2.68e-02 | 43 |
| hsa0492241 | Liver | HCC | Glucagon signaling pathway | 64/4020 | 107/8465 | 6.70e-03 | 1.87e-02 | 1.04e-02 | 64 |
| hsa0492251 | Liver | HCC | Glucagon signaling pathway | 64/4020 | 107/8465 | 6.70e-03 | 1.87e-02 | 1.04e-02 | 64 |
| Page: 1 |
Top |
Cell-cell communication analysis |
| Identification of potential cell-cell interactions between two cell types and their ligand-receptor pairs for different disease states |
| Ligand | Receptor | LRpair | Pathway | Tissue | Disease Stage |
| Page: 1 |
Top |
Single-cell gene regulatory network inference analysis |
| Find out the significant the regulons (TFs) and the target genes of each regulon across cell types for different disease states |
| TF | Cell Type | Tissue | Disease Stage | Target Gene | RSS | Regulon Activity |
| ∗The dot plots of a searched regulon are shown for all cell subpopulations in each disease state of each tissue based on the regulon specific score inferred using pySCENIC and by calculating the average expression. |
| Page: 1 |
Top |
Somatic mutation of malignant transformation related genes |
| Annotation of somatic variants for genes involved in malignant transformation |
| Hugo Symbol | Variant Class | Variant Classification | dbSNP RS | HGVSc | HGVSp | HGVSp Short | SWISSPROT | BIOTYPE | SIFT | PolyPhen | Tumor Sample Barcode | Tissue | Histology | Sex | Age | Stage | Therapy Types | Drugs | Outcome |
| PPP4R3B | SNV | Missense_Mutation | c.2248N>A | p.Glu750Lys | p.E750K | Q5MIZ7 | protein_coding | tolerated(0.2) | benign(0.007) | TCGA-AC-A23H-01 | Breast | breast invasive carcinoma | Female | >=65 | I/II | Unknown | Unknown | PD | |
| PPP4R3B | SNV | Missense_Mutation | rs780439305 | c.2155G>A | p.Glu719Lys | p.E719K | Q5MIZ7 | protein_coding | tolerated(0.16) | benign(0.013) | TCGA-AR-A0TX-01 | Breast | breast invasive carcinoma | Female | <65 | I/II | Unknown | Unknown | SD |
| PPP4R3B | SNV | Missense_Mutation | novel | c.98A>G | p.Glu33Gly | p.E33G | Q5MIZ7 | protein_coding | deleterious(0.03) | possibly_damaging(0.611) | TCGA-BH-A0BM-01 | Breast | breast invasive carcinoma | Female | <65 | I/II | Chemotherapy | adriamycin | SD |
| PPP4R3B | SNV | Missense_Mutation | c.545N>C | p.Cys182Ser | p.C182S | Q5MIZ7 | protein_coding | deleterious(0.02) | probably_damaging(1) | TCGA-D8-A1JD-01 | Breast | breast invasive carcinoma | Female | <65 | I/II | Chemotherapy | adriamycin | SD | |
| PPP4R3B | SNV | Missense_Mutation | novel | c.271N>A | p.Asp91Asn | p.D91N | Q5MIZ7 | protein_coding | deleterious(0.02) | probably_damaging(0.979) | TCGA-D8-A1XW-01 | Breast | breast invasive carcinoma | Female | <65 | I/II | Chemotherapy | adriamycin+cyclophosphamide | SD |
| PPP4R3B | SNV | Missense_Mutation | c.1450G>A | p.Glu484Lys | p.E484K | Q5MIZ7 | protein_coding | tolerated(0.13) | benign(0.003) | TCGA-EW-A1PB-01 | Breast | breast invasive carcinoma | Female | >=65 | III/IV | Unknown | Unknown | SD | |
| PPP4R3B | SNV | Missense_Mutation | c.1766G>A | p.Cys589Tyr | p.C589Y | Q5MIZ7 | protein_coding | deleterious(0) | possibly_damaging(0.862) | TCGA-GI-A2C8-01 | Breast | breast invasive carcinoma | Female | <65 | III/IV | Unspecific | Adriamycin | SD | |
| PPP4R3B | insertion | In_Frame_Ins | novel | c.309_310insTGTTTTCTGATGAGTGTATCATGGATGTCGTGG | p.Lys103_Asp104insCysPheLeuMetSerValSerTrpMetSerTrp | p.K103_D104insCFLMSVSWMSW | Q5MIZ7 | protein_coding | TCGA-BH-A0HQ-01 | Breast | breast invasive carcinoma | Female | <65 | I/II | Hormone Therapy | arimidex | SD | ||
| PPP4R3B | SNV | Missense_Mutation | c.5N>T | p.Ser2Leu | p.S2L | Q5MIZ7 | protein_coding | deleterious(0.03) | benign(0.154) | TCGA-EK-A2RB-01 | Cervix | cervical & endocervical cancer | Female | <65 | I/II | Unknown | Unknown | SD | |
| PPP4R3B | SNV | Missense_Mutation | c.43N>A | p.Glu15Lys | p.E15K | Q5MIZ7 | protein_coding | deleterious(0.03) | benign(0.102) | TCGA-IR-A3LI-01 | Cervix | cervical & endocervical cancer | Female | <65 | I/II | Chemotherapy | cisplatin | CR |
| Page: 1 2 3 4 5 6 7 8 |
Top |
Related drugs of malignant transformation related genes |
| Identification of chemicals and drugs interact with genes involved in malignant transfromation |
| (DGIdb 4.0) |
| Entrez ID | Symbol | Category | Interaction Types | Drug Claim Name | Drug Name | PMIDs |
| Page: 1 |

Copyright 2023-Present -The University of Texas Health Science Center at Houston |