
|
|||||
|
 | |
| |
| |
| |
| |
| |
|
Gene: PPP1R3C |
Gene summary for PPP1R3C |
| Gene information | Species | Human | Gene symbol | PPP1R3C | Gene ID | 5507 |
| Gene name | protein phosphatase 1 regulatory subunit 3C | |
| Gene Alias | PPP1R5 | |
| Cytomap | 10q23.32 | |
| Gene Type | protein-coding | GO ID | GO:0000271 | UniProtAcc | Q9UQK1 |
Top |
Malignant transformation analysis |
| Identification of the aberrant gene expression in precancerous and cancerous lesions by comparing the gene expression of stem-like cells in diseased tissues with normal stem cells |
| Entrez ID | Symbol | Replicates | Species | Organ | Tissue | Adj P-value | Log2FC | Malignancy |
| 5507 | PPP1R3C | NAFLD1 | Human | Liver | NAFLD | 1.33e-06 | 5.41e-01 | -0.04 |
| 5507 | PPP1R3C | HCC1_Meng | Human | Liver | HCC | 2.15e-18 | 2.42e-02 | 0.0246 |
| 5507 | PPP1R3C | HCC2 | Human | Liver | HCC | 6.31e-09 | 3.19e+00 | 0.5341 |
| 5507 | PPP1R3C | Pt13.b | Human | Liver | HCC | 1.57e-04 | 8.82e-02 | 0.0251 |
| 5507 | PPP1R3C | S015 | Human | Liver | HCC | 4.68e-04 | 4.85e-01 | 0.2375 |
| Page: 1 |
| Tissue | Expression Dynamics | Abbreviation |
| Liver | 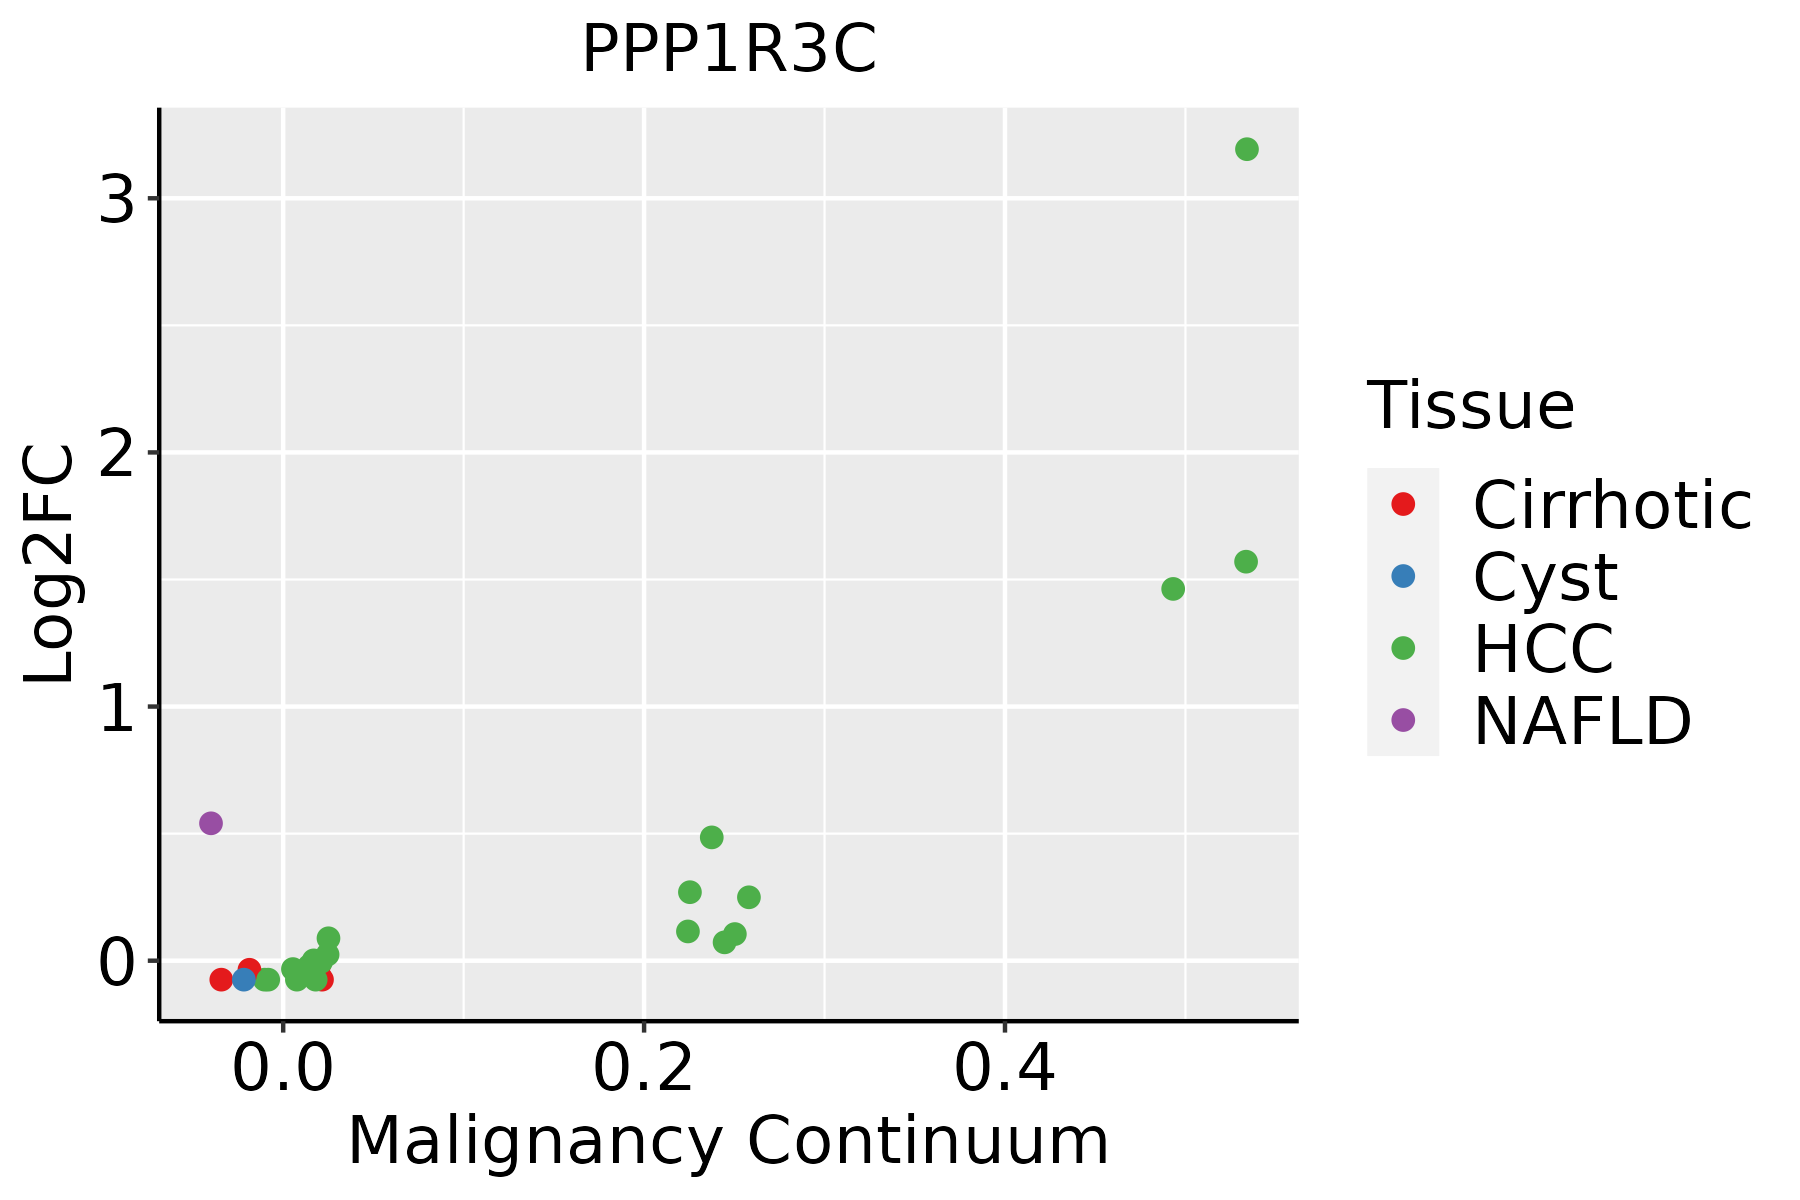 | HCC: Hepatocellular carcinoma |
| NAFLD: Non-alcoholic fatty liver disease |
| ∗log2FC in expression of this searched gene in stem-like cells from each diseased tissue sample relative to stem-like cells in normal samples in each tissue plotted against the malignancy continuum. Samples are colored based on if they are from different disease stage. |
Top |
Malignant transformation related pathway analysis |
| Find out the enriched GO biological processes and KEGG pathways involved in transition from healthy to precancer to cancer |
| Tissue | Disease Stage | Enriched GO biological Processes |
| Colorectum | AD |  |
| Colorectum | SER |  |
| Colorectum | MSS |  |
| Colorectum | MSI-H |  |
| Colorectum | FAP |  |
| ∗Top 15 enriched GO BP terms are showed in the bar plot of each disease state in each tissue. Each row represents a significant GO biological process which is colored according to the -log10(p.adjust). |
| Page: 1 2 3 4 5 6 7 8 9 |
| GO ID | Tissue | Disease Stage | Description | Gene Ratio | Bg Ratio | pvalue | p.adjust | Count |
| GO:0043255 | Liver | NAFLD | regulation of carbohydrate biosynthetic process | 20/1882 | 97/18723 | 1.39e-03 | 1.56e-02 | 20 |
| GO:0006112 | Liver | NAFLD | energy reserve metabolic process | 18/1882 | 84/18723 | 1.49e-03 | 1.64e-02 | 18 |
| GO:0033692 | Liver | NAFLD | cellular polysaccharide biosynthetic process | 15/1882 | 65/18723 | 1.66e-03 | 1.74e-02 | 15 |
| GO:00159807 | Liver | NAFLD | energy derivation by oxidation of organic compounds | 48/1882 | 318/18723 | 2.78e-03 | 2.54e-02 | 48 |
| GO:0005978 | Liver | NAFLD | glycogen biosynthetic process | 11/1882 | 44/18723 | 3.45e-03 | 2.98e-02 | 11 |
| GO:0009250 | Liver | NAFLD | glucan biosynthetic process | 11/1882 | 44/18723 | 3.45e-03 | 2.98e-02 | 11 |
| GO:000609122 | Liver | HCC | generation of precursor metabolites and energy | 340/7958 | 490/18723 | 4.04e-34 | 2.85e-31 | 340 |
| GO:001598022 | Liver | HCC | energy derivation by oxidation of organic compounds | 221/7958 | 318/18723 | 1.02e-22 | 1.86e-20 | 221 |
| GO:000599621 | Liver | HCC | monosaccharide metabolic process | 167/7958 | 257/18723 | 2.31e-13 | 1.25e-11 | 167 |
| GO:001931821 | Liver | HCC | hexose metabolic process | 155/7958 | 237/18723 | 7.63e-13 | 3.90e-11 | 155 |
| GO:000600621 | Liver | HCC | glucose metabolic process | 128/7958 | 196/18723 | 8.60e-11 | 3.06e-09 | 128 |
| GO:004346722 | Liver | HCC | regulation of generation of precursor metabolites and energy | 89/7958 | 130/18723 | 1.84e-09 | 5.35e-08 | 89 |
| GO:006201222 | Liver | HCC | regulation of small molecule metabolic process | 190/7958 | 334/18723 | 6.77e-08 | 1.40e-06 | 190 |
| GO:001631121 | Liver | HCC | dephosphorylation | 230/7958 | 417/18723 | 1.00e-07 | 1.96e-06 | 230 |
| GO:000647021 | Liver | HCC | protein dephosphorylation | 162/7958 | 281/18723 | 1.91e-07 | 3.46e-06 | 162 |
| GO:000610921 | Liver | HCC | regulation of carbohydrate metabolic process | 109/7958 | 178/18723 | 3.36e-07 | 5.78e-06 | 109 |
| GO:00109062 | Liver | HCC | regulation of glucose metabolic process | 76/7958 | 119/18723 | 2.03e-06 | 2.79e-05 | 76 |
| GO:00106752 | Liver | HCC | regulation of cellular carbohydrate metabolic process | 88/7958 | 146/18723 | 1.08e-05 | 1.24e-04 | 88 |
| GO:004426221 | Liver | HCC | cellular carbohydrate metabolic process | 153/7958 | 283/18723 | 5.27e-05 | 5.00e-04 | 153 |
| GO:00160512 | Liver | HCC | carbohydrate biosynthetic process | 113/7958 | 202/18723 | 7.64e-05 | 6.83e-04 | 113 |
| Page: 1 2 3 |
| Pathway ID | Tissue | Disease Stage | Description | Gene Ratio | Bg Ratio | pvalue | p.adjust | qvalue | Count |
| hsa049316 | Liver | NAFLD | Insulin resistance | 29/1043 | 108/8465 | 3.01e-05 | 7.59e-04 | 6.11e-04 | 29 |
| hsa049106 | Liver | NAFLD | Insulin signaling pathway | 29/1043 | 137/8465 | 2.23e-03 | 2.46e-02 | 1.99e-02 | 29 |
| hsa0493111 | Liver | NAFLD | Insulin resistance | 29/1043 | 108/8465 | 3.01e-05 | 7.59e-04 | 6.11e-04 | 29 |
| hsa0491011 | Liver | NAFLD | Insulin signaling pathway | 29/1043 | 137/8465 | 2.23e-03 | 2.46e-02 | 1.99e-02 | 29 |
| hsa0491041 | Liver | HCC | Insulin signaling pathway | 95/4020 | 137/8465 | 1.53e-07 | 1.97e-06 | 1.10e-06 | 95 |
| hsa0493121 | Liver | HCC | Insulin resistance | 77/4020 | 108/8465 | 3.89e-07 | 4.46e-06 | 2.48e-06 | 77 |
| hsa0491051 | Liver | HCC | Insulin signaling pathway | 95/4020 | 137/8465 | 1.53e-07 | 1.97e-06 | 1.10e-06 | 95 |
| hsa0493131 | Liver | HCC | Insulin resistance | 77/4020 | 108/8465 | 3.89e-07 | 4.46e-06 | 2.48e-06 | 77 |
| Page: 1 |
Top |
Cell-cell communication analysis |
| Identification of potential cell-cell interactions between two cell types and their ligand-receptor pairs for different disease states |
| Ligand | Receptor | LRpair | Pathway | Tissue | Disease Stage |
| Page: 1 |
Top |
Single-cell gene regulatory network inference analysis |
| Find out the significant the regulons (TFs) and the target genes of each regulon across cell types for different disease states |
| TF | Cell Type | Tissue | Disease Stage | Target Gene | RSS | Regulon Activity |
| ∗The dot plots of a searched regulon are shown for all cell subpopulations in each disease state of each tissue based on the regulon specific score inferred using pySCENIC and by calculating the average expression. |
| Page: 1 |
Top |
Somatic mutation of malignant transformation related genes |
| Annotation of somatic variants for genes involved in malignant transformation |
| Hugo Symbol | Variant Class | Variant Classification | dbSNP RS | HGVSc | HGVSp | HGVSp Short | SWISSPROT | BIOTYPE | SIFT | PolyPhen | Tumor Sample Barcode | Tissue | Histology | Sex | Age | Stage | Therapy Types | Drugs | Outcome |
| PPP1R3C | SNV | Missense_Mutation | rs780294568 | c.53N>T | p.Ser18Leu | p.S18L | Q9UQK1 | protein_coding | tolerated(0.09) | possibly_damaging(0.715) | TCGA-AN-A046-01 | Breast | breast invasive carcinoma | Female | >=65 | I/II | Unknown | Unknown | SD |
| PPP1R3C | SNV | Missense_Mutation | c.927N>C | p.Arg309Ser | p.R309S | Q9UQK1 | protein_coding | tolerated(0.08) | benign(0.007) | TCGA-AA-A00N-01 | Colorectum | colon adenocarcinoma | Male | >=65 | I/II | Unknown | Unknown | PD | |
| PPP1R3C | SNV | Missense_Mutation | c.361N>A | p.Asp121Asn | p.D121N | Q9UQK1 | protein_coding | tolerated(0.55) | benign(0.001) | TCGA-AA-A010-01 | Colorectum | colon adenocarcinoma | Female | <65 | I/II | Chemotherapy | folinic | CR | |
| PPP1R3C | SNV | Missense_Mutation | novel | c.915N>T | p.Gln305His | p.Q305H | Q9UQK1 | protein_coding | deleterious(0.03) | benign(0.015) | TCGA-CA-6717-01 | Colorectum | colon adenocarcinoma | Male | <65 | I/II | Chemotherapy | oxaliplatin | CR |
| PPP1R3C | SNV | Missense_Mutation | novel | c.194N>C | p.Lys65Thr | p.K65T | Q9UQK1 | protein_coding | tolerated(0.16) | benign(0.395) | TCGA-CA-6717-01 | Colorectum | colon adenocarcinoma | Male | <65 | I/II | Chemotherapy | oxaliplatin | CR |
| PPP1R3C | SNV | Missense_Mutation | rs182503852 | c.430N>A | p.Asp144Asn | p.D144N | Q9UQK1 | protein_coding | tolerated(0.05) | probably_damaging(0.973) | TCGA-D5-6534-01 | Colorectum | colon adenocarcinoma | Female | <65 | I/II | Unknown | Unknown | SD |
| PPP1R3C | SNV | Missense_Mutation | c.100N>A | p.Pro34Thr | p.P34T | Q9UQK1 | protein_coding | deleterious(0) | probably_damaging(0.956) | TCGA-F4-6856-01 | Colorectum | colon adenocarcinoma | Male | <65 | I/II | Ancillary | leucovorin | CR | |
| PPP1R3C | SNV | Missense_Mutation | novel | c.380N>T | p.Lys127Ile | p.K127I | Q9UQK1 | protein_coding | deleterious(0.01) | probably_damaging(0.938) | TCGA-AG-A002-01 | Colorectum | rectum adenocarcinoma | Male | <65 | I/II | Unknown | Unknown | SD |
| PPP1R3C | SNV | Missense_Mutation | novel | c.208T>C | p.Ser70Pro | p.S70P | Q9UQK1 | protein_coding | tolerated(0.23) | benign(0.001) | TCGA-F5-6814-01 | Colorectum | rectum adenocarcinoma | Male | <65 | I/II | Unknown | Unknown | SD |
| PPP1R3C | SNV | Missense_Mutation | rs780294568 | c.53N>T | p.Ser18Leu | p.S18L | Q9UQK1 | protein_coding | tolerated(0.09) | possibly_damaging(0.715) | TCGA-A5-A0G2-01 | Endometrium | uterine corpus endometrioid carcinoma | Female | <65 | III/IV | Unknown | Unknown | SD |
| Page: 1 2 3 4 |
Top |
Related drugs of malignant transformation related genes |
| Identification of chemicals and drugs interact with genes involved in malignant transfromation |
| (DGIdb 4.0) |
| Entrez ID | Symbol | Category | Interaction Types | Drug Claim Name | Drug Name | PMIDs |
| Page: 1 |

Copyright 2023-Present -The University of Texas Health Science Center at Houston |