
|
|||||
|
 | |
| |
| |
| |
| |
| |
|
Gene: PPHLN1 |
Gene summary for PPHLN1 |
| Gene information | Species | Human | Gene symbol | PPHLN1 | Gene ID | 51535 |
| Gene name | periphilin 1 | |
| Gene Alias | CR | |
| Cytomap | 12q12 | |
| Gene Type | protein-coding | GO ID | GO:0006139 | UniProtAcc | Q8NEY8 |
Top |
Malignant transformation analysis |
| Identification of the aberrant gene expression in precancerous and cancerous lesions by comparing the gene expression of stem-like cells in diseased tissues with normal stem cells |
| Entrez ID | Symbol | Replicates | Species | Organ | Tissue | Adj P-value | Log2FC | Malignancy |
| 51535 | PPHLN1 | CCI_2 | Human | Cervix | CC | 1.32e-06 | 6.88e-01 | 0.5249 |
| 51535 | PPHLN1 | CCI_3 | Human | Cervix | CC | 1.05e-04 | 5.55e-01 | 0.516 |
| 51535 | PPHLN1 | HTA11_3410_2000001011 | Human | Colorectum | AD | 2.93e-12 | -5.04e-01 | 0.0155 |
| 51535 | PPHLN1 | HTA11_696_2000001011 | Human | Colorectum | AD | 3.31e-02 | -2.28e-01 | -0.1464 |
| 51535 | PPHLN1 | HTA11_5216_2000001011 | Human | Colorectum | SER | 4.82e-02 | -6.15e-01 | -0.1462 |
| 51535 | PPHLN1 | HTA11_7696_3000711011 | Human | Colorectum | AD | 1.58e-02 | -2.56e-01 | 0.0674 |
| 51535 | PPHLN1 | HTA11_99999974143_84620 | Human | Colorectum | MSS | 3.85e-06 | -3.42e-01 | 0.3005 |
| 51535 | PPHLN1 | F007 | Human | Colorectum | FAP | 2.55e-02 | -2.33e-01 | 0.1176 |
| 51535 | PPHLN1 | A001-C-207 | Human | Colorectum | FAP | 2.04e-04 | -3.31e-01 | 0.1278 |
| 51535 | PPHLN1 | A015-C-203 | Human | Colorectum | FAP | 1.14e-29 | -4.20e-01 | -0.1294 |
| 51535 | PPHLN1 | A015-C-204 | Human | Colorectum | FAP | 8.21e-06 | -3.55e-01 | -0.0228 |
| 51535 | PPHLN1 | A014-C-040 | Human | Colorectum | FAP | 1.25e-05 | -5.37e-01 | -0.1184 |
| 51535 | PPHLN1 | A002-C-201 | Human | Colorectum | FAP | 1.08e-14 | -3.78e-01 | 0.0324 |
| 51535 | PPHLN1 | A002-C-203 | Human | Colorectum | FAP | 3.85e-06 | -1.32e-01 | 0.2786 |
| 51535 | PPHLN1 | A001-C-119 | Human | Colorectum | FAP | 1.59e-09 | -4.59e-01 | -0.1557 |
| 51535 | PPHLN1 | A001-C-108 | Human | Colorectum | FAP | 1.27e-19 | -3.30e-01 | -0.0272 |
| 51535 | PPHLN1 | A002-C-205 | Human | Colorectum | FAP | 3.78e-21 | -4.81e-01 | -0.1236 |
| 51535 | PPHLN1 | A001-C-104 | Human | Colorectum | FAP | 1.50e-04 | -2.22e-01 | 0.0184 |
| 51535 | PPHLN1 | A015-C-005 | Human | Colorectum | FAP | 3.76e-04 | -2.42e-01 | -0.0336 |
| 51535 | PPHLN1 | A015-C-006 | Human | Colorectum | FAP | 6.37e-12 | -2.91e-01 | -0.0994 |
| Page: 1 2 3 4 5 6 7 8 |
| Tissue | Expression Dynamics | Abbreviation |
| Cervix | 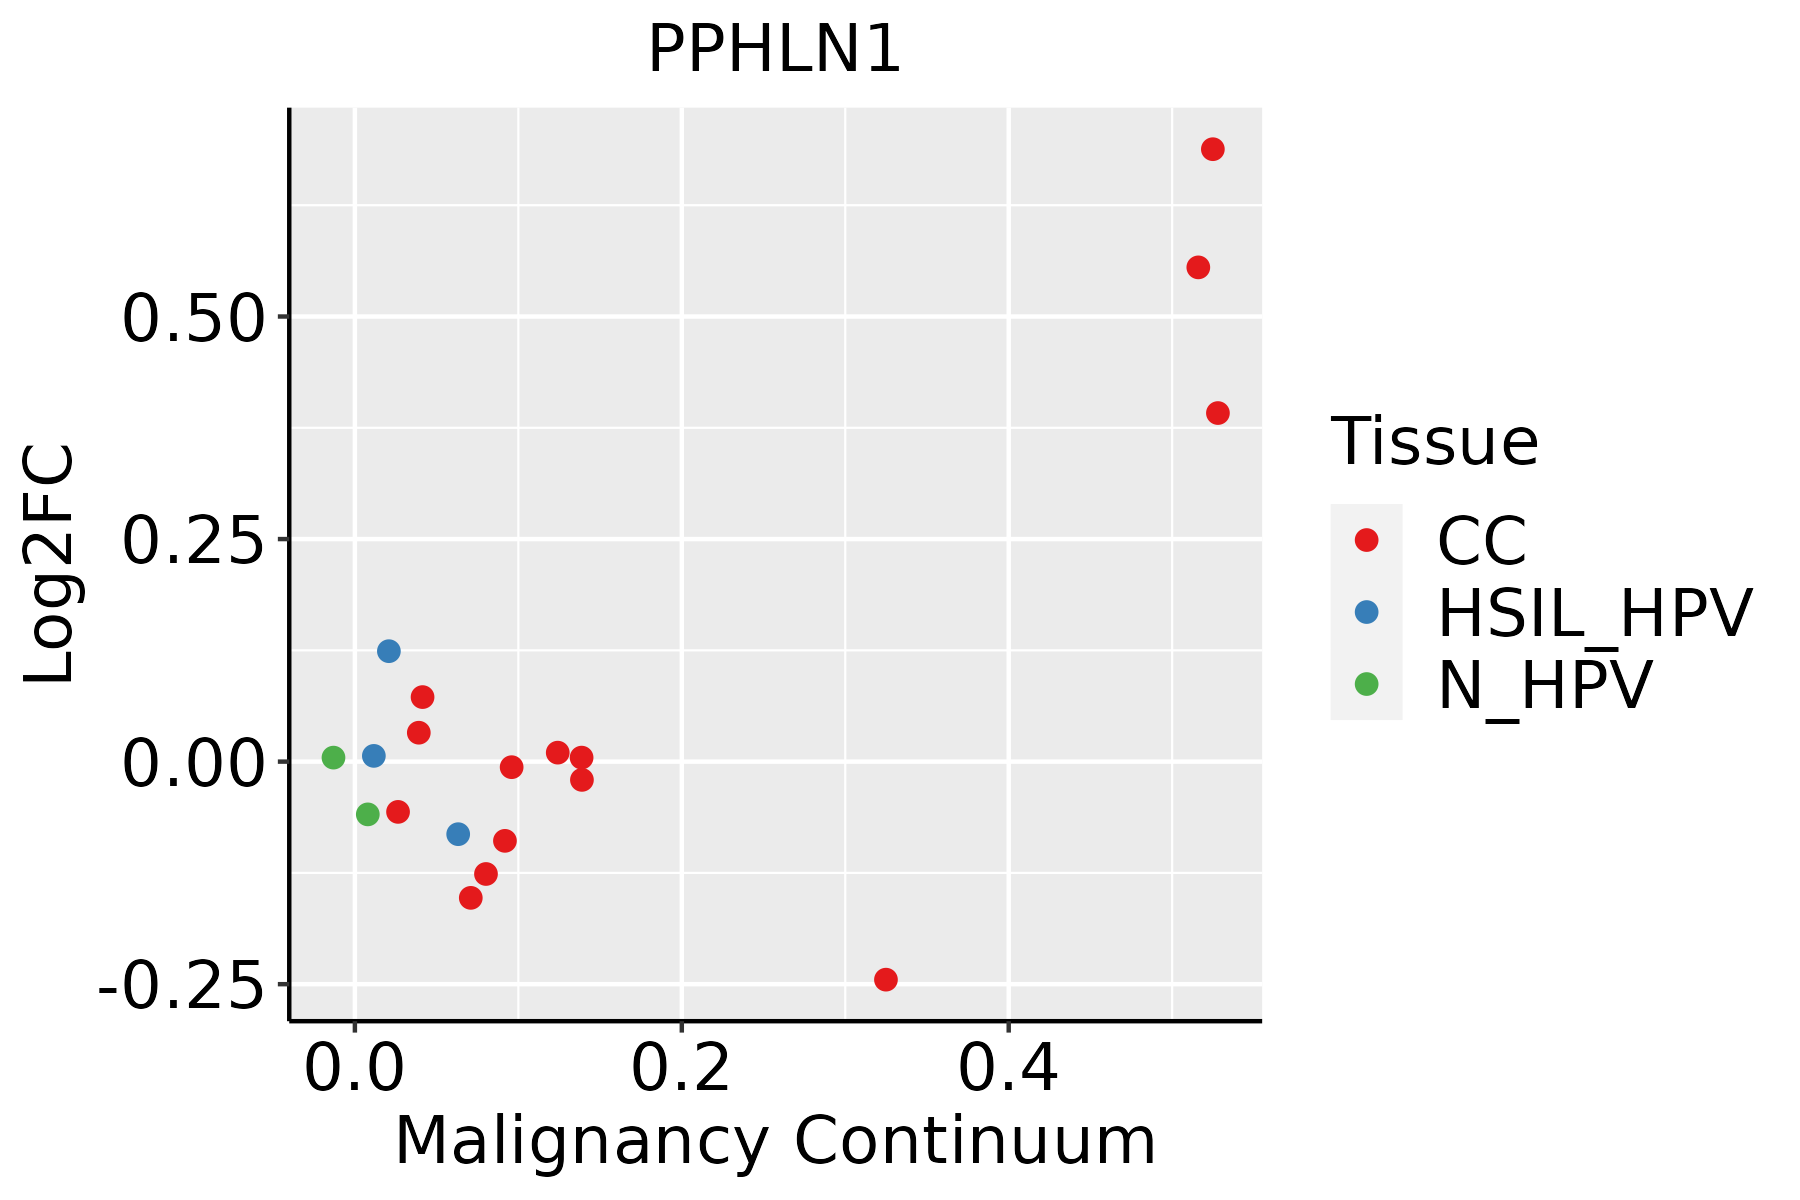 | CC: Cervix cancer |
| HSIL_HPV: HPV-infected high-grade squamous intraepithelial lesions | ||
| N_HPV: HPV-infected normal cervix | ||
| Colorectum (GSE201348) |  | FAP: Familial adenomatous polyposis |
| CRC: Colorectal cancer | ||
| Colorectum (HTA11) |  | AD: Adenomas |
| SER: Sessile serrated lesions | ||
| MSI-H: Microsatellite-high colorectal cancer | ||
| MSS: Microsatellite stable colorectal cancer | ||
| Esophagus | 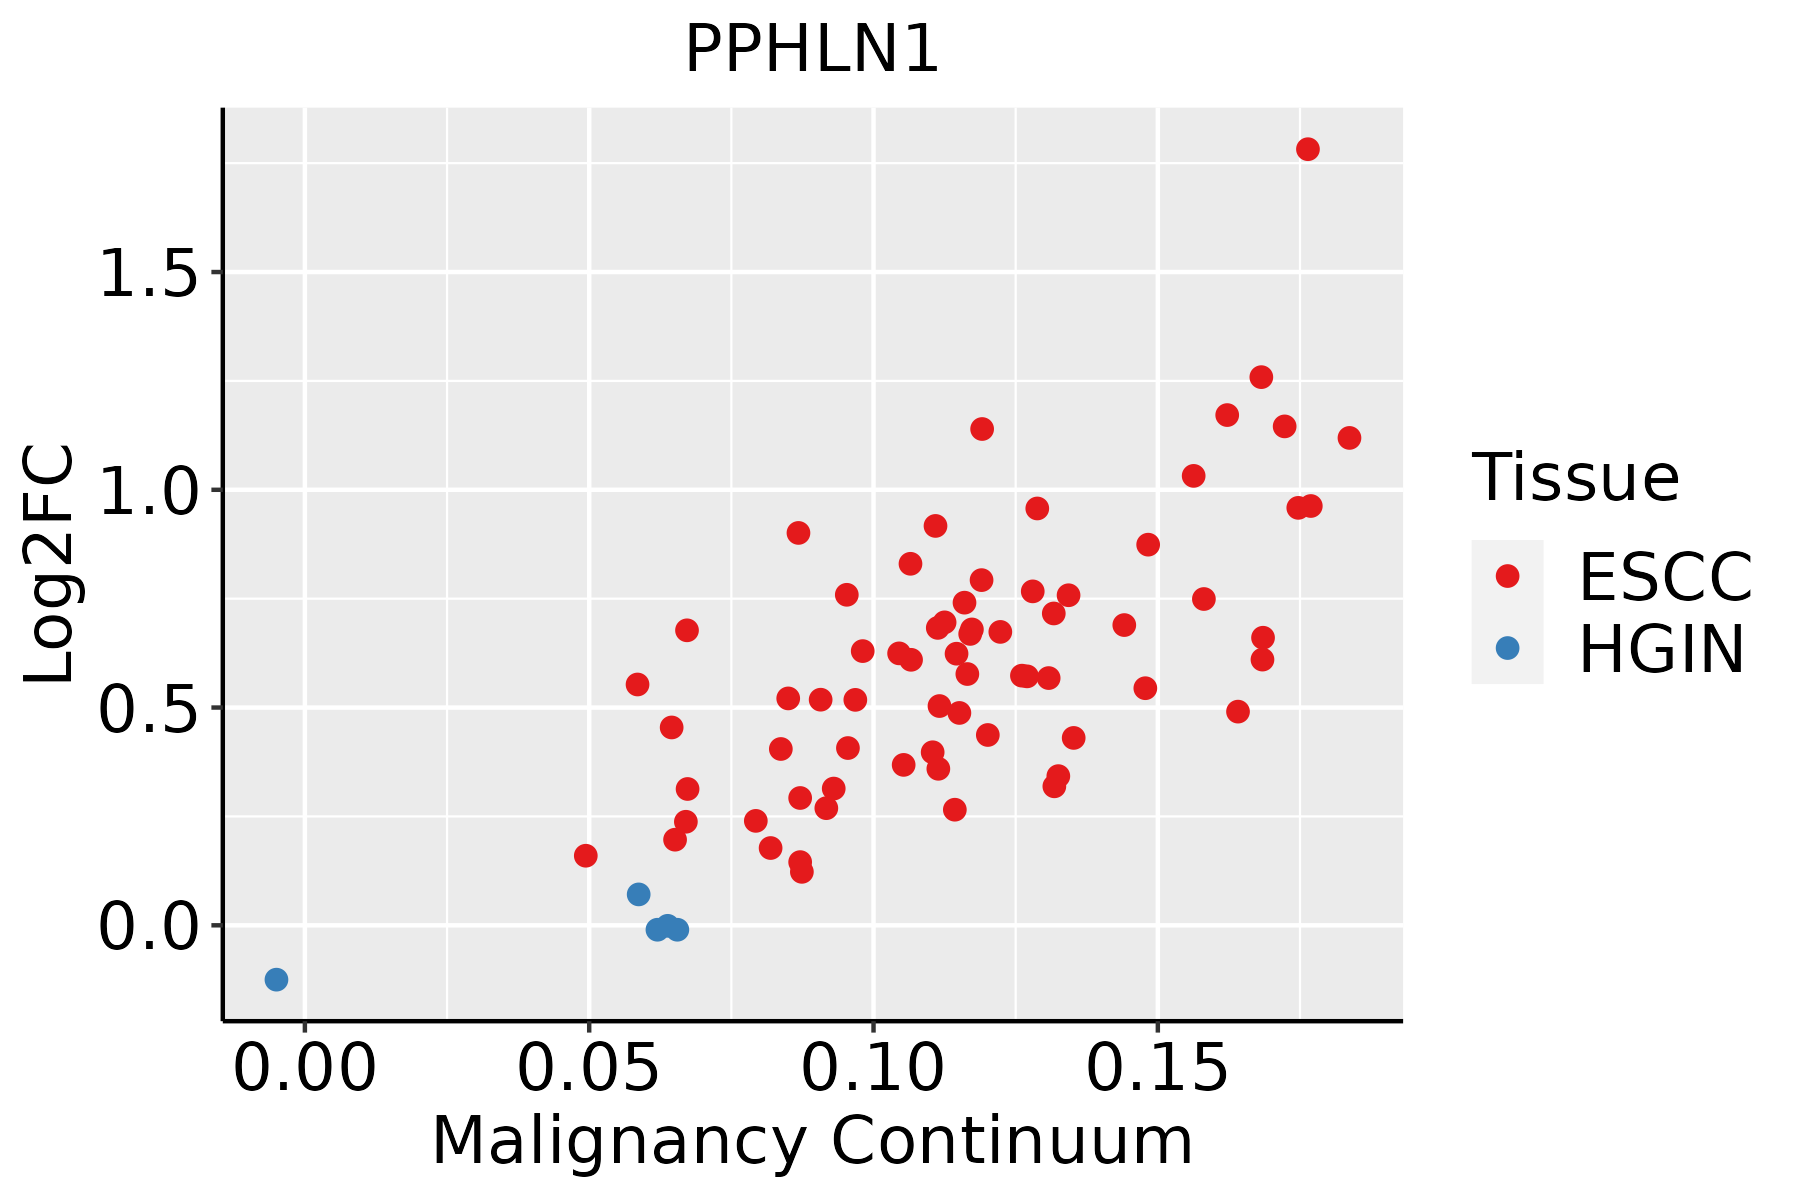 | ESCC: Esophageal squamous cell carcinoma |
| HGIN: High-grade intraepithelial neoplasias | ||
| LGIN: Low-grade intraepithelial neoplasias | ||
| Liver | 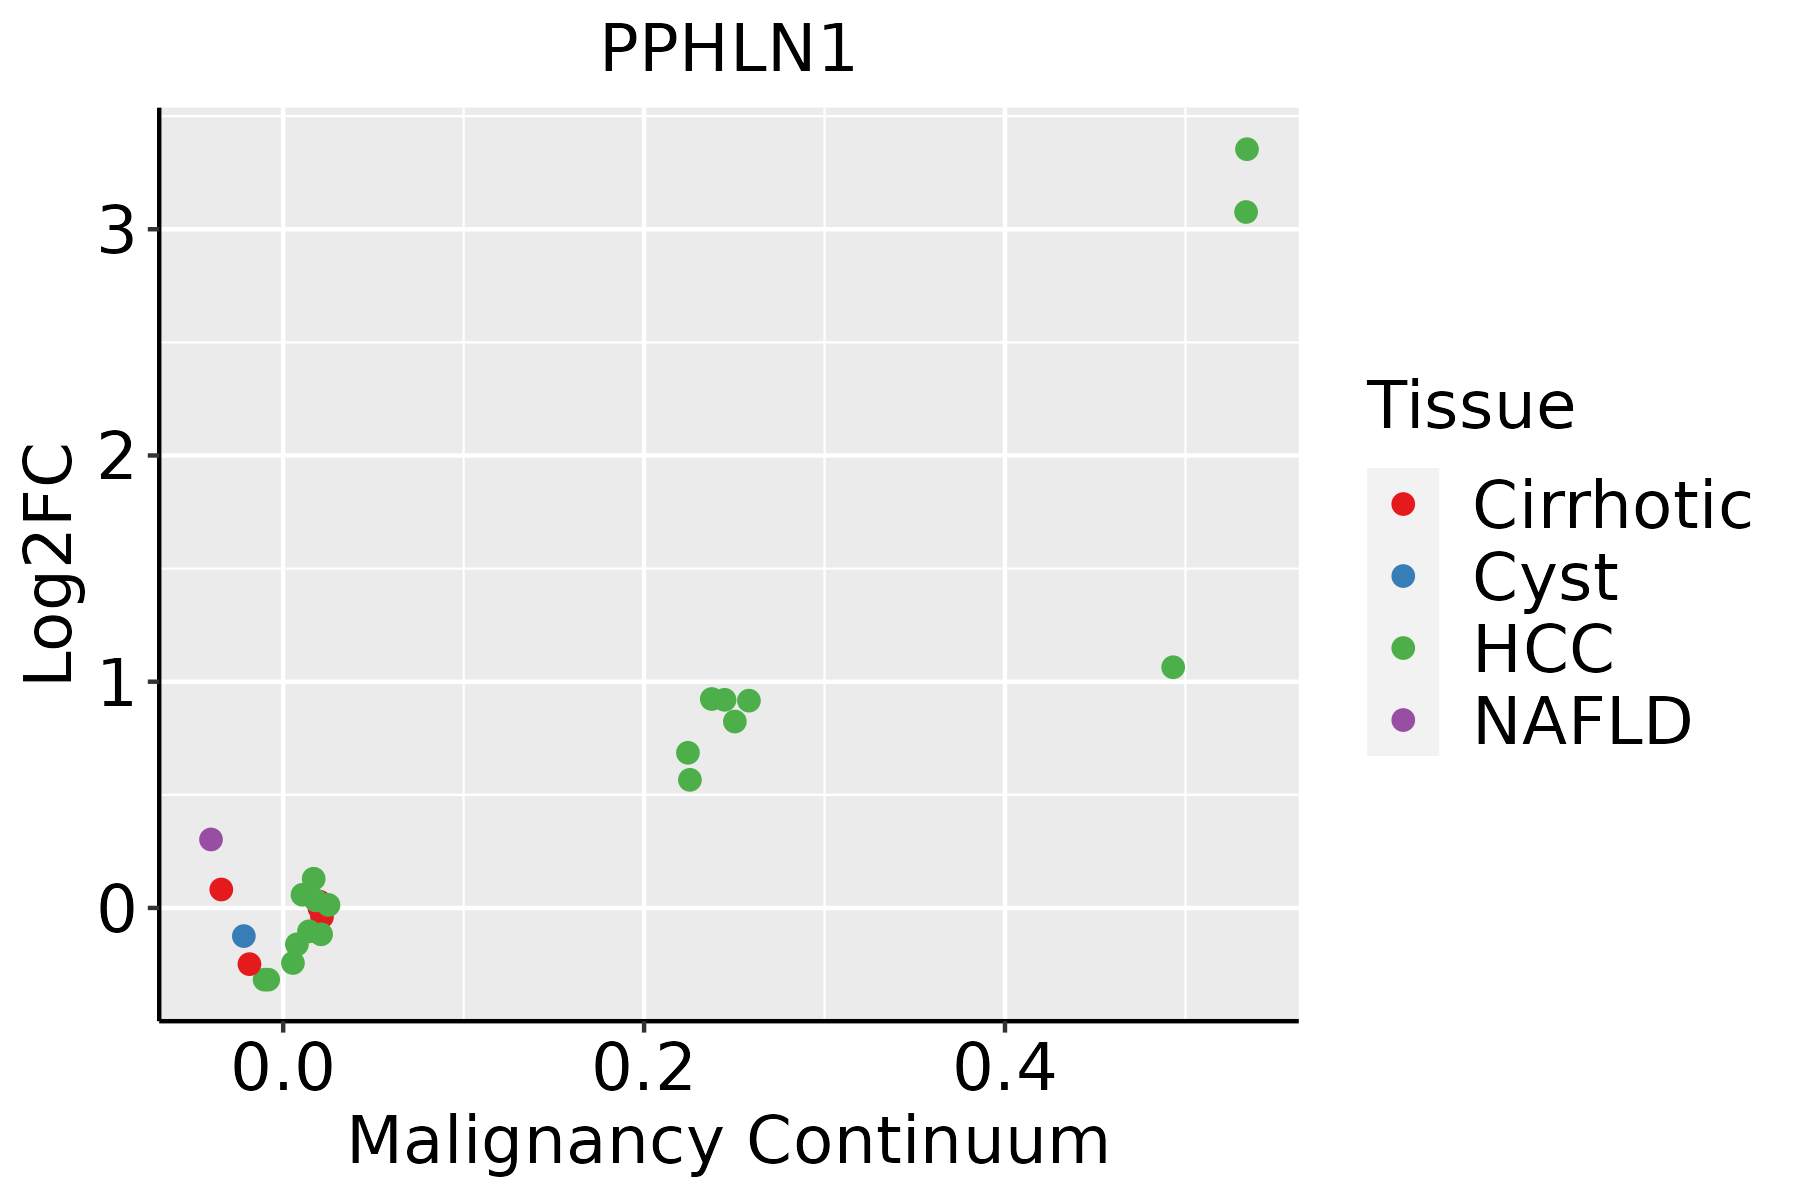 | HCC: Hepatocellular carcinoma |
| NAFLD: Non-alcoholic fatty liver disease | ||
| Oral Cavity | 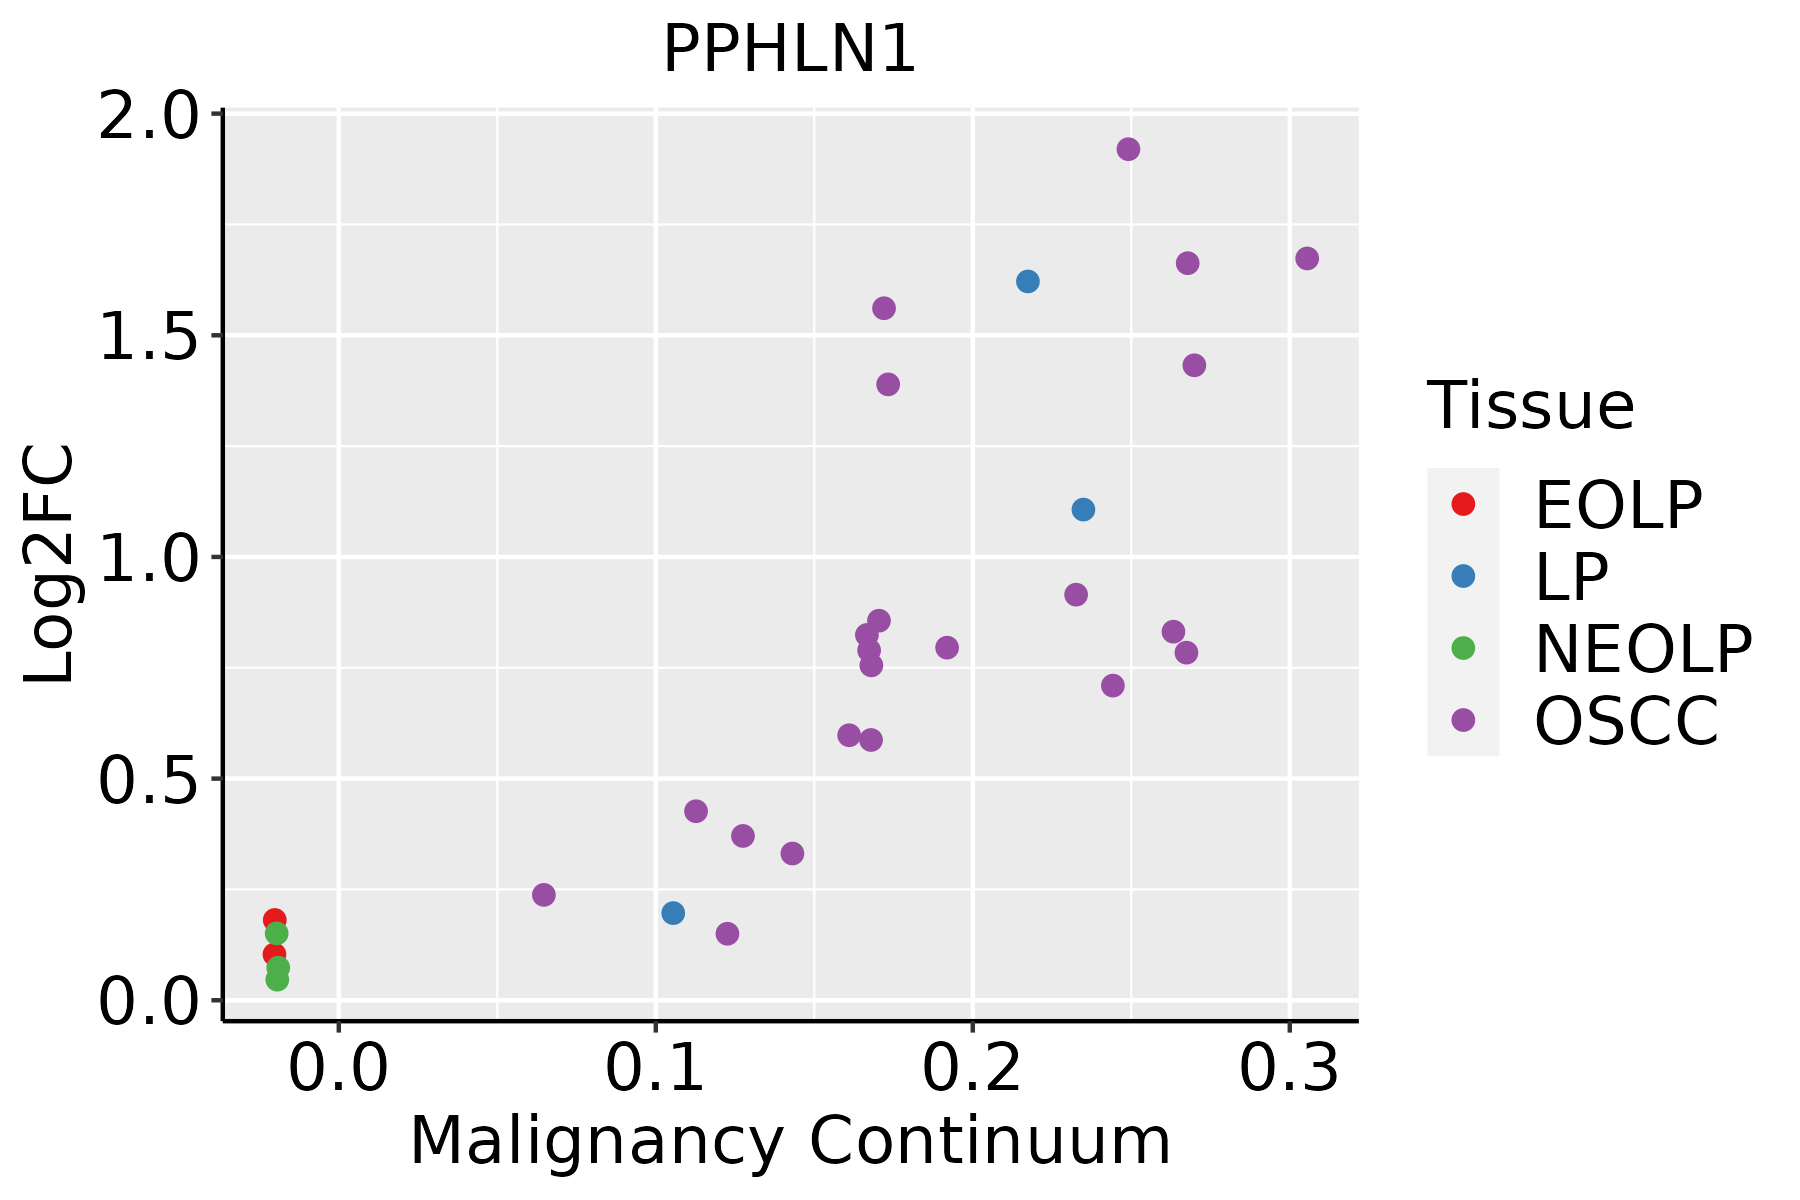 | EOLP: Erosive Oral lichen planus |
| LP: leukoplakia | ||
| NEOLP: Non-erosive oral lichen planus | ||
| OSCC: Oral squamous cell carcinoma | ||
| Skin |  | AK: Actinic keratosis |
| cSCC: Cutaneous squamous cell carcinoma | ||
| SCCIS:squamous cell carcinoma in situ | ||
| Thyroid | 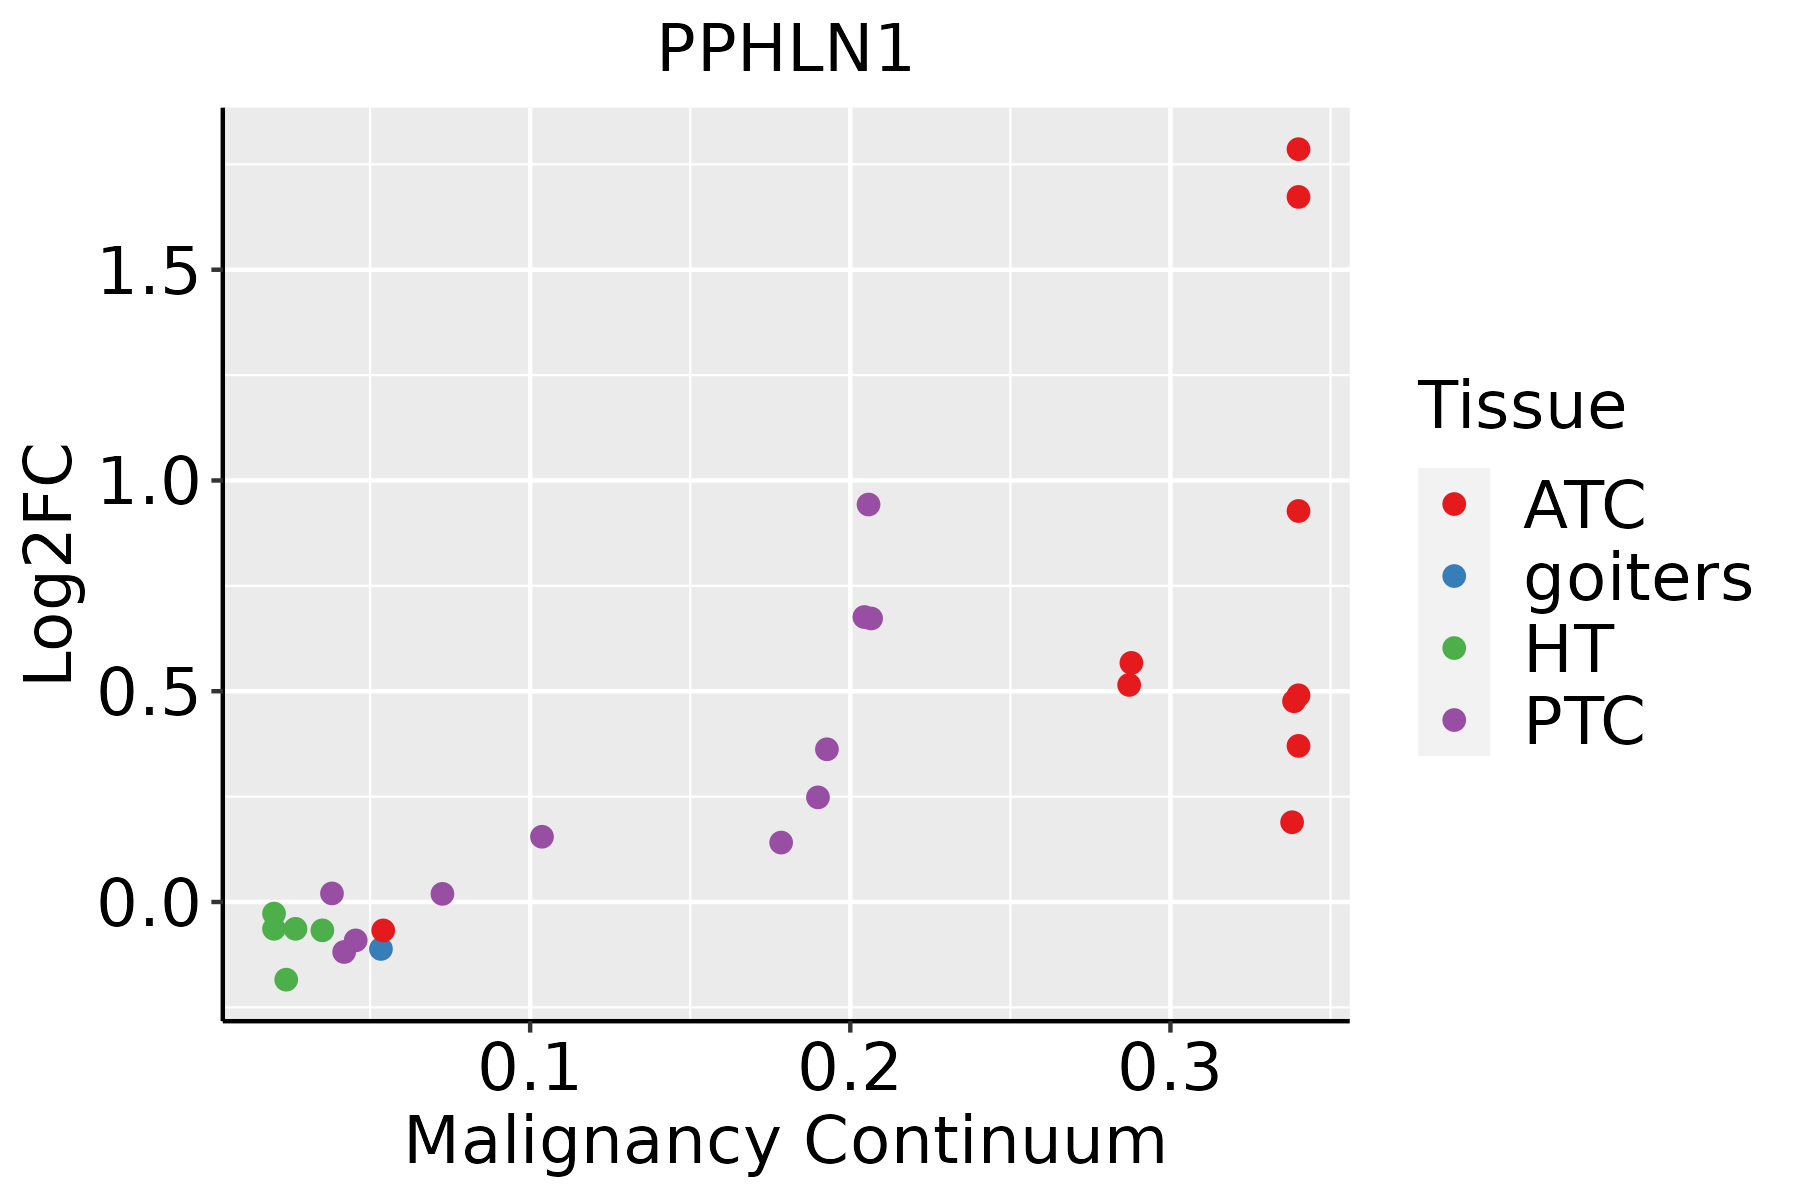 | ATC: Anaplastic thyroid cancer |
| HT: Hashimoto's thyroiditis | ||
| PTC: Papillary thyroid cancer |
| ∗log2FC in expression of this searched gene in stem-like cells from each diseased tissue sample relative to stem-like cells in normal samples in each tissue plotted against the malignancy continuum. Samples are colored based on if they are from different disease stage. |
Top |
Malignant transformation related pathway analysis |
| Find out the enriched GO biological processes and KEGG pathways involved in transition from healthy to precancer to cancer |
| Tissue | Disease Stage | Enriched GO biological Processes |
| Colorectum | AD |  |
| Colorectum | SER |  |
| Colorectum | MSS |  |
| Colorectum | MSI-H |  |
| Colorectum | FAP |  |
| ∗Top 15 enriched GO BP terms are showed in the bar plot of each disease state in each tissue. Each row represents a significant GO biological process which is colored according to the -log10(p.adjust). |
| Page: 1 2 3 4 5 6 7 8 9 |
| GO ID | Tissue | Disease Stage | Description | Gene Ratio | Bg Ratio | pvalue | p.adjust | Count |
| GO:00085441 | Colorectum | FAP | epidermis development | 66/2622 | 324/18723 | 9.63e-04 | 9.51e-03 | 66 |
| GO:00099132 | Colorectum | FAP | epidermal cell differentiation | 42/2622 | 202/18723 | 5.08e-03 | 3.37e-02 | 42 |
| GO:0060968 | Colorectum | FAP | regulation of gene silencing | 20/2622 | 81/18723 | 7.14e-03 | 4.36e-02 | 20 |
| GO:00063254 | Colorectum | CRC | chromatin organization | 74/2078 | 409/18723 | 1.48e-05 | 4.61e-04 | 74 |
| GO:20012525 | Colorectum | CRC | positive regulation of chromosome organization | 21/2078 | 82/18723 | 1.82e-04 | 3.20e-03 | 21 |
| GO:00085442 | Colorectum | CRC | epidermis development | 57/2078 | 324/18723 | 2.88e-04 | 4.59e-03 | 57 |
| GO:00330443 | Colorectum | CRC | regulation of chromosome organization | 37/2078 | 187/18723 | 3.34e-04 | 5.10e-03 | 37 |
| GO:00435881 | Colorectum | CRC | skin development | 47/2078 | 263/18723 | 6.63e-04 | 8.74e-03 | 47 |
| GO:00099133 | Colorectum | CRC | epidermal cell differentiation | 37/2078 | 202/18723 | 1.50e-03 | 1.59e-02 | 37 |
| GO:200125218 | Esophagus | HGIN | positive regulation of chromosome organization | 30/2587 | 82/18723 | 2.00e-07 | 9.68e-06 | 30 |
| GO:00330449 | Esophagus | HGIN | regulation of chromosome organization | 51/2587 | 187/18723 | 8.91e-07 | 3.61e-05 | 51 |
| GO:000632516 | Esophagus | HGIN | chromatin organization | 92/2587 | 409/18723 | 1.05e-06 | 4.16e-05 | 92 |
| GO:00345024 | Esophagus | HGIN | protein localization to chromosome | 24/2587 | 92/18723 | 1.29e-03 | 1.54e-02 | 24 |
| GO:00314533 | Esophagus | HGIN | positive regulation of heterochromatin assembly | 6/2587 | 12/18723 | 3.03e-03 | 2.88e-02 | 6 |
| GO:01202633 | Esophagus | HGIN | positive regulation of heterochromatin organization | 6/2587 | 12/18723 | 3.03e-03 | 2.88e-02 | 6 |
| GO:19052691 | Esophagus | HGIN | positive regulation of chromatin organization | 6/2587 | 13/18723 | 4.97e-03 | 4.18e-02 | 6 |
| GO:003304416 | Esophagus | ESCC | regulation of chromosome organization | 145/8552 | 187/18723 | 3.80e-19 | 4.31e-17 | 145 |
| GO:200125219 | Esophagus | ESCC | positive regulation of chromosome organization | 64/8552 | 82/18723 | 1.98e-09 | 4.52e-08 | 64 |
| GO:003450211 | Esophagus | ESCC | protein localization to chromosome | 70/8552 | 92/18723 | 2.54e-09 | 5.64e-08 | 70 |
| GO:00435888 | Esophagus | ESCC | skin development | 163/8552 | 263/18723 | 6.48e-08 | 1.14e-06 | 163 |
| Page: 1 2 3 4 5 6 7 |
| Pathway ID | Tissue | Disease Stage | Description | Gene Ratio | Bg Ratio | pvalue | p.adjust | qvalue | Count |
| Page: 1 |
Top |
Cell-cell communication analysis |
| Identification of potential cell-cell interactions between two cell types and their ligand-receptor pairs for different disease states |
| Ligand | Receptor | LRpair | Pathway | Tissue | Disease Stage |
| Page: 1 |
Top |
Single-cell gene regulatory network inference analysis |
| Find out the significant the regulons (TFs) and the target genes of each regulon across cell types for different disease states |
| TF | Cell Type | Tissue | Disease Stage | Target Gene | RSS | Regulon Activity |
| ∗The dot plots of a searched regulon are shown for all cell subpopulations in each disease state of each tissue based on the regulon specific score inferred using pySCENIC and by calculating the average expression. |
| Page: 1 |
Top |
Somatic mutation of malignant transformation related genes |
| Annotation of somatic variants for genes involved in malignant transformation |
| Hugo Symbol | Variant Class | Variant Classification | dbSNP RS | HGVSc | HGVSp | HGVSp Short | SWISSPROT | BIOTYPE | SIFT | PolyPhen | Tumor Sample Barcode | Tissue | Histology | Sex | Age | Stage | Therapy Types | Drugs | Outcome |
| PPHLN1 | SNV | Missense_Mutation | c.638N>A | p.Ser213Tyr | p.S213Y | Q8NEY8 | protein_coding | tolerated(0.62) | benign(0.154) | TCGA-A8-A094-01 | Breast | breast invasive carcinoma | Female | >=65 | I/II | Unknown | Unknown | SD | |
| PPHLN1 | SNV | Missense_Mutation | c.1021N>C | p.Ile341Leu | p.I341L | Q8NEY8 | protein_coding | tolerated(0.09) | possibly_damaging(0.705) | TCGA-BH-A0BV-01 | Breast | breast invasive carcinoma | Female | >=65 | I/II | Chemotherapy | doxorubicin | SD | |
| PPHLN1 | SNV | Missense_Mutation | c.784C>A | p.Pro262Thr | p.P262T | Q8NEY8 | protein_coding | deleterious(0) | possibly_damaging(0.577) | TCGA-C8-A26Y-01 | Breast | breast invasive carcinoma | Female | >=65 | I/II | Unknown | Unknown | SD | |
| PPHLN1 | SNV | Missense_Mutation | novel | c.191G>T | p.Gly64Val | p.G64V | Q8NEY8 | protein_coding | deleterious(0) | probably_damaging(0.973) | TCGA-C5-A2LT-01 | Cervix | cervical & endocervical cancer | Female | <65 | I/II | Chemotherapy | cisplatin | SD |
| PPHLN1 | SNV | Missense_Mutation | rs144485658 | c.520N>T | p.Arg174Cys | p.R174C | Q8NEY8 | protein_coding | tolerated(0.06) | possibly_damaging(0.759) | TCGA-AA-3833-01 | Colorectum | colon adenocarcinoma | Female | <65 | I/II | Unknown | Unknown | SD |
| PPHLN1 | SNV | Missense_Mutation | novel | c.807N>T | p.Glu269Asp | p.E269D | Q8NEY8 | protein_coding | deleterious(0.04) | benign(0.401) | TCGA-AA-3950-01 | Colorectum | colon adenocarcinoma | Female | >=65 | I/II | Unknown | Unknown | SD |
| PPHLN1 | SNV | Missense_Mutation | c.1003A>G | p.Arg335Gly | p.R335G | Q8NEY8 | protein_coding | deleterious(0) | probably_damaging(0.999) | TCGA-AA-A02R-01 | Colorectum | colon adenocarcinoma | Female | >=65 | I/II | Unknown | Unknown | PD | |
| PPHLN1 | SNV | Missense_Mutation | c.602C>T | p.Ser201Leu | p.S201L | Q8NEY8 | protein_coding | deleterious(0.01) | possibly_damaging(0.724) | TCGA-NH-A50U-01 | Colorectum | colon adenocarcinoma | Male | <65 | I/II | Ancillary | leucovorin | PD | |
| PPHLN1 | SNV | Missense_Mutation | rs553311483 | c.1139C>T | p.Pro380Leu | p.P380L | Q8NEY8 | protein_coding | tolerated_low_confidence(0.1) | benign(0.001) | TCGA-NH-A5IV-01 | Colorectum | colon adenocarcinoma | Female | >=65 | I/II | Unknown | Unknown | SD |
| PPHLN1 | SNV | Missense_Mutation | c.19N>C | p.Tyr7His | p.Y7H | Q8NEY8 | protein_coding | tolerated(0.16) | probably_damaging(0.996) | TCGA-EI-6507-01 | Colorectum | rectum adenocarcinoma | Male | <65 | I/II | Unknown | Unknown | SD |
| Page: 1 2 3 4 5 |
Top |
Related drugs of malignant transformation related genes |
| Identification of chemicals and drugs interact with genes involved in malignant transfromation |
| (DGIdb 4.0) |
| Entrez ID | Symbol | Category | Interaction Types | Drug Claim Name | Drug Name | PMIDs |
| Page: 1 |

Copyright 2023-Present -The University of Texas Health Science Center at Houston |