
|
|||||
|
 | |
| |
| |
| |
| |
| |
|
Gene: POLD1 |
Gene summary for POLD1 |
| Gene information | Species | Human | Gene symbol | POLD1 | Gene ID | 5424 |
| Gene name | DNA polymerase delta 1, catalytic subunit | |
| Gene Alias | CDC2 | |
| Cytomap | 19q13.33 | |
| Gene Type | protein-coding | GO ID | GO:0000731 | UniProtAcc | A0A024R4F4 |
Top |
Malignant transformation analysis |
| Identification of the aberrant gene expression in precancerous and cancerous lesions by comparing the gene expression of stem-like cells in diseased tissues with normal stem cells |
| Entrez ID | Symbol | Replicates | Species | Organ | Tissue | Adj P-value | Log2FC | Malignancy |
| 5424 | POLD1 | LZE7T | Human | Esophagus | ESCC | 2.93e-07 | 2.31e-01 | 0.0667 |
| 5424 | POLD1 | LZE6T | Human | Esophagus | ESCC | 5.85e-03 | 1.86e-01 | 0.0845 |
| 5424 | POLD1 | P1T-E | Human | Esophagus | ESCC | 3.41e-03 | 1.85e-01 | 0.0875 |
| 5424 | POLD1 | P2T-E | Human | Esophagus | ESCC | 9.56e-08 | 1.77e-01 | 0.1177 |
| 5424 | POLD1 | P4T-E | Human | Esophagus | ESCC | 8.83e-05 | 1.65e-01 | 0.1323 |
| 5424 | POLD1 | P5T-E | Human | Esophagus | ESCC | 7.90e-03 | 9.51e-02 | 0.1327 |
| 5424 | POLD1 | P8T-E | Human | Esophagus | ESCC | 4.44e-08 | 1.86e-01 | 0.0889 |
| 5424 | POLD1 | P10T-E | Human | Esophagus | ESCC | 4.12e-11 | 2.10e-01 | 0.116 |
| 5424 | POLD1 | P11T-E | Human | Esophagus | ESCC | 6.89e-07 | 2.47e-01 | 0.1426 |
| 5424 | POLD1 | P12T-E | Human | Esophagus | ESCC | 4.17e-05 | 1.53e-01 | 0.1122 |
| 5424 | POLD1 | P15T-E | Human | Esophagus | ESCC | 1.13e-07 | 2.28e-01 | 0.1149 |
| 5424 | POLD1 | P16T-E | Human | Esophagus | ESCC | 4.41e-07 | 1.22e-01 | 0.1153 |
| 5424 | POLD1 | P17T-E | Human | Esophagus | ESCC | 2.78e-04 | 2.51e-01 | 0.1278 |
| 5424 | POLD1 | P20T-E | Human | Esophagus | ESCC | 1.87e-03 | 6.32e-02 | 0.1124 |
| 5424 | POLD1 | P21T-E | Human | Esophagus | ESCC | 4.31e-06 | 1.05e-01 | 0.1617 |
| 5424 | POLD1 | P22T-E | Human | Esophagus | ESCC | 8.84e-05 | 1.01e-01 | 0.1236 |
| 5424 | POLD1 | P23T-E | Human | Esophagus | ESCC | 3.27e-09 | 1.30e-01 | 0.108 |
| 5424 | POLD1 | P26T-E | Human | Esophagus | ESCC | 1.76e-12 | 2.29e-01 | 0.1276 |
| 5424 | POLD1 | P27T-E | Human | Esophagus | ESCC | 1.97e-10 | 2.22e-01 | 0.1055 |
| 5424 | POLD1 | P28T-E | Human | Esophagus | ESCC | 9.02e-11 | 1.94e-01 | 0.1149 |
| Page: 1 2 3 4 |
| Tissue | Expression Dynamics | Abbreviation |
| Esophagus | 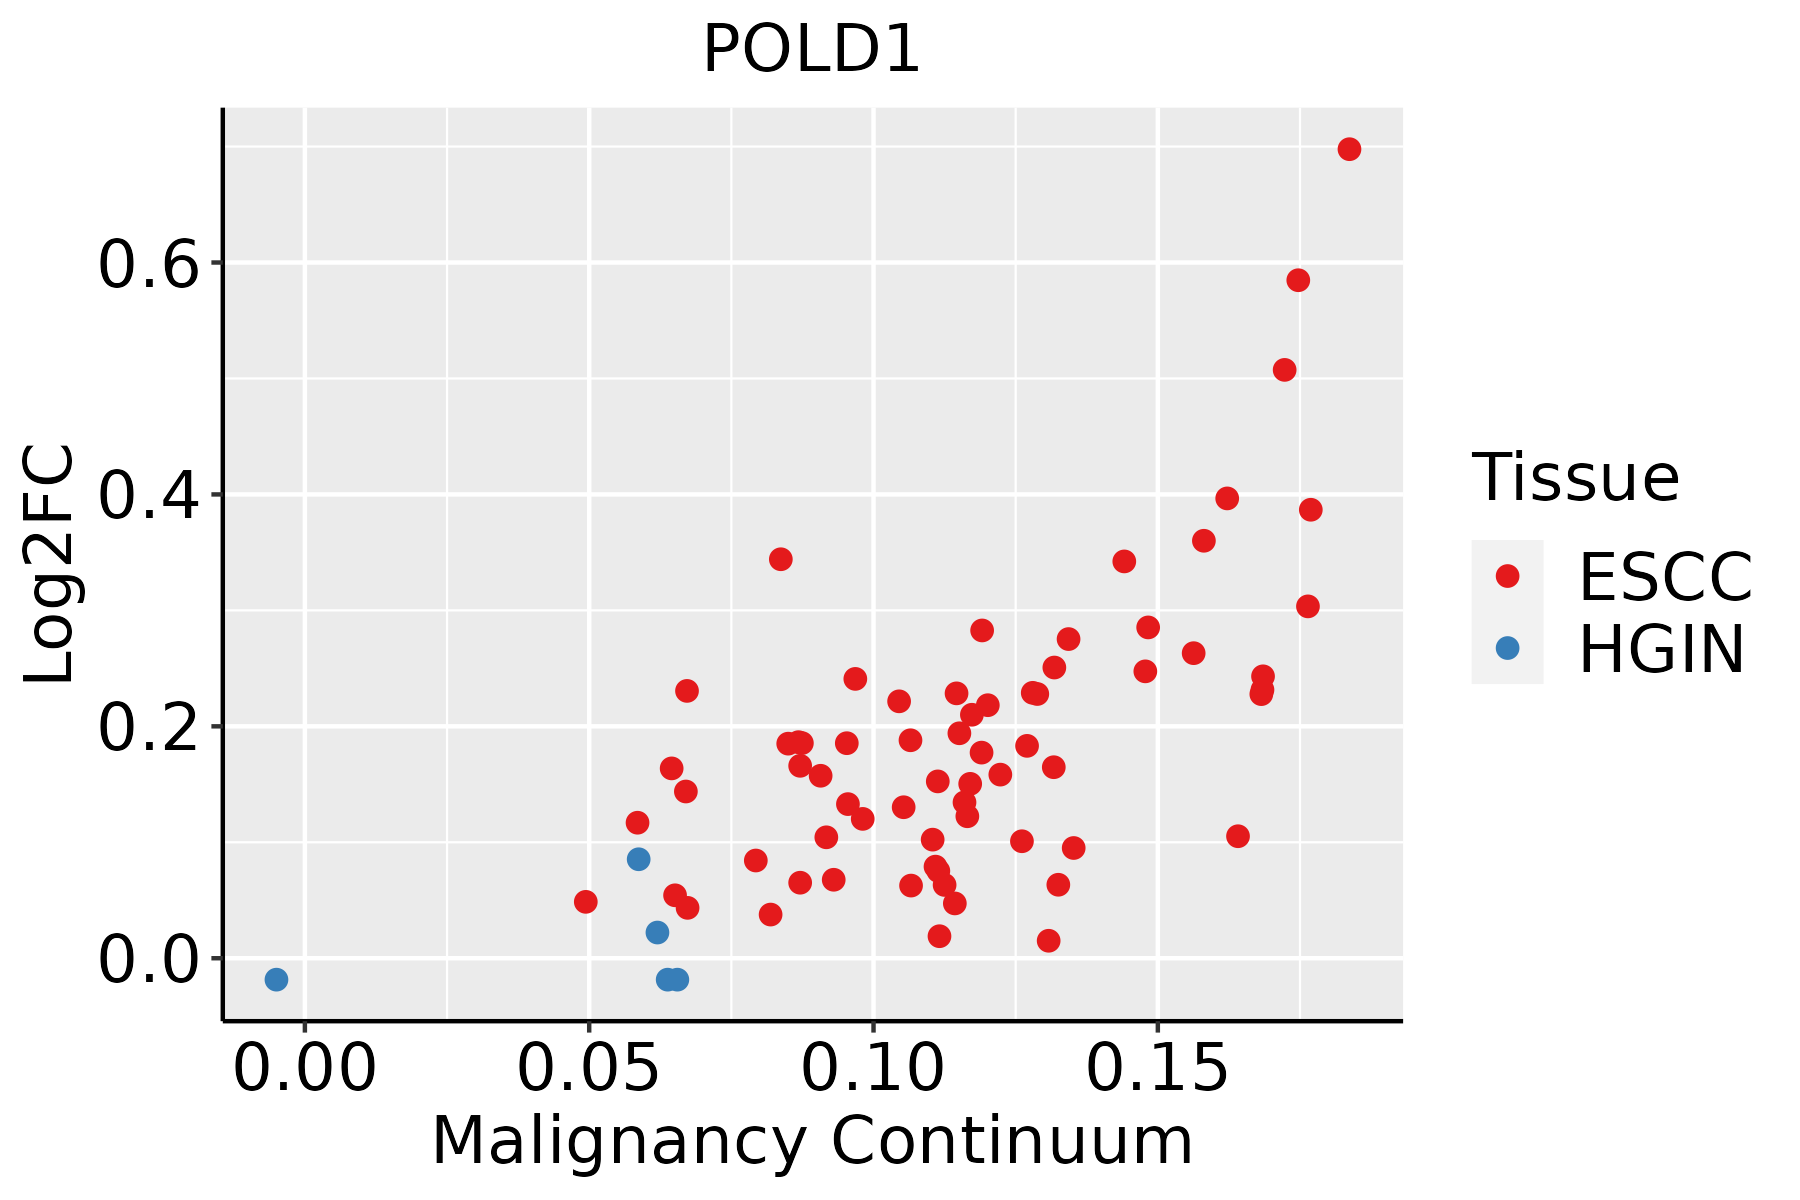 | ESCC: Esophageal squamous cell carcinoma |
| HGIN: High-grade intraepithelial neoplasias | ||
| LGIN: Low-grade intraepithelial neoplasias | ||
| Oral Cavity | 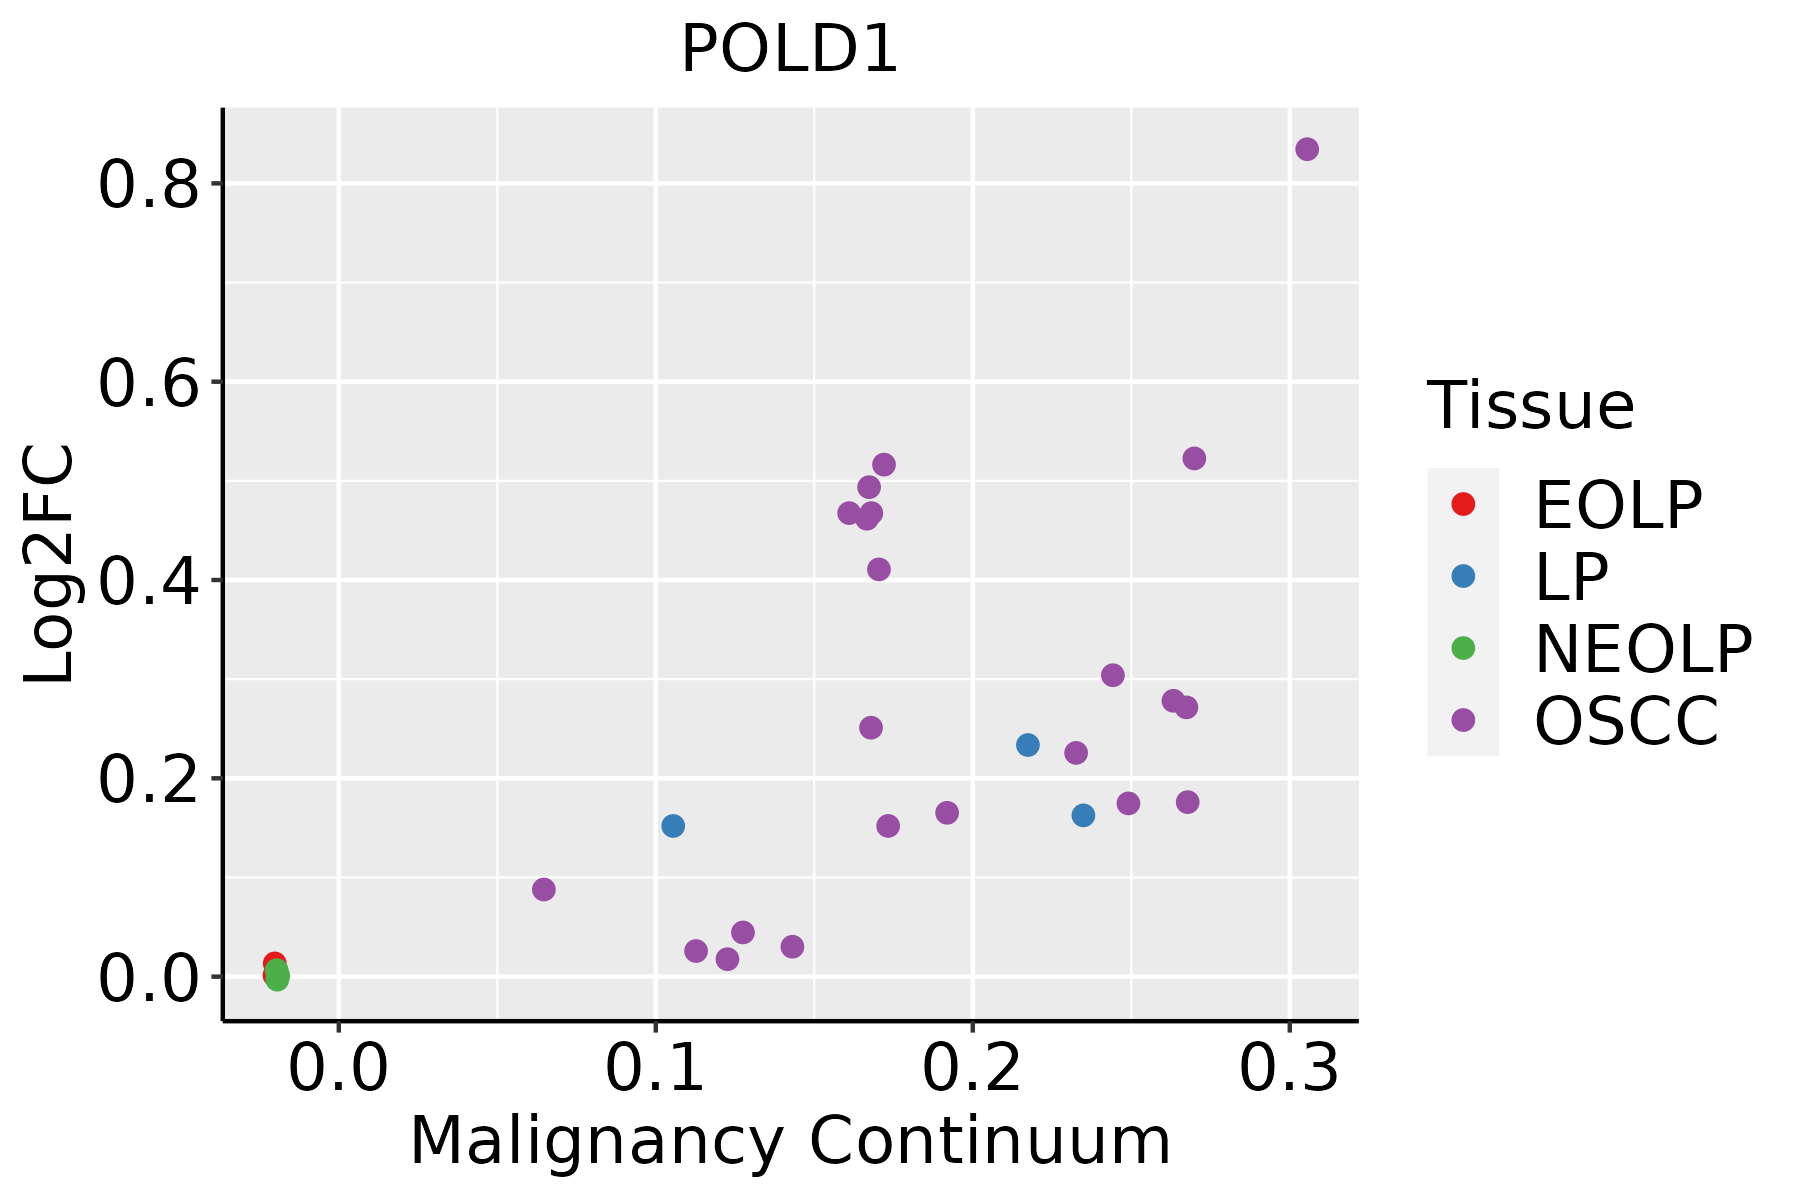 | EOLP: Erosive Oral lichen planus |
| LP: leukoplakia | ||
| NEOLP: Non-erosive oral lichen planus | ||
| OSCC: Oral squamous cell carcinoma |
| ∗log2FC in expression of this searched gene in stem-like cells from each diseased tissue sample relative to stem-like cells in normal samples in each tissue plotted against the malignancy continuum. Samples are colored based on if they are from different disease stage. |
Top |
Malignant transformation related pathway analysis |
| Find out the enriched GO biological processes and KEGG pathways involved in transition from healthy to precancer to cancer |
| Tissue | Disease Stage | Enriched GO biological Processes |
| Colorectum | AD |  |
| Colorectum | SER |  |
| Colorectum | MSS |  |
| Colorectum | MSI-H |  |
| Colorectum | FAP |  |
| ∗Top 15 enriched GO BP terms are showed in the bar plot of each disease state in each tissue. Each row represents a significant GO biological process which is colored according to the -log10(p.adjust). |
| Page: 1 2 3 4 5 6 7 8 9 |
| GO ID | Tissue | Disease Stage | Description | Gene Ratio | Bg Ratio | pvalue | p.adjust | Count |
| GO:00031583 | Colorectum | FAP | endothelium development | 32/2622 | 136/18723 | 1.89e-03 | 1.61e-02 | 32 |
| GO:00108762 | Colorectum | FAP | lipid localization | 85/2622 | 448/18723 | 1.92e-03 | 1.63e-02 | 85 |
| GO:00454462 | Colorectum | FAP | endothelial cell differentiation | 28/2622 | 118/18723 | 3.09e-03 | 2.32e-02 | 28 |
| GO:0042118 | Colorectum | FAP | endothelial cell activation | 6/2622 | 12/18723 | 3.24e-03 | 2.40e-02 | 6 |
| GO:0045601 | Colorectum | FAP | regulation of endothelial cell differentiation | 14/2622 | 47/18723 | 3.95e-03 | 2.75e-02 | 14 |
| GO:00016664 | Colorectum | CRC | response to hypoxia | 51/2078 | 307/18723 | 2.14e-03 | 2.10e-02 | 51 |
| GO:00068692 | Colorectum | CRC | lipid transport | 63/2078 | 398/18723 | 2.36e-03 | 2.26e-02 | 63 |
| GO:00704824 | Colorectum | CRC | response to oxygen levels | 56/2078 | 347/18723 | 2.60e-03 | 2.40e-02 | 56 |
| GO:00308561 | Colorectum | CRC | regulation of epithelial cell differentiation | 29/2078 | 154/18723 | 3.02e-03 | 2.71e-02 | 29 |
| GO:00031584 | Colorectum | CRC | endothelium development | 26/2078 | 136/18723 | 3.91e-03 | 3.24e-02 | 26 |
| GO:00108763 | Colorectum | CRC | lipid localization | 68/2078 | 448/18723 | 4.60e-03 | 3.58e-02 | 68 |
| GO:00454463 | Colorectum | CRC | endothelial cell differentiation | 23/2078 | 118/18723 | 5.01e-03 | 3.85e-02 | 23 |
| GO:00362933 | Colorectum | CRC | response to decreased oxygen levels | 51/2078 | 322/18723 | 5.72e-03 | 4.28e-02 | 51 |
| GO:00421181 | Colorectum | CRC | endothelial cell activation | 5/2078 | 12/18723 | 6.79e-03 | 4.77e-02 | 5 |
| GO:000941113 | Esophagus | ESCC | response to UV | 115/8552 | 149/18723 | 3.29e-15 | 1.93e-13 | 115 |
| GO:00062604 | Esophagus | ESCC | DNA replication | 181/8552 | 260/18723 | 3.55e-15 | 2.05e-13 | 181 |
| GO:007189716 | Esophagus | ESCC | DNA biosynthetic process | 127/8552 | 180/18723 | 1.04e-11 | 3.85e-10 | 127 |
| GO:000931419 | Esophagus | ESCC | response to radiation | 277/8552 | 456/18723 | 4.42e-11 | 1.43e-09 | 277 |
| GO:003464413 | Esophagus | ESCC | cellular response to UV | 70/8552 | 90/18723 | 4.59e-10 | 1.20e-08 | 70 |
| GO:007121419 | Esophagus | ESCC | cellular response to abiotic stimulus | 206/8552 | 331/18723 | 7.52e-10 | 1.88e-08 | 206 |
| Page: 1 2 3 4 |
| Pathway ID | Tissue | Disease Stage | Description | Gene Ratio | Bg Ratio | pvalue | p.adjust | qvalue | Count |
| hsa0342022 | Esophagus | ESCC | Nucleotide excision repair | 54/4205 | 63/8465 | 2.01e-09 | 2.17e-08 | 1.11e-08 | 54 |
| hsa034104 | Esophagus | ESCC | Base excision repair | 38/4205 | 44/8465 | 3.59e-07 | 2.62e-06 | 1.34e-06 | 38 |
| hsa030304 | Esophagus | ESCC | DNA replication | 32/4205 | 36/8465 | 7.71e-07 | 5.06e-06 | 2.59e-06 | 32 |
| hsa034304 | Esophagus | ESCC | Mismatch repair | 21/4205 | 23/8465 | 2.85e-05 | 1.35e-04 | 6.90e-05 | 21 |
| hsa0342032 | Esophagus | ESCC | Nucleotide excision repair | 54/4205 | 63/8465 | 2.01e-09 | 2.17e-08 | 1.11e-08 | 54 |
| hsa0341011 | Esophagus | ESCC | Base excision repair | 38/4205 | 44/8465 | 3.59e-07 | 2.62e-06 | 1.34e-06 | 38 |
| hsa0303011 | Esophagus | ESCC | DNA replication | 32/4205 | 36/8465 | 7.71e-07 | 5.06e-06 | 2.59e-06 | 32 |
| hsa0343011 | Esophagus | ESCC | Mismatch repair | 21/4205 | 23/8465 | 2.85e-05 | 1.35e-04 | 6.90e-05 | 21 |
| hsa034204 | Oral cavity | OSCC | Nucleotide excision repair | 49/3704 | 63/8465 | 3.48e-08 | 2.91e-07 | 1.48e-07 | 49 |
| hsa03030 | Oral cavity | OSCC | DNA replication | 31/3704 | 36/8465 | 1.70e-07 | 1.19e-06 | 6.03e-07 | 31 |
| hsa03410 | Oral cavity | OSCC | Base excision repair | 32/3704 | 44/8465 | 9.11e-05 | 3.25e-04 | 1.65e-04 | 32 |
| hsa03430 | Oral cavity | OSCC | Mismatch repair | 19/3704 | 23/8465 | 1.55e-04 | 5.34e-04 | 2.72e-04 | 19 |
| hsa0342011 | Oral cavity | OSCC | Nucleotide excision repair | 49/3704 | 63/8465 | 3.48e-08 | 2.91e-07 | 1.48e-07 | 49 |
| hsa030301 | Oral cavity | OSCC | DNA replication | 31/3704 | 36/8465 | 1.70e-07 | 1.19e-06 | 6.03e-07 | 31 |
| hsa034101 | Oral cavity | OSCC | Base excision repair | 32/3704 | 44/8465 | 9.11e-05 | 3.25e-04 | 1.65e-04 | 32 |
| hsa034301 | Oral cavity | OSCC | Mismatch repair | 19/3704 | 23/8465 | 1.55e-04 | 5.34e-04 | 2.72e-04 | 19 |
| Page: 1 |
Top |
Cell-cell communication analysis |
| Identification of potential cell-cell interactions between two cell types and their ligand-receptor pairs for different disease states |
| Ligand | Receptor | LRpair | Pathway | Tissue | Disease Stage |
| Page: 1 |
Top |
Single-cell gene regulatory network inference analysis |
| Find out the significant the regulons (TFs) and the target genes of each regulon across cell types for different disease states |
| TF | Cell Type | Tissue | Disease Stage | Target Gene | RSS | Regulon Activity |
| ∗The dot plots of a searched regulon are shown for all cell subpopulations in each disease state of each tissue based on the regulon specific score inferred using pySCENIC and by calculating the average expression. |
| Page: 1 |
Top |
Somatic mutation of malignant transformation related genes |
| Annotation of somatic variants for genes involved in malignant transformation |
| Hugo Symbol | Variant Class | Variant Classification | dbSNP RS | HGVSc | HGVSp | HGVSp Short | SWISSPROT | BIOTYPE | SIFT | PolyPhen | Tumor Sample Barcode | Tissue | Histology | Sex | Age | Stage | Therapy Types | Drugs | Outcome |
| POLD1 | SNV | Missense_Mutation | rs371612922 | c.934N>A | p.Val312Met | p.V312M | protein_coding | deleterious(0) | possibly_damaging(0.641) | TCGA-A2-A04T-01 | Breast | breast invasive carcinoma | Female | <65 | I/II | Chemotherapy | cyclophosphamide | SD | |
| POLD1 | SNV | Missense_Mutation | c.1425N>A | p.Asn475Lys | p.N475K | protein_coding | deleterious(0) | probably_damaging(0.928) | TCGA-BH-A0HK-01 | Breast | breast invasive carcinoma | Female | >=65 | I/II | Hormone Therapy | arimidex | SD | ||
| POLD1 | SNV | Missense_Mutation | c.1197N>C | p.Gln399His | p.Q399H | protein_coding | tolerated(0.18) | benign(0.326) | TCGA-E2-A158-01 | Breast | breast invasive carcinoma | Female | <65 | I/II | Chemotherapy | arimidex | SD | ||
| POLD1 | SNV | Missense_Mutation | rs201010746 | c.931C>T | p.Arg311Cys | p.R311C | protein_coding | deleterious(0) | probably_damaging(0.97) | TCGA-E9-A1NA-01 | Breast | breast invasive carcinoma | Female | <65 | I/II | Chemotherapy | cyclophosphamide | SD | |
| POLD1 | deletion | Frame_Shift_Del | rs761614971 | c.3383delC | p.Pro1128LeufsTer22 | p.P1128Lfs*22 | protein_coding | TCGA-A2-A04U-01 | Breast | breast invasive carcinoma | Female | <65 | I/II | Chemotherapy | adriamycin | SD | |||
| POLD1 | SNV | Missense_Mutation | rs372299975 | c.379N>A | p.Ala127Thr | p.A127T | protein_coding | deleterious(0) | benign(0.125) | TCGA-2W-A8YY-01 | Cervix | cervical & endocervical cancer | Female | <65 | I/II | Chemotherapy | cisplatin | CR | |
| POLD1 | SNV | Missense_Mutation | rs762494977 | c.1027N>T | p.Arg343Cys | p.R343C | protein_coding | tolerated(0.08) | benign(0.087) | TCGA-2W-A8YY-01 | Cervix | cervical & endocervical cancer | Female | <65 | I/II | Chemotherapy | cisplatin | CR | |
| POLD1 | SNV | Missense_Mutation | rs778135510 | c.1225N>T | p.Arg409Trp | p.R409W | protein_coding | deleterious(0) | probably_damaging(1) | TCGA-C5-A3HD-01 | Cervix | cervical & endocervical cancer | Female | <65 | I/II | Chemotherapy | cisplatin | SD | |
| POLD1 | SNV | Missense_Mutation | rs140707092 | c.532N>T | p.Gly178Trp | p.G178W | protein_coding | deleterious(0) | probably_damaging(0.959) | TCGA-FU-A3WB-01 | Cervix | cervical & endocervical cancer | Female | <65 | I/II | Chemotherapy | cisplatin | CR | |
| POLD1 | SNV | Missense_Mutation | novel | c.176N>T | p.Gln59Leu | p.Q59L | protein_coding | tolerated(0.16) | possibly_damaging(0.775) | TCGA-IR-A3LL-01 | Cervix | cervical & endocervical cancer | Female | <65 | I/II | Chemotherapy | cisplatin | CR |
| Page: 1 2 3 4 5 6 7 8 9 10 11 12 |
Top |
Related drugs of malignant transformation related genes |
| Identification of chemicals and drugs interact with genes involved in malignant transfromation |
| (DGIdb 4.0) |
| Entrez ID | Symbol | Category | Interaction Types | Drug Claim Name | Drug Name | PMIDs |
| 5424 | POLD1 | DNA DIRECTED RNA POLYMERASE, DRUGGABLE GENOME, CLINICALLY ACTIONABLE, DNA REPAIR, ENZYME | inhibitor | CHEMBL1637 | GEMCITABINE HYDROCHLORIDE | |
| 5424 | POLD1 | DNA DIRECTED RNA POLYMERASE, DRUGGABLE GENOME, CLINICALLY ACTIONABLE, DNA REPAIR, ENZYME | inhibitor | CHEMBL1750 | CLOFARABINE | |
| 5424 | POLD1 | DNA DIRECTED RNA POLYMERASE, DRUGGABLE GENOME, CLINICALLY ACTIONABLE, DNA REPAIR, ENZYME | inhibitor | CHEMBL803 | CYTARABINE | |
| 5424 | POLD1 | DNA DIRECTED RNA POLYMERASE, DRUGGABLE GENOME, CLINICALLY ACTIONABLE, DNA REPAIR, ENZYME | HYMENOIC ACID | HYMENOIC ACID | 18364258 | |
| 5424 | POLD1 | DNA DIRECTED RNA POLYMERASE, DRUGGABLE GENOME, CLINICALLY ACTIONABLE, DNA REPAIR, ENZYME | inhibitor | CHEMBL1096882 | FLUDARABINE PHOSPHATE |
| Page: 1 |

Copyright 2023-Present -The University of Texas Health Science Center at Houston |