
|
|||||
|
 | |
| |
| |
| |
| |
| |
|
Gene: PLSCR1 |
Gene summary for PLSCR1 |
| Gene information | Species | Human | Gene symbol | PLSCR1 | Gene ID | 5359 |
| Gene name | phospholipid scramblase 1 | |
| Gene Alias | MMTRA1B | |
| Cytomap | 3q24 | |
| Gene Type | protein-coding | GO ID | GO:0001775 | UniProtAcc | O15162 |
Top |
Malignant transformation analysis |
| Identification of the aberrant gene expression in precancerous and cancerous lesions by comparing the gene expression of stem-like cells in diseased tissues with normal stem cells |
| Entrez ID | Symbol | Replicates | Species | Organ | Tissue | Adj P-value | Log2FC | Malignancy |
| 5359 | PLSCR1 | CA_HPV_1 | Human | Cervix | CC | 1.12e-05 | 3.42e-01 | 0.0264 |
| 5359 | PLSCR1 | CA_HPV_2 | Human | Cervix | CC | 2.97e-07 | 3.55e-01 | 0.0391 |
| 5359 | PLSCR1 | HSIL_HPV_2 | Human | Cervix | HSIL_HPV | 2.24e-04 | 2.52e-01 | 0.0208 |
| 5359 | PLSCR1 | CCI_2 | Human | Cervix | CC | 1.67e-14 | 2.08e+00 | 0.5249 |
| 5359 | PLSCR1 | CCI_3 | Human | Cervix | CC | 5.22e-03 | 6.56e-01 | 0.516 |
| 5359 | PLSCR1 | Tumor | Human | Cervix | CC | 3.75e-37 | 7.32e-01 | 0.1241 |
| 5359 | PLSCR1 | sample3 | Human | Cervix | CC | 1.51e-48 | 8.09e-01 | 0.1387 |
| 5359 | PLSCR1 | H2 | Human | Cervix | HSIL_HPV | 9.92e-05 | 2.74e-01 | 0.0632 |
| 5359 | PLSCR1 | T3 | Human | Cervix | CC | 3.37e-46 | 8.09e-01 | 0.1389 |
| 5359 | PLSCR1 | HTA11_3410_2000001011 | Human | Colorectum | AD | 4.33e-11 | -5.09e-01 | 0.0155 |
| 5359 | PLSCR1 | HTA11_696_2000001011 | Human | Colorectum | AD | 1.30e-05 | -4.14e-01 | -0.1464 |
| 5359 | PLSCR1 | HTA11_866_2000001011 | Human | Colorectum | AD | 3.20e-02 | -3.08e-01 | -0.1001 |
| 5359 | PLSCR1 | HTA11_10711_2000001011 | Human | Colorectum | AD | 3.12e-03 | -4.89e-01 | 0.0338 |
| 5359 | PLSCR1 | HTA11_7696_3000711011 | Human | Colorectum | AD | 1.50e-05 | -3.64e-01 | 0.0674 |
| 5359 | PLSCR1 | HTA11_99999974143_84620 | Human | Colorectum | MSS | 5.30e-11 | -4.83e-01 | 0.3005 |
| 5359 | PLSCR1 | F007 | Human | Colorectum | FAP | 1.35e-06 | -5.09e-01 | 0.1176 |
| 5359 | PLSCR1 | A001-C-207 | Human | Colorectum | FAP | 3.54e-02 | -2.79e-01 | 0.1278 |
| 5359 | PLSCR1 | A015-C-203 | Human | Colorectum | FAP | 9.96e-21 | -3.69e-01 | -0.1294 |
| 5359 | PLSCR1 | A015-C-204 | Human | Colorectum | FAP | 7.17e-06 | -3.95e-01 | -0.0228 |
| 5359 | PLSCR1 | A014-C-040 | Human | Colorectum | FAP | 1.98e-03 | -5.14e-01 | -0.1184 |
| Page: 1 2 3 4 5 6 7 8 9 |
| Tissue | Expression Dynamics | Abbreviation |
| Cervix | 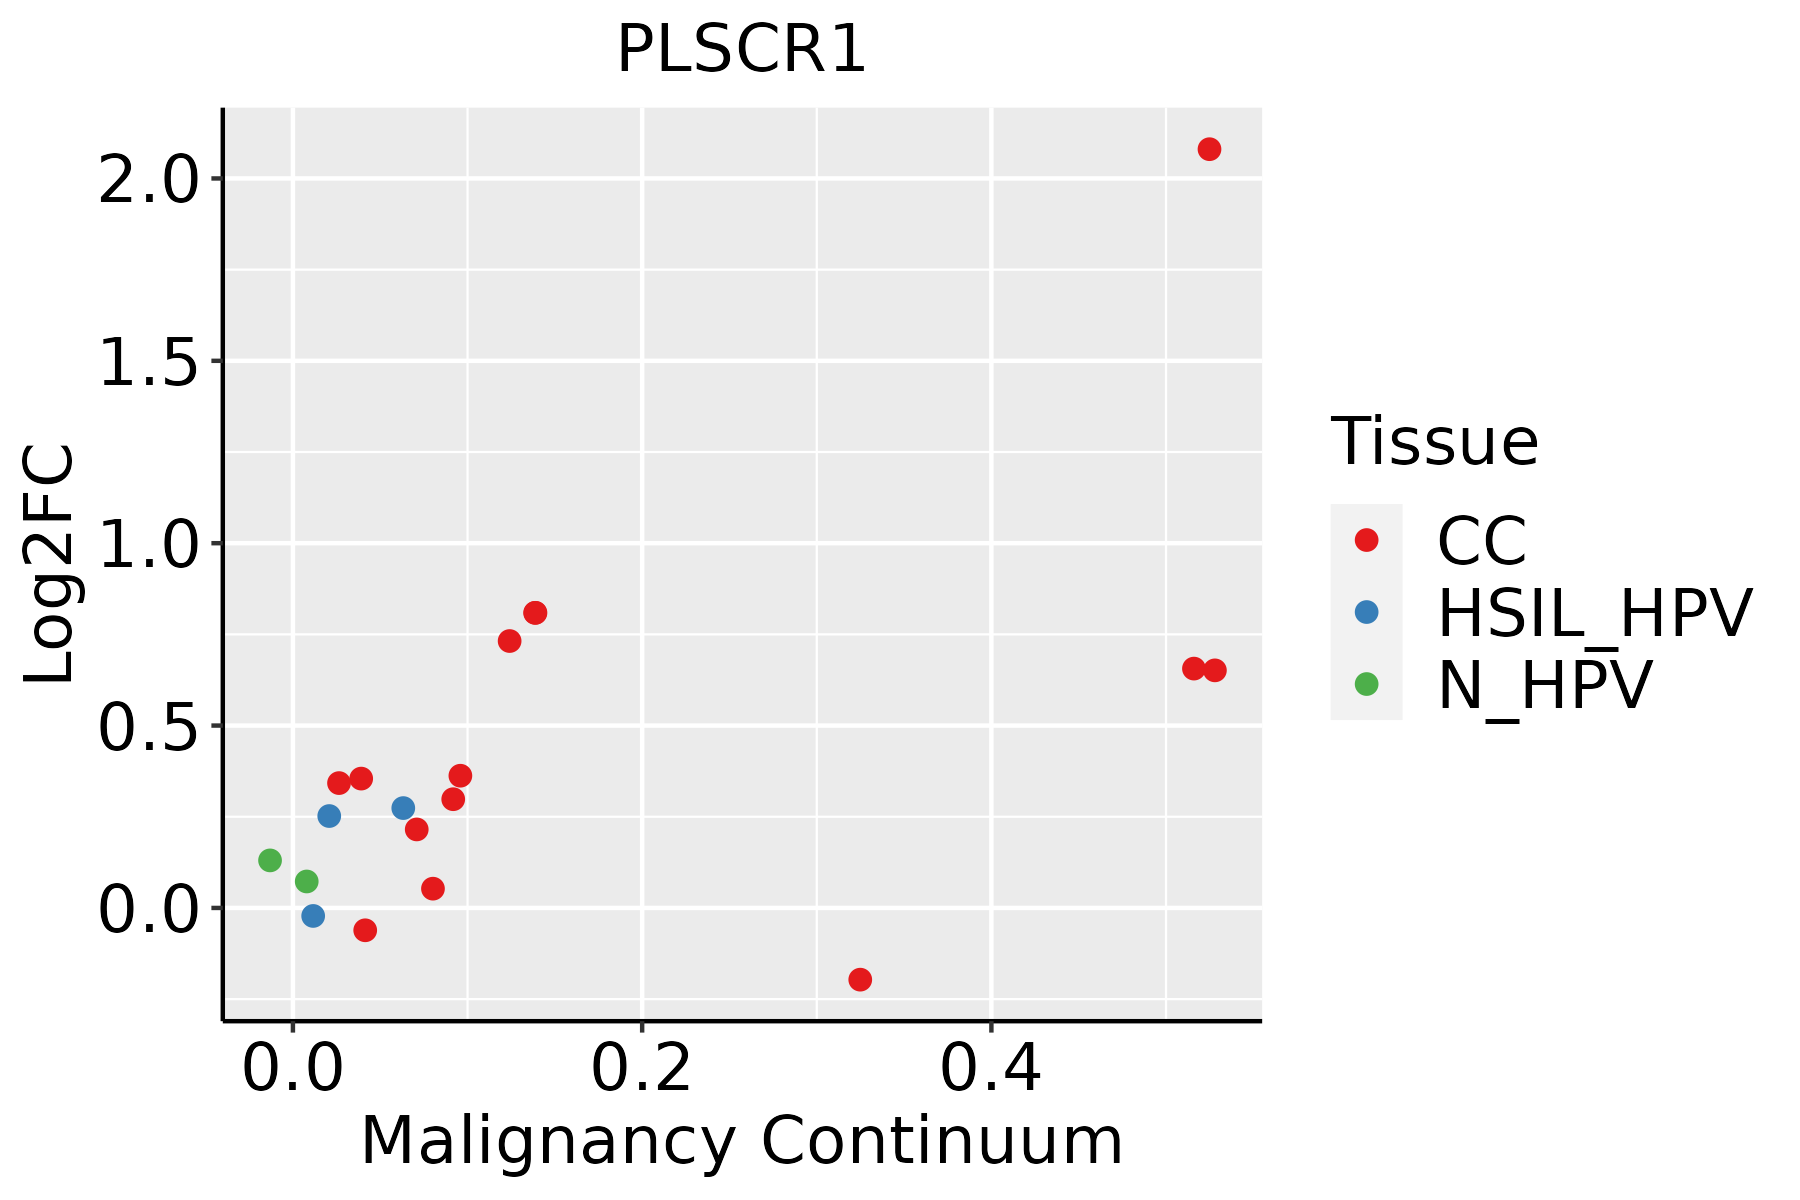 | CC: Cervix cancer |
| HSIL_HPV: HPV-infected high-grade squamous intraepithelial lesions | ||
| N_HPV: HPV-infected normal cervix | ||
| Colorectum (GSE201348) |  | FAP: Familial adenomatous polyposis |
| CRC: Colorectal cancer | ||
| Colorectum (HTA11) |  | AD: Adenomas |
| SER: Sessile serrated lesions | ||
| MSI-H: Microsatellite-high colorectal cancer | ||
| MSS: Microsatellite stable colorectal cancer | ||
| Esophagus | 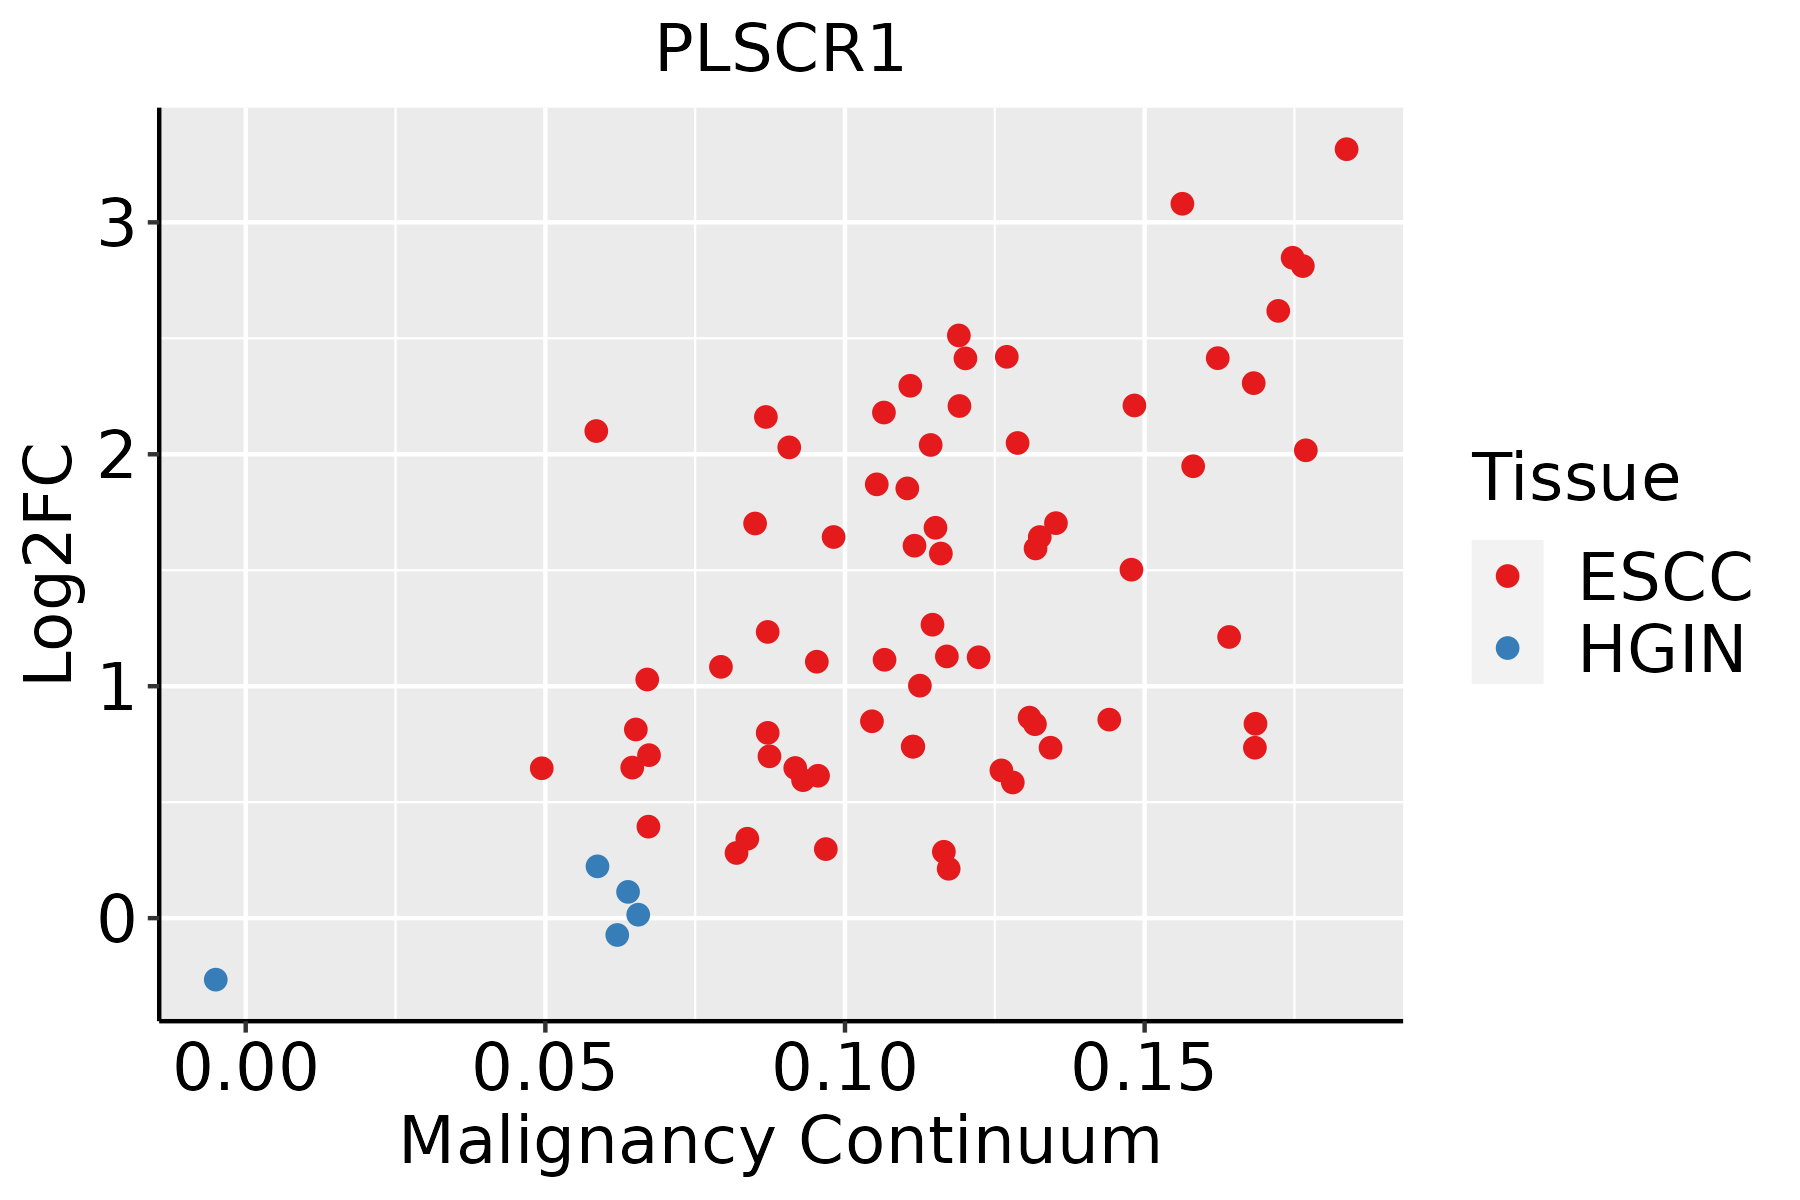 | ESCC: Esophageal squamous cell carcinoma |
| HGIN: High-grade intraepithelial neoplasias | ||
| LGIN: Low-grade intraepithelial neoplasias | ||
| Liver |  | HCC: Hepatocellular carcinoma |
| NAFLD: Non-alcoholic fatty liver disease | ||
| Lung | 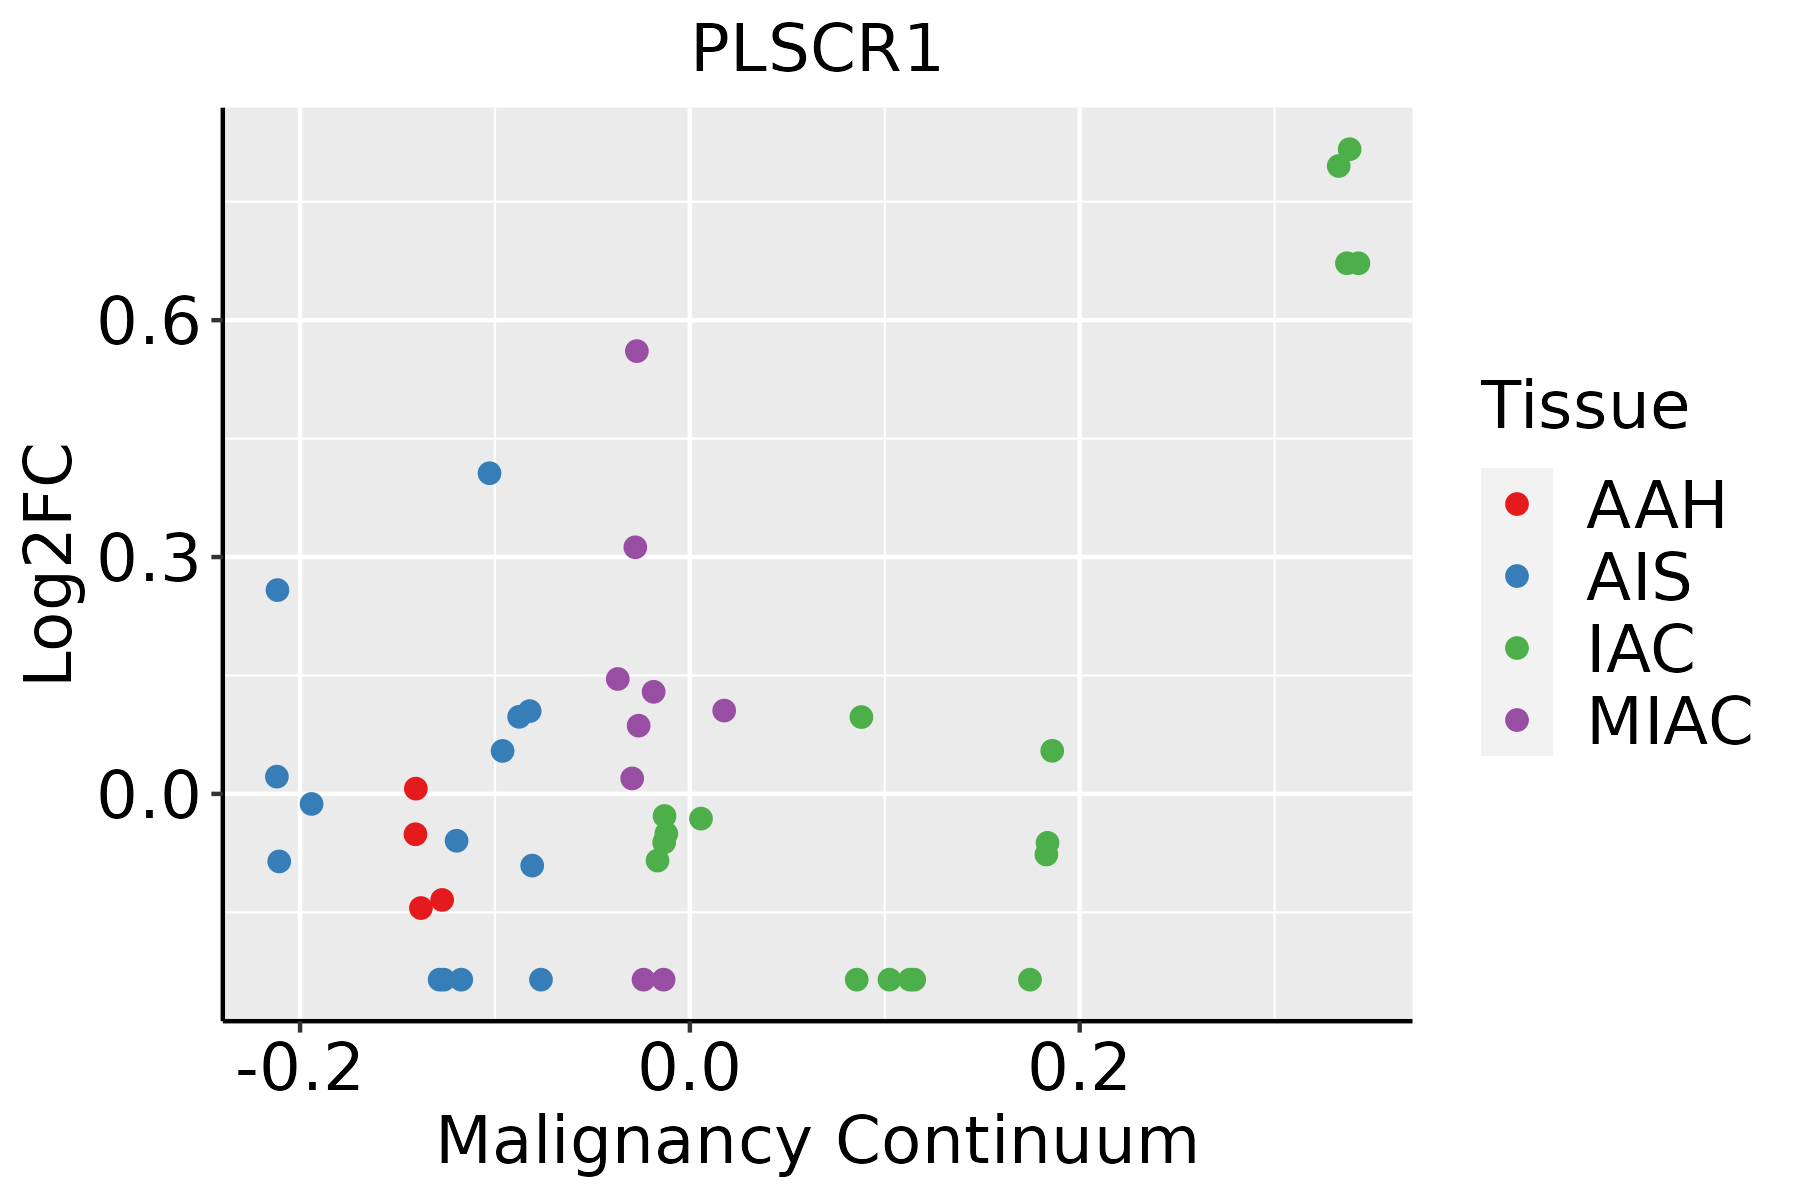 | AAH: Atypical adenomatous hyperplasia |
| AIS: Adenocarcinoma in situ | ||
| IAC: Invasive lung adenocarcinoma | ||
| MIA: Minimally invasive adenocarcinoma | ||
| Oral Cavity |  | EOLP: Erosive Oral lichen planus |
| LP: leukoplakia | ||
| NEOLP: Non-erosive oral lichen planus | ||
| OSCC: Oral squamous cell carcinoma | ||
| Skin | 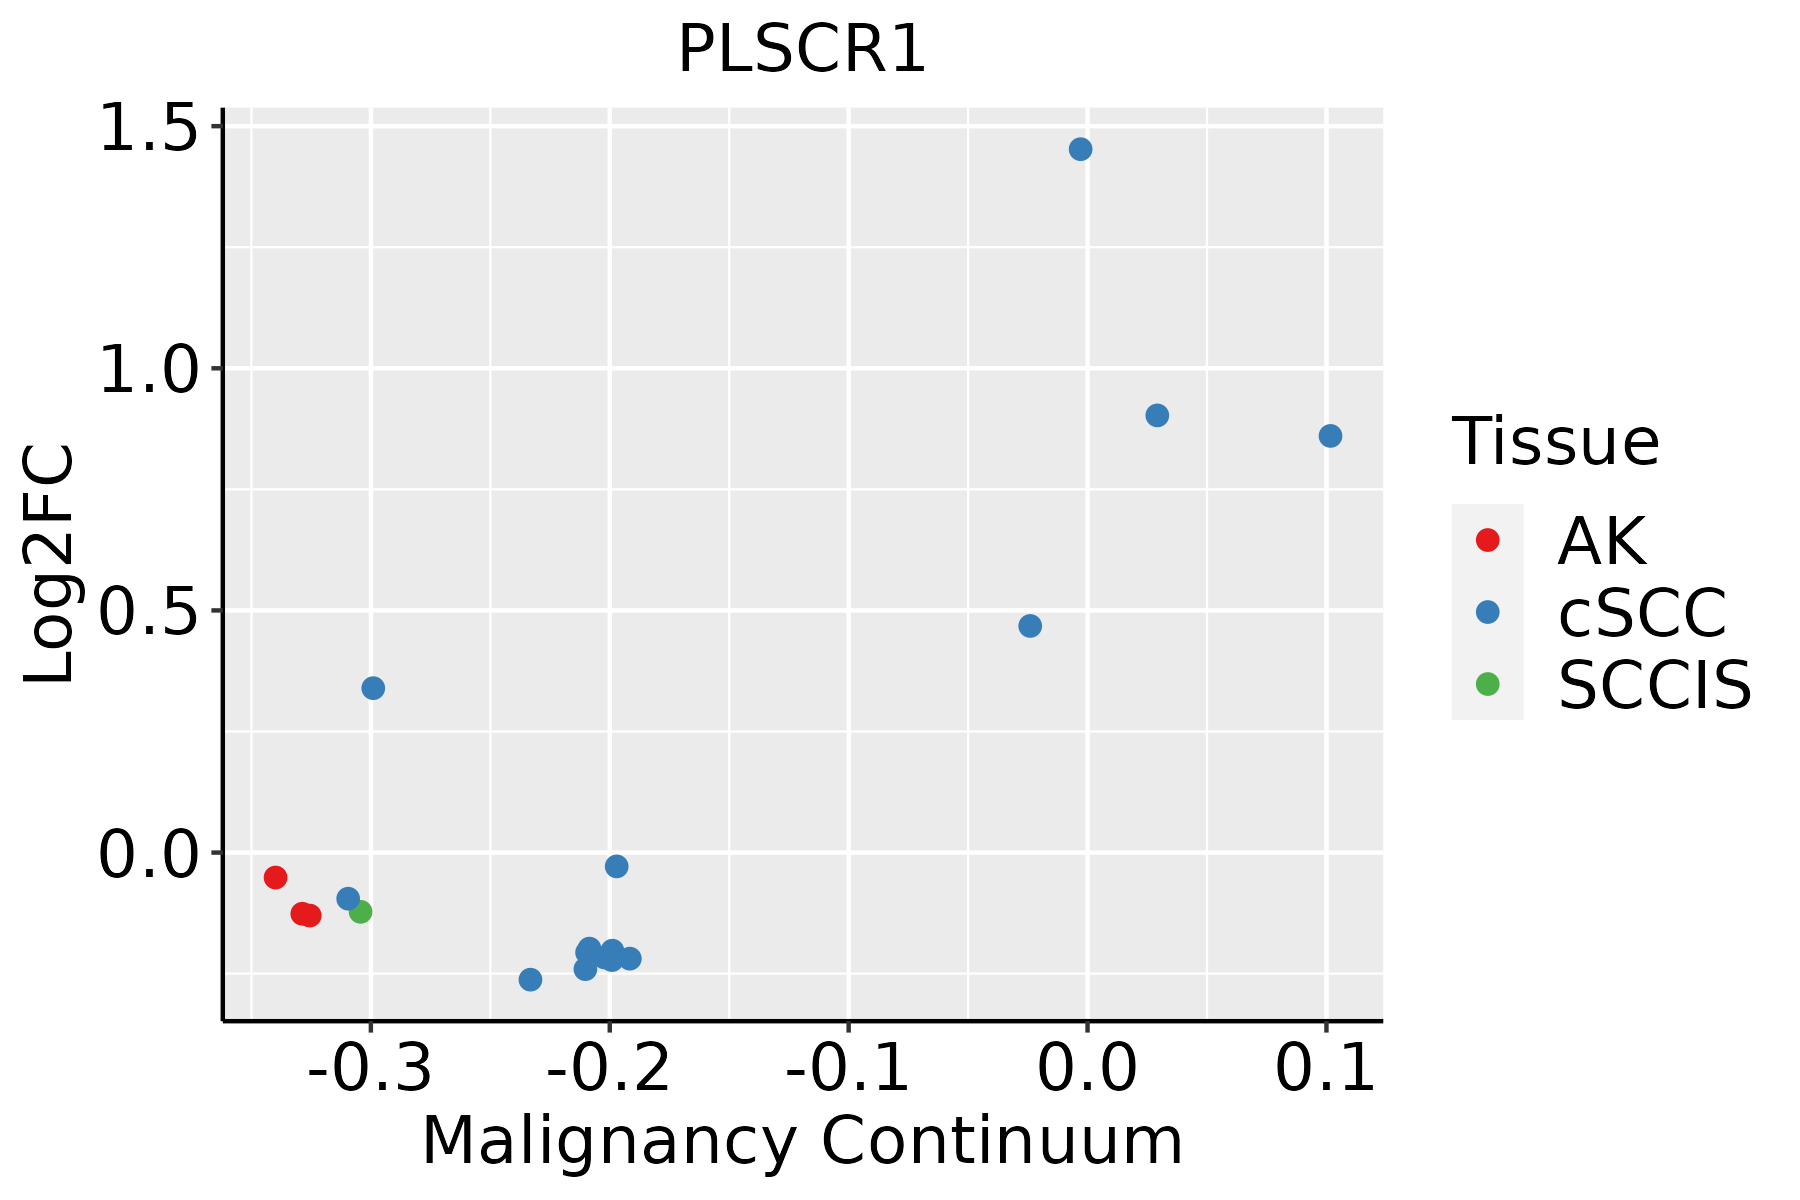 | AK: Actinic keratosis |
| cSCC: Cutaneous squamous cell carcinoma | ||
| SCCIS:squamous cell carcinoma in situ | ||
| Thyroid |  | ATC: Anaplastic thyroid cancer |
| HT: Hashimoto's thyroiditis | ||
| PTC: Papillary thyroid cancer |
| ∗log2FC in expression of this searched gene in stem-like cells from each diseased tissue sample relative to stem-like cells in normal samples in each tissue plotted against the malignancy continuum. Samples are colored based on if they are from different disease stage. |
Top |
Malignant transformation related pathway analysis |
| Find out the enriched GO biological processes and KEGG pathways involved in transition from healthy to precancer to cancer |
| Tissue | Disease Stage | Enriched GO biological Processes |
| Colorectum | AD |  |
| Colorectum | SER |  |
| Colorectum | MSS |  |
| Colorectum | MSI-H |  |
| Colorectum | FAP |  |
| ∗Top 15 enriched GO BP terms are showed in the bar plot of each disease state in each tissue. Each row represents a significant GO biological process which is colored according to the -log10(p.adjust). |
| Page: 1 2 3 4 5 6 7 8 9 |
| GO ID | Tissue | Disease Stage | Description | Gene Ratio | Bg Ratio | pvalue | p.adjust | Count |
| GO:190390010 | Cervix | CC | regulation of viral life cycle | 33/2311 | 148/18723 | 4.86e-04 | 4.76e-03 | 33 |
| GO:00508176 | Cervix | CC | coagulation | 45/2311 | 222/18723 | 5.08e-04 | 4.94e-03 | 45 |
| GO:00075966 | Cervix | CC | blood coagulation | 44/2311 | 217/18723 | 5.78e-04 | 5.52e-03 | 44 |
| GO:00485256 | Cervix | CC | negative regulation of viral process | 23/2311 | 92/18723 | 6.39e-04 | 5.97e-03 | 23 |
| GO:00450882 | Cervix | CC | regulation of innate immune response | 44/2311 | 218/18723 | 6.40e-04 | 5.97e-03 | 44 |
| GO:0002768 | Cervix | CC | immune response-regulating cell surface receptor signaling pathway | 59/2311 | 315/18723 | 6.64e-04 | 6.11e-03 | 59 |
| GO:00301682 | Cervix | CC | platelet activation | 28/2311 | 123/18723 | 8.92e-04 | 7.71e-03 | 28 |
| GO:00075996 | Cervix | CC | hemostasis | 44/2311 | 222/18723 | 9.47e-04 | 7.95e-03 | 44 |
| GO:001003810 | Cervix | CC | response to metal ion | 67/2311 | 373/18723 | 9.67e-04 | 8.10e-03 | 67 |
| GO:00507642 | Cervix | CC | regulation of phagocytosis | 23/2311 | 95/18723 | 1.03e-03 | 8.57e-03 | 23 |
| GO:00354563 | Cervix | CC | response to interferon-beta | 11/2311 | 32/18723 | 1.07e-03 | 8.86e-03 | 11 |
| GO:00028331 | Cervix | CC | positive regulation of response to biotic stimulus | 35/2311 | 168/18723 | 1.23e-03 | 9.87e-03 | 35 |
| GO:00450698 | Cervix | CC | regulation of viral genome replication | 21/2311 | 85/18723 | 1.27e-03 | 1.01e-02 | 21 |
| GO:00450714 | Cervix | CC | negative regulation of viral genome replication | 15/2311 | 56/18723 | 2.60e-03 | 1.80e-02 | 15 |
| GO:0060368 | Cervix | CC | regulation of Fc receptor mediated stimulatory signaling pathway | 5/2311 | 10/18723 | 4.20e-03 | 2.58e-02 | 5 |
| GO:00022743 | Cervix | CC | myeloid leukocyte activation | 41/2311 | 223/18723 | 5.66e-03 | 3.25e-02 | 41 |
| GO:0006909 | Cervix | CC | phagocytosis | 53/2311 | 308/18723 | 7.49e-03 | 4.01e-02 | 53 |
| GO:00070092 | Cervix | CC | plasma membrane organization | 28/2311 | 142/18723 | 7.85e-03 | 4.14e-02 | 28 |
| GO:0045089 | Cervix | CC | positive regulation of innate immune response | 26/2311 | 131/18723 | 9.33e-03 | 4.66e-02 | 26 |
| GO:00516072 | Cervix | CC | defense response to virus | 46/2311 | 265/18723 | 1.04e-02 | 4.97e-02 | 46 |
| Page: 1 2 3 4 5 6 7 8 9 10 11 12 13 14 15 16 17 18 19 20 21 22 23 24 25 26 27 28 |
| Pathway ID | Tissue | Disease Stage | Description | Gene Ratio | Bg Ratio | pvalue | p.adjust | qvalue | Count |
| Page: 1 |
Top |
Cell-cell communication analysis |
| Identification of potential cell-cell interactions between two cell types and their ligand-receptor pairs for different disease states |
| Ligand | Receptor | LRpair | Pathway | Tissue | Disease Stage |
| Page: 1 |
Top |
Single-cell gene regulatory network inference analysis |
| Find out the significant the regulons (TFs) and the target genes of each regulon across cell types for different disease states |
| TF | Cell Type | Tissue | Disease Stage | Target Gene | RSS | Regulon Activity |
| ∗The dot plots of a searched regulon are shown for all cell subpopulations in each disease state of each tissue based on the regulon specific score inferred using pySCENIC and by calculating the average expression. |
| Page: 1 |
Top |
Somatic mutation of malignant transformation related genes |
| Annotation of somatic variants for genes involved in malignant transformation |
| Hugo Symbol | Variant Class | Variant Classification | dbSNP RS | HGVSc | HGVSp | HGVSp Short | SWISSPROT | BIOTYPE | SIFT | PolyPhen | Tumor Sample Barcode | Tissue | Histology | Sex | Age | Stage | Therapy Types | Drugs | Outcome |
| PLSCR1 | SNV | Missense_Mutation | novel | c.19C>A | p.Gln7Lys | p.Q7K | O15162 | protein_coding | deleterious_low_confidence(0.02) | possibly_damaging(0.522) | TCGA-LL-A50Y-01 | Breast | breast invasive carcinoma | Female | >=65 | I/II | Hormone Therapy | arimidex | CR |
| PLSCR1 | insertion | Frame_Shift_Ins | novel | c.597_598insTGGAAACTAGGATTTCCAC | p.Gly200TrpfsTer29 | p.G200Wfs*29 | O15162 | protein_coding | TCGA-BH-A0DP-01 | Breast | breast invasive carcinoma | Female | <65 | I/II | Hormone Therapy | arimidex | SD | ||
| PLSCR1 | SNV | Missense_Mutation | novel | c.506G>A | p.Gly169Asp | p.G169D | O15162 | protein_coding | tolerated(0.29) | probably_damaging(0.968) | TCGA-2W-A8YY-01 | Cervix | cervical & endocervical cancer | Female | <65 | I/II | Chemotherapy | cisplatin | CR |
| PLSCR1 | SNV | Missense_Mutation | novel | c.820N>T | p.Ala274Ser | p.A274S | O15162 | protein_coding | tolerated(0.12) | benign(0.276) | TCGA-JW-A69B-01 | Cervix | cervical & endocervical cancer | Female | <65 | I/II | Unknown | Unknown | SD |
| PLSCR1 | SNV | Missense_Mutation | rs377240309 | c.837C>G | p.Ile279Met | p.I279M | O15162 | protein_coding | deleterious(0.01) | possibly_damaging(0.714) | TCGA-VS-A953-01 | Cervix | cervical & endocervical cancer | Female | <65 | I/II | Unknown | Unknown | PD |
| PLSCR1 | SNV | Missense_Mutation | c.761N>A | p.Cys254Tyr | p.C254Y | O15162 | protein_coding | tolerated(0.41) | benign(0) | TCGA-A6-2682-01 | Colorectum | colon adenocarcinoma | Male | >=65 | III/IV | Chemotherapy | 5 | PD | |
| PLSCR1 | SNV | Missense_Mutation | rs769076735 | c.452N>A | p.Arg151Gln | p.R151Q | O15162 | protein_coding | deleterious(0) | probably_damaging(0.997) | TCGA-AA-3977-01 | Colorectum | colon adenocarcinoma | Male | >=65 | I/II | Unknown | Unknown | SD |
| PLSCR1 | SNV | Missense_Mutation | novel | c.652N>G | p.Thr218Ala | p.T218A | O15162 | protein_coding | tolerated(0.08) | benign(0.381) | TCGA-AA-3984-01 | Colorectum | colon adenocarcinoma | Female | <65 | I/II | Unknown | Unknown | SD |
| PLSCR1 | SNV | Missense_Mutation | novel | c.850N>T | p.Asp284Tyr | p.D284Y | O15162 | protein_coding | deleterious(0) | probably_damaging(0.998) | TCGA-CA-6717-01 | Colorectum | colon adenocarcinoma | Male | <65 | I/II | Chemotherapy | oxaliplatin | CR |
| PLSCR1 | SNV | Missense_Mutation | novel | c.392N>G | p.Ile131Ser | p.I131S | O15162 | protein_coding | deleterious(0) | probably_damaging(0.988) | TCGA-CA-6717-01 | Colorectum | colon adenocarcinoma | Male | <65 | I/II | Chemotherapy | oxaliplatin | CR |
| Page: 1 2 3 4 |
Top |
Related drugs of malignant transformation related genes |
| Identification of chemicals and drugs interact with genes involved in malignant transfromation |
| (DGIdb 4.0) |
| Entrez ID | Symbol | Category | Interaction Types | Drug Claim Name | Drug Name | PMIDs |
| Page: 1 |

Copyright 2023-Present -The University of Texas Health Science Center at Houston |