| Tissue | Expression Dynamics | Abbreviation |
| Cervix | 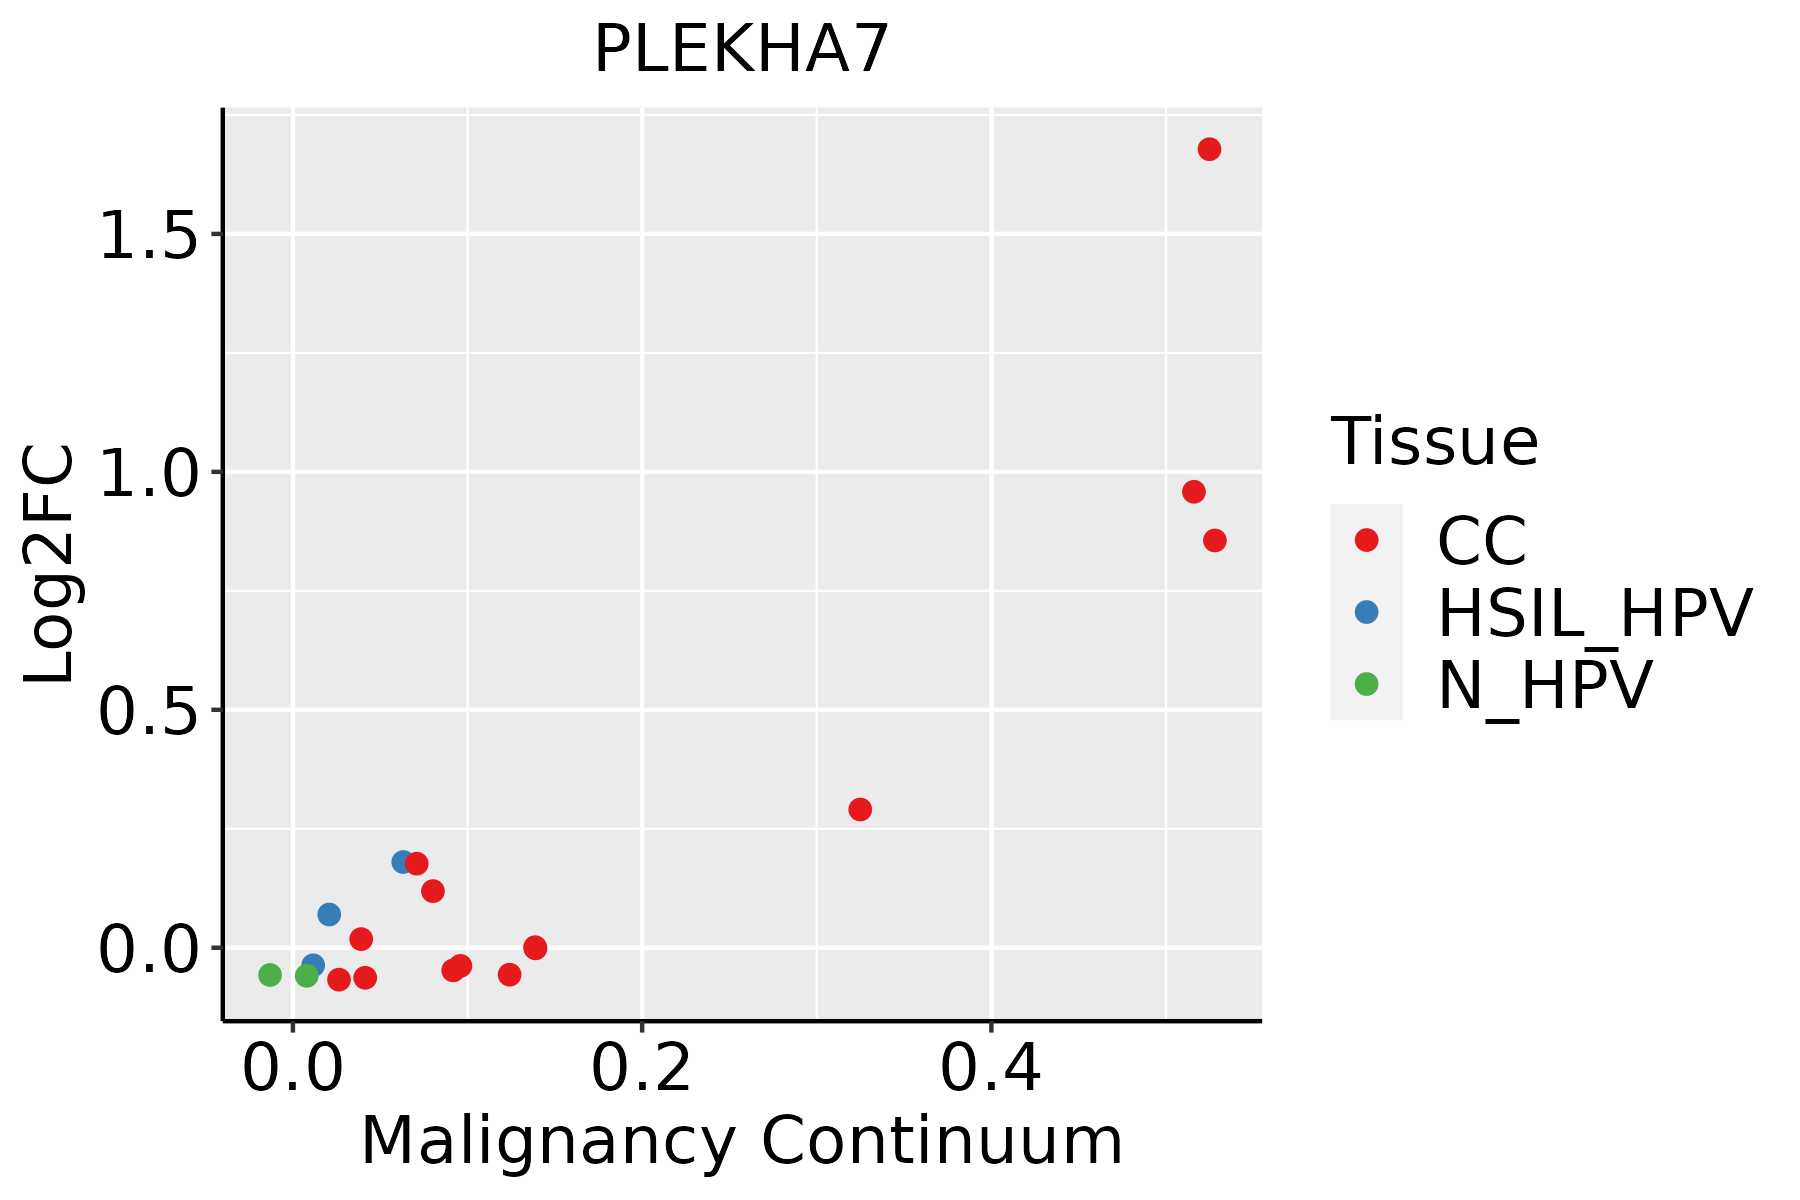 | CC: Cervix cancer |
| HSIL_HPV: HPV-infected high-grade squamous intraepithelial lesions |
| N_HPV: HPV-infected normal cervix |
| Colorectum (GSE201348) |  | FAP: Familial adenomatous polyposis |
| CRC: Colorectal cancer |
| Colorectum (HTA11) |  | AD: Adenomas |
| SER: Sessile serrated lesions |
| MSI-H: Microsatellite-high colorectal cancer |
| MSS: Microsatellite stable colorectal cancer |
| Endometrium |  | AEH: Atypical endometrial hyperplasia |
| EEC: Endometrioid Cancer |
| GC | 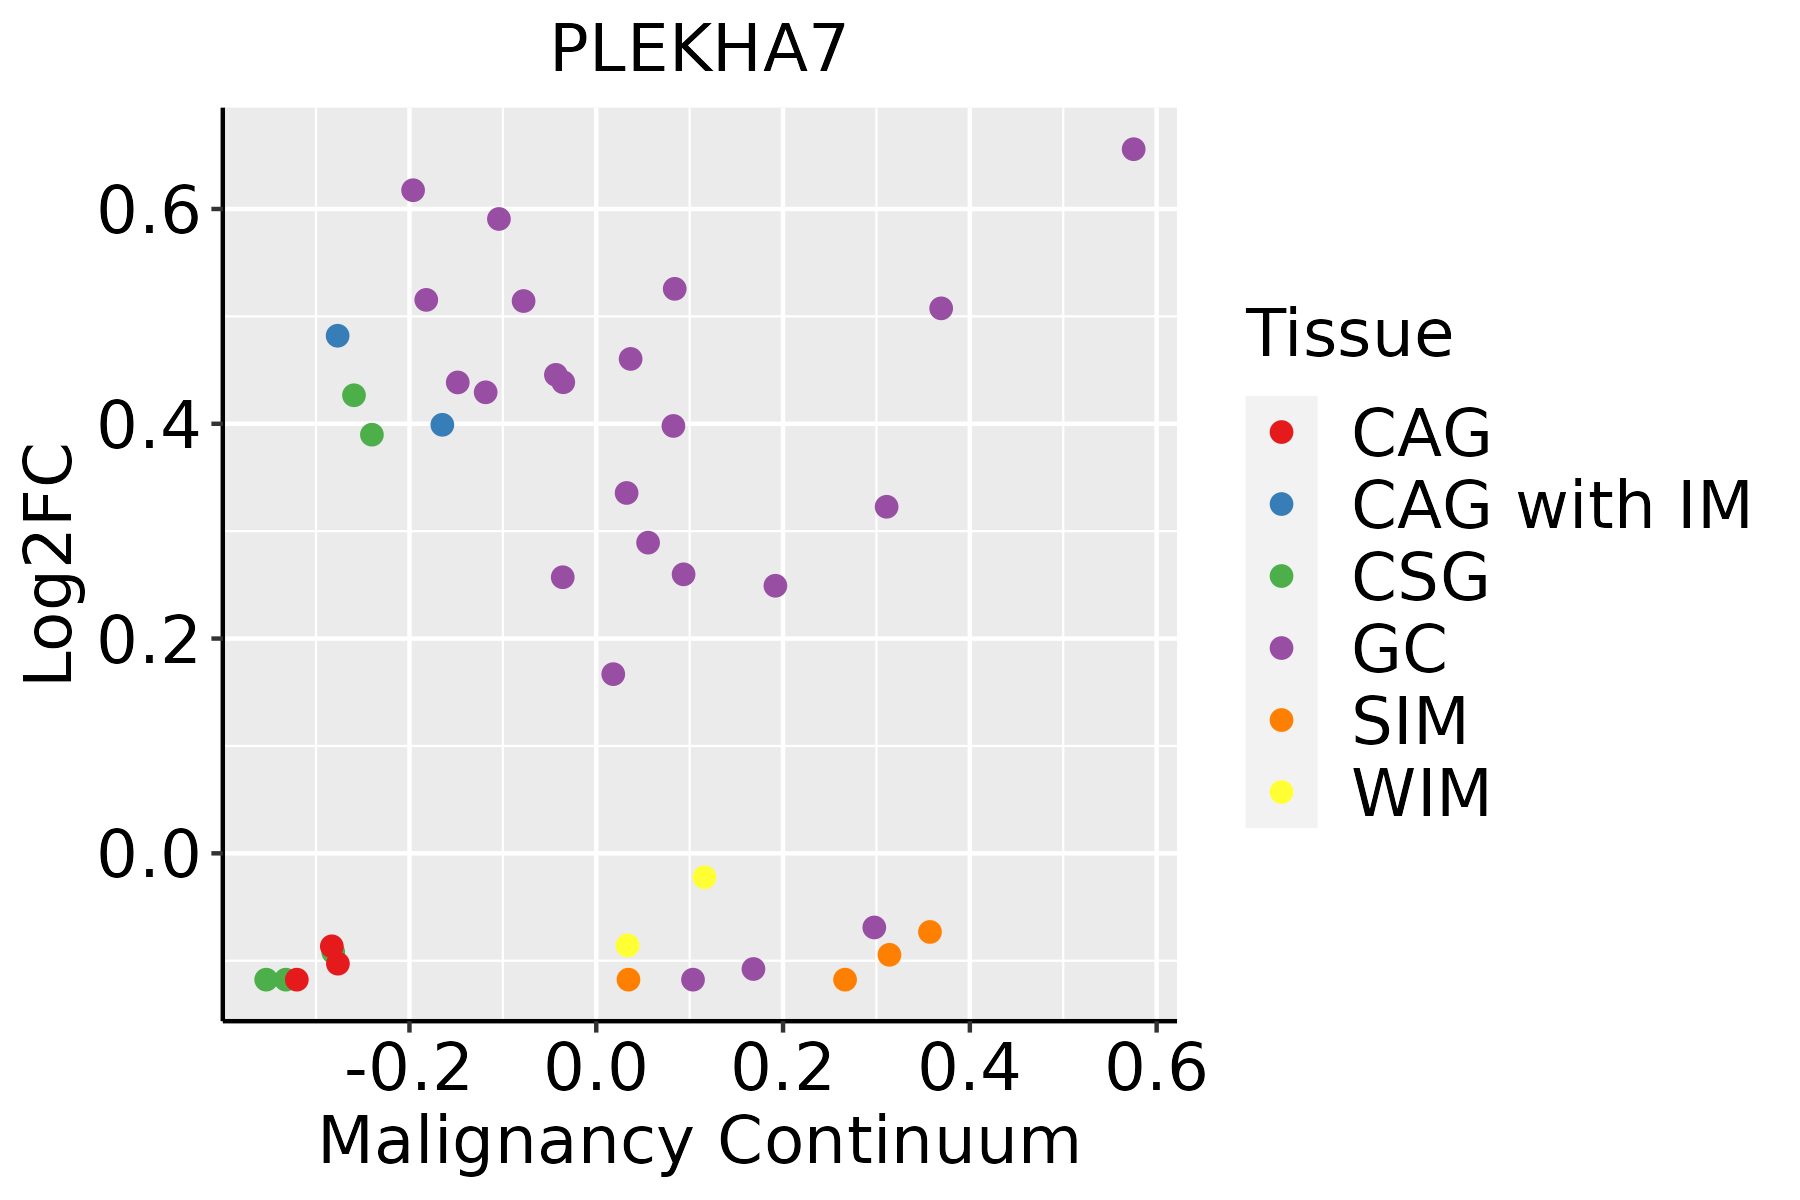 | CAG: Chronic atrophic gastritis |
| CAG with IM: Chronic atrophic gastritis with intestinal metaplasia |
| CSG: Chronic superficial gastritis |
| GC: Gastric cancer |
| SIM: Severe intestinal metaplasia |
| WIM: Wild intestinal metaplasia |
| Lung |  | AAH: Atypical adenomatous hyperplasia |
| AIS: Adenocarcinoma in situ |
| IAC: Invasive lung adenocarcinoma |
| MIA: Minimally invasive adenocarcinoma |
| GO ID | Tissue | Disease Stage | Description | Gene Ratio | Bg Ratio | pvalue | p.adjust | Count |
| GO:00343313 | Colorectum | FAP | cell junction maintenance | 11/2622 | 35/18723 | 6.53e-03 | 4.05e-02 | 11 |
| GO:00452165 | Colorectum | CRC | cell-cell junction organization | 48/2078 | 200/18723 | 1.67e-07 | 1.72e-05 | 48 |
| GO:00343323 | Colorectum | CRC | adherens junction organization | 17/2078 | 49/18723 | 1.09e-05 | 3.60e-04 | 17 |
| GO:00439544 | Colorectum | CRC | cellular component maintenance | 15/2078 | 61/18723 | 2.26e-03 | 2.18e-02 | 15 |
| GO:004521610 | Endometrium | AEH | cell-cell junction organization | 42/2100 | 200/18723 | 4.26e-05 | 7.20e-04 | 42 |
| GO:00439546 | Endometrium | AEH | cellular component maintenance | 16/2100 | 61/18723 | 8.71e-04 | 8.04e-03 | 16 |
| GO:00469313 | Endometrium | AEH | pore complex assembly | 8/2100 | 20/18723 | 8.97e-04 | 8.24e-03 | 8 |
| GO:00343317 | Endometrium | AEH | cell junction maintenance | 10/2100 | 35/18723 | 4.04e-03 | 2.69e-02 | 10 |
| GO:00343327 | Endometrium | AEH | adherens junction organization | 12/2100 | 49/18723 | 6.75e-03 | 3.94e-02 | 12 |
| GO:00901361 | Endometrium | AEH | epithelial cell-cell adhesion | 6/2100 | 17/18723 | 8.19e-03 | 4.50e-02 | 6 |
| GO:004521615 | Endometrium | EEC | cell-cell junction organization | 42/2168 | 200/18723 | 8.84e-05 | 1.25e-03 | 42 |
| GO:004693111 | Endometrium | EEC | pore complex assembly | 8/2168 | 20/18723 | 1.11e-03 | 9.49e-03 | 8 |
| GO:004395412 | Endometrium | EEC | cellular component maintenance | 15/2168 | 61/18723 | 3.41e-03 | 2.32e-02 | 15 |
| GO:00452168 | Lung | IAC | cell-cell junction organization | 43/2061 | 200/18723 | 1.21e-05 | 3.64e-04 | 43 |
| GO:00439545 | Lung | IAC | cellular component maintenance | 17/2061 | 61/18723 | 2.24e-04 | 3.89e-03 | 17 |
| GO:00343325 | Lung | IAC | adherens junction organization | 13/2061 | 49/18723 | 1.95e-03 | 1.97e-02 | 13 |
| GO:00343315 | Lung | IAC | cell junction maintenance | 10/2061 | 35/18723 | 3.52e-03 | 2.98e-02 | 10 |
| GO:004521613 | Lung | AIS | cell-cell junction organization | 41/1849 | 200/18723 | 4.66e-06 | 2.31e-04 | 41 |
| GO:004395411 | Lung | AIS | cellular component maintenance | 15/1849 | 61/18723 | 6.88e-04 | 1.02e-02 | 15 |
| GO:003433112 | Lung | AIS | cell junction maintenance | 9/1849 | 35/18723 | 5.76e-03 | 4.81e-02 | 9 |
| Hugo Symbol | Variant Class | Variant Classification | dbSNP RS | HGVSc | HGVSp | HGVSp Short | SWISSPROT | BIOTYPE | SIFT | PolyPhen | Tumor Sample Barcode | Tissue | Histology | Sex | Age | Stage | Therapy Types | Drugs | Outcome |
| PLEKHA7 | SNV | Missense_Mutation | rs146138261 | c.611N>T | p.Ala204Val | p.A204V | Q6IQ23 | protein_coding | tolerated(0.14) | benign(0.005) | TCGA-AN-A046-01 | Breast | breast invasive carcinoma | Female | >=65 | I/II | Unknown | Unknown | SD |
| PLEKHA7 | SNV | Missense_Mutation | novel | c.1871N>T | p.Ser624Leu | p.S624L | Q6IQ23 | protein_coding | tolerated(0.06) | benign(0.323) | TCGA-AR-A2LE-01 | Breast | breast invasive carcinoma | Female | >=65 | I/II | Hormone Therapy | tamoxiphen | PD |
| PLEKHA7 | insertion | In_Frame_Ins | novel | c.1781_1782insGACTTCTTGTCTCCCCACTTGCAGAACTCATCTCATGTGGAC | p.Thr595_Val596insSerCysLeuProThrCysArgThrHisLeuMetTrpThrThr | p.T595_V596insSCLPTCRTHLMWTT | Q6IQ23 | protein_coding | | | TCGA-A8-A0A4-01 | Breast | breast invasive carcinoma | Female | >=65 | I/II | Hormone Therapy | tamoxiphen | CR |
| PLEKHA7 | insertion | Frame_Shift_Ins | novel | c.964_965insAGGCCAGAGTTCAGTCCTGGGTCTGTGAGCCTCCAAGGCCTCCATGC | p.Arg322LysfsTer200 | p.R322Kfs*200 | Q6IQ23 | protein_coding | | | TCGA-B6-A0RE-01 | Breast | breast invasive carcinoma | Female | <65 | I/II | Unknown | Unknown | SD |
| PLEKHA7 | deletion | Frame_Shift_Del | novel | c.466delN | p.Ala156ProfsTer12 | p.A156Pfs*12 | Q6IQ23 | protein_coding | | | TCGA-D8-A27V-01 | Breast | breast invasive carcinoma | Female | <65 | I/II | Hormone Therapy | tamoxiphen | SD |
| PLEKHA7 | SNV | Missense_Mutation | novel | c.3056N>C | p.Leu1019Pro | p.L1019P | Q6IQ23 | protein_coding | tolerated(0.18) | possibly_damaging(0.87) | TCGA-2W-A8YY-01 | Cervix | cervical & endocervical cancer | Female | <65 | I/II | Chemotherapy | cisplatin | CR |
| PLEKHA7 | SNV | Missense_Mutation | rs200470818 | c.892N>T | p.Arg298Trp | p.R298W | Q6IQ23 | protein_coding | tolerated(0.08) | benign(0) | TCGA-2W-A8YY-01 | Cervix | cervical & endocervical cancer | Female | <65 | I/II | Chemotherapy | cisplatin | CR |
| PLEKHA7 | SNV | Missense_Mutation | novel | c.2263G>A | p.Glu755Lys | p.E755K | Q6IQ23 | protein_coding | deleterious(0.01) | probably_damaging(0.98) | TCGA-VS-A9UC-01 | Cervix | cervical & endocervical cancer | Female | <65 | I/II | Chemotherapy | cisplatin | SD |
| PLEKHA7 | SNV | Missense_Mutation | novel | c.2860N>T | p.Arg954Trp | p.R954W | Q6IQ23 | protein_coding | deleterious(0) | probably_damaging(0.998) | TCGA-5M-AAT6-01 | Colorectum | colon adenocarcinoma | Female | <65 | III/IV | Unknown | Unknown | PD |
| PLEKHA7 | SNV | Missense_Mutation | novel | c.2858N>G | p.Val953Gly | p.V953G | Q6IQ23 | protein_coding | deleterious(0) | probably_damaging(0.996) | TCGA-A6-6653-01 | Colorectum | colon adenocarcinoma | Male | >=65 | I/II | Unknown | Unknown | SD |


