
|
|||||
|
 | |
| |
| |
| |
| |
| |
|
Gene: PIP4K2A |
Gene summary for PIP4K2A |
| Gene information | Species | Human | Gene symbol | PIP4K2A | Gene ID | 5305 |
| Gene name | phosphatidylinositol-5-phosphate 4-kinase type 2 alpha | |
| Gene Alias | PI5P4KA | |
| Cytomap | 10p12.2 | |
| Gene Type | protein-coding | GO ID | GO:0000045 | UniProtAcc | P48426 |
Top |
Malignant transformation analysis |
| Identification of the aberrant gene expression in precancerous and cancerous lesions by comparing the gene expression of stem-like cells in diseased tissues with normal stem cells |
| Entrez ID | Symbol | Replicates | Species | Organ | Tissue | Adj P-value | Log2FC | Malignancy |
| 5305 | PIP4K2A | AEH-subject1 | Human | Endometrium | AEH | 3.07e-22 | 5.66e-01 | -0.3059 |
| 5305 | PIP4K2A | AEH-subject2 | Human | Endometrium | AEH | 3.34e-10 | 4.51e-01 | -0.2525 |
| 5305 | PIP4K2A | AEH-subject3 | Human | Endometrium | AEH | 3.09e-11 | 4.17e-01 | -0.2576 |
| 5305 | PIP4K2A | AEH-subject4 | Human | Endometrium | AEH | 1.37e-09 | 4.65e-01 | -0.2657 |
| 5305 | PIP4K2A | AEH-subject5 | Human | Endometrium | AEH | 1.12e-10 | 4.81e-01 | -0.2953 |
| 5305 | PIP4K2A | EEC-subject1 | Human | Endometrium | EEC | 2.08e-29 | 7.54e-01 | -0.2682 |
| 5305 | PIP4K2A | EEC-subject2 | Human | Endometrium | EEC | 1.33e-21 | 5.69e-01 | -0.2607 |
| 5305 | PIP4K2A | EEC-subject3 | Human | Endometrium | EEC | 2.22e-05 | 1.94e-01 | -0.2525 |
| 5305 | PIP4K2A | EEC-subject4 | Human | Endometrium | EEC | 1.80e-12 | 4.92e-01 | -0.2571 |
| 5305 | PIP4K2A | EEC-subject5 | Human | Endometrium | EEC | 4.35e-18 | 5.46e-01 | -0.249 |
| 5305 | PIP4K2A | GSM6177620_NYU_UCEC1_lib1_lib1 | Human | Endometrium | EEC | 2.20e-06 | 6.43e-02 | -0.1869 |
| 5305 | PIP4K2A | GSM6177620_NYU_UCEC1_lib2_lib2 | Human | Endometrium | EEC | 1.30e-07 | -7.77e-02 | -0.1875 |
| 5305 | PIP4K2A | GSM6177620_NYU_UCEC1_lib3_lib3 | Human | Endometrium | EEC | 7.33e-04 | -2.83e-02 | -0.1883 |
| 5305 | PIP4K2A | GSM6177621_NYU_UCEC2_lib1_lib1 | Human | Endometrium | EEC | 1.48e-08 | 1.20e-01 | -0.1934 |
| 5305 | PIP4K2A | GSM6177622_NYU_UCEC3_lib1_lib1 | Human | Endometrium | EEC | 2.52e-11 | 9.75e-02 | -0.1917 |
| 5305 | PIP4K2A | GSM6177622_NYU_UCEC3_lib2_lib2 | Human | Endometrium | EEC | 4.02e-08 | 9.10e-02 | -0.1916 |
| 5305 | PIP4K2A | C30 | Human | Oral cavity | OSCC | 6.08e-12 | 6.23e-01 | 0.3055 |
| 5305 | PIP4K2A | C57 | Human | Oral cavity | OSCC | 8.88e-04 | 4.32e-02 | 0.1679 |
| 5305 | PIP4K2A | EOLP-1 | Human | Oral cavity | EOLP | 1.01e-21 | 5.88e-01 | -0.0202 |
| 5305 | PIP4K2A | EOLP-2 | Human | Oral cavity | EOLP | 1.99e-12 | 5.41e-01 | -0.0203 |
| Page: 1 2 |
| Tissue | Expression Dynamics | Abbreviation |
| Endometrium |  | AEH: Atypical endometrial hyperplasia |
| EEC: Endometrioid Cancer | ||
| Oral Cavity |  | EOLP: Erosive Oral lichen planus |
| LP: leukoplakia | ||
| NEOLP: Non-erosive oral lichen planus | ||
| OSCC: Oral squamous cell carcinoma | ||
| Thyroid | 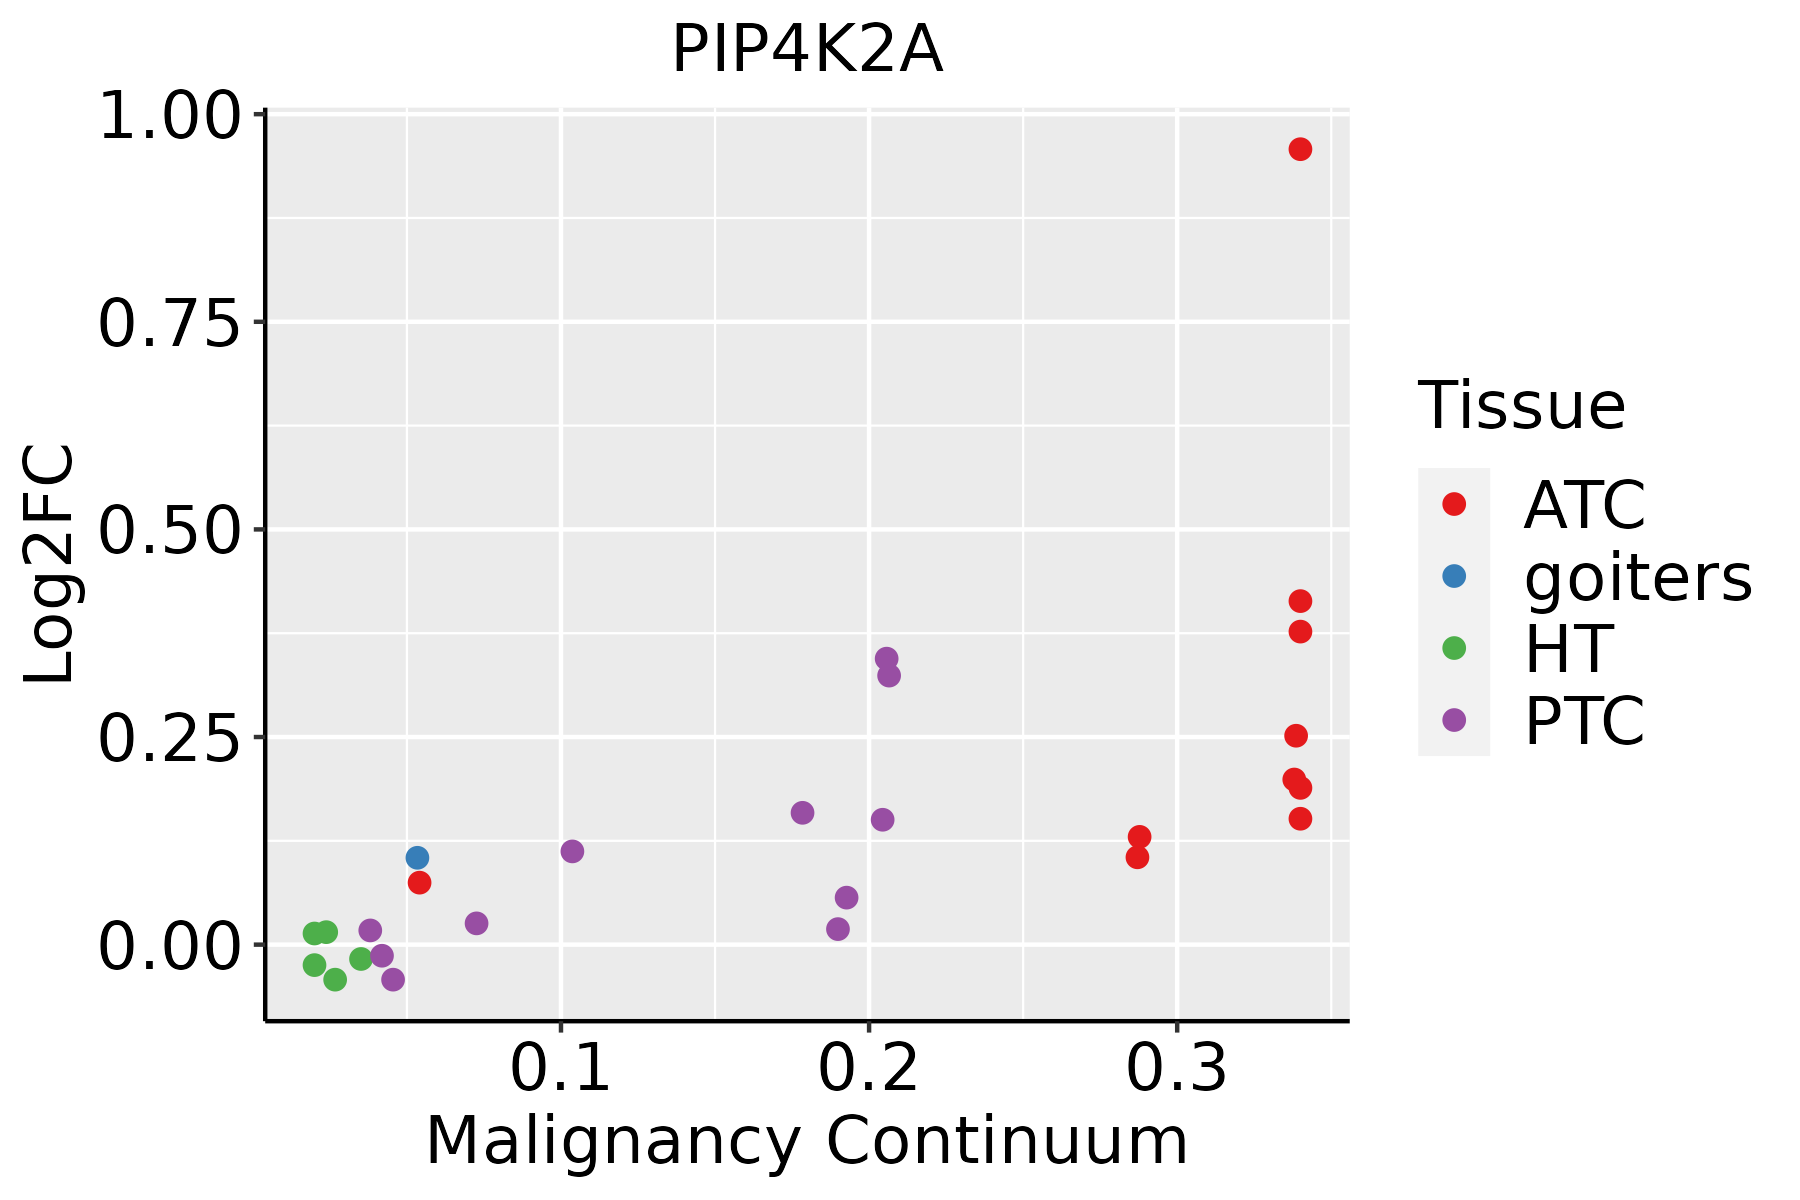 | ATC: Anaplastic thyroid cancer |
| HT: Hashimoto's thyroiditis | ||
| PTC: Papillary thyroid cancer |
| ∗log2FC in expression of this searched gene in stem-like cells from each diseased tissue sample relative to stem-like cells in normal samples in each tissue plotted against the malignancy continuum. Samples are colored based on if they are from different disease stage. |
Top |
Malignant transformation related pathway analysis |
| Find out the enriched GO biological processes and KEGG pathways involved in transition from healthy to precancer to cancer |
| Tissue | Disease Stage | Enriched GO biological Processes |
| Colorectum | AD |  |
| Colorectum | SER |  |
| Colorectum | MSS |  |
| Colorectum | MSI-H |  |
| Colorectum | FAP |  |
| ∗Top 15 enriched GO BP terms are showed in the bar plot of each disease state in each tissue. Each row represents a significant GO biological process which is colored according to the -log10(p.adjust). |
| Page: 1 2 3 4 5 6 7 8 9 |
| GO ID | Tissue | Disease Stage | Description | Gene Ratio | Bg Ratio | pvalue | p.adjust | Count |
| GO:190165314 | Endometrium | EEC | cellular response to peptide | 68/2168 | 359/18723 | 2.75e-05 | 4.83e-04 | 68 |
| GO:004343416 | Endometrium | EEC | response to peptide hormone | 74/2168 | 414/18723 | 9.11e-05 | 1.28e-03 | 74 |
| GO:005134817 | Endometrium | EEC | negative regulation of transferase activity | 52/2168 | 268/18723 | 1.23e-04 | 1.64e-03 | 52 |
| GO:004593617 | Endometrium | EEC | negative regulation of phosphate metabolic process | 77/2168 | 441/18723 | 1.45e-04 | 1.87e-03 | 77 |
| GO:001056317 | Endometrium | EEC | negative regulation of phosphorus metabolic process | 77/2168 | 442/18723 | 1.56e-04 | 1.97e-03 | 77 |
| GO:001623613 | Endometrium | EEC | macroautophagy | 53/2168 | 291/18723 | 5.40e-04 | 5.42e-03 | 53 |
| GO:007137513 | Endometrium | EEC | cellular response to peptide hormone stimulus | 52/2168 | 290/18723 | 8.77e-04 | 8.01e-03 | 52 |
| GO:003286914 | Endometrium | EEC | cellular response to insulin stimulus | 39/2168 | 203/18723 | 9.93e-04 | 8.79e-03 | 39 |
| GO:004232616 | Endometrium | EEC | negative regulation of phosphorylation | 65/2168 | 385/18723 | 1.13e-03 | 9.67e-03 | 65 |
| GO:001050613 | Endometrium | EEC | regulation of autophagy | 55/2168 | 317/18723 | 1.40e-03 | 1.14e-02 | 55 |
| GO:003009917 | Endometrium | EEC | myeloid cell differentiation | 64/2168 | 381/18723 | 1.40e-03 | 1.14e-02 | 64 |
| GO:000828613 | Endometrium | EEC | insulin receptor signaling pathway | 25/2168 | 116/18723 | 1.50e-03 | 1.21e-02 | 25 |
| GO:001050813 | Endometrium | EEC | positive regulation of autophagy | 26/2168 | 124/18723 | 1.85e-03 | 1.43e-02 | 26 |
| GO:003286814 | Endometrium | EEC | response to insulin | 46/2168 | 264/18723 | 3.01e-03 | 2.10e-02 | 46 |
| GO:003367314 | Endometrium | EEC | negative regulation of kinase activity | 41/2168 | 237/18723 | 5.55e-03 | 3.36e-02 | 41 |
| GO:001921613 | Endometrium | EEC | regulation of lipid metabolic process | 54/2168 | 331/18723 | 5.82e-03 | 3.49e-02 | 54 |
| GO:000989620 | Oral cavity | OSCC | positive regulation of catabolic process | 307/7305 | 492/18723 | 2.29e-26 | 7.64e-24 | 307 |
| GO:003133120 | Oral cavity | OSCC | positive regulation of cellular catabolic process | 273/7305 | 427/18723 | 6.39e-26 | 2.02e-23 | 273 |
| GO:001623610 | Oral cavity | OSCC | macroautophagy | 192/7305 | 291/18723 | 7.01e-21 | 1.14e-18 | 192 |
| GO:001050610 | Oral cavity | OSCC | regulation of autophagy | 198/7305 | 317/18723 | 1.63e-17 | 1.51e-15 | 198 |
| Page: 1 2 3 4 5 6 7 8 9 10 11 12 |
| Pathway ID | Tissue | Disease Stage | Description | Gene Ratio | Bg Ratio | pvalue | p.adjust | qvalue | Count |
| hsa0481018 | Endometrium | AEH | Regulation of actin cytoskeleton | 50/1197 | 229/8465 | 9.08e-04 | 5.78e-03 | 4.23e-03 | 50 |
| hsa0481019 | Endometrium | AEH | Regulation of actin cytoskeleton | 50/1197 | 229/8465 | 9.08e-04 | 5.78e-03 | 4.23e-03 | 50 |
| hsa0481024 | Endometrium | EEC | Regulation of actin cytoskeleton | 49/1237 | 229/8465 | 3.20e-03 | 1.78e-02 | 1.33e-02 | 49 |
| hsa0481034 | Endometrium | EEC | Regulation of actin cytoskeleton | 49/1237 | 229/8465 | 3.20e-03 | 1.78e-02 | 1.33e-02 | 49 |
| hsa0481026 | Oral cavity | OSCC | Regulation of actin cytoskeleton | 129/3704 | 229/8465 | 7.14e-05 | 2.74e-04 | 1.40e-04 | 129 |
| hsa04810111 | Oral cavity | OSCC | Regulation of actin cytoskeleton | 129/3704 | 229/8465 | 7.14e-05 | 2.74e-04 | 1.40e-04 | 129 |
| hsa0481027 | Oral cavity | EOLP | Regulation of actin cytoskeleton | 50/1218 | 229/8465 | 1.34e-03 | 4.80e-03 | 2.83e-03 | 50 |
| hsa0481036 | Oral cavity | EOLP | Regulation of actin cytoskeleton | 50/1218 | 229/8465 | 1.34e-03 | 4.80e-03 | 2.83e-03 | 50 |
| hsa0481043 | Oral cavity | NEOLP | Regulation of actin cytoskeleton | 55/1112 | 229/8465 | 4.12e-06 | 3.86e-05 | 2.42e-05 | 55 |
| hsa0481053 | Oral cavity | NEOLP | Regulation of actin cytoskeleton | 55/1112 | 229/8465 | 4.12e-06 | 3.86e-05 | 2.42e-05 | 55 |
| Page: 1 |
Top |
Cell-cell communication analysis |
| Identification of potential cell-cell interactions between two cell types and their ligand-receptor pairs for different disease states |
| Ligand | Receptor | LRpair | Pathway | Tissue | Disease Stage |
| Page: 1 |
Top |
Single-cell gene regulatory network inference analysis |
| Find out the significant the regulons (TFs) and the target genes of each regulon across cell types for different disease states |
| TF | Cell Type | Tissue | Disease Stage | Target Gene | RSS | Regulon Activity |
| ∗The dot plots of a searched regulon are shown for all cell subpopulations in each disease state of each tissue based on the regulon specific score inferred using pySCENIC and by calculating the average expression. |
| Page: 1 |
Top |
Somatic mutation of malignant transformation related genes |
| Annotation of somatic variants for genes involved in malignant transformation |
| Hugo Symbol | Variant Class | Variant Classification | dbSNP RS | HGVSc | HGVSp | HGVSp Short | SWISSPROT | BIOTYPE | SIFT | PolyPhen | Tumor Sample Barcode | Tissue | Histology | Sex | Age | Stage | Therapy Types | Drugs | Outcome |
| PIP4K2A | SNV | Missense_Mutation | c.362C>A | p.Pro121His | p.P121H | P48426 | protein_coding | deleterious(0.02) | possibly_damaging(0.899) | TCGA-A2-A04Y-01 | Breast | breast invasive carcinoma | Female | <65 | I/II | Chemotherapy | cytoxan | SD | |
| PIP4K2A | SNV | Missense_Mutation | novel | c.254C>G | p.Pro85Arg | p.P85R | P48426 | protein_coding | deleterious(0.01) | probably_damaging(0.996) | TCGA-EW-A1PH-01 | Breast | breast invasive carcinoma | Female | <65 | I/II | Chemotherapy | cyclophosphamide | SD |
| PIP4K2A | SNV | Missense_Mutation | c.534N>A | p.Phe178Leu | p.F178L | P48426 | protein_coding | deleterious(0.01) | possibly_damaging(0.792) | TCGA-AA-3977-01 | Colorectum | colon adenocarcinoma | Male | >=65 | I/II | Unknown | Unknown | SD | |
| PIP4K2A | SNV | Missense_Mutation | rs771178304 | c.296G>A | p.Arg99His | p.R99H | P48426 | protein_coding | deleterious(0.03) | possibly_damaging(0.777) | TCGA-AD-5900-01 | Colorectum | colon adenocarcinoma | Male | >=65 | I/II | Unknown | Unknown | SD |
| PIP4K2A | SNV | Missense_Mutation | c.626N>G | p.Lys209Arg | p.K209R | P48426 | protein_coding | deleterious(0.03) | probably_damaging(0.991) | TCGA-CM-5861-01 | Colorectum | colon adenocarcinoma | Female | <65 | I/II | Unknown | Unknown | PD | |
| PIP4K2A | SNV | Missense_Mutation | rs763486152 | c.386N>A | p.Arg129His | p.R129H | P48426 | protein_coding | deleterious(0.04) | benign(0.052) | TCGA-CM-6171-01 | Colorectum | colon adenocarcinoma | Female | >=65 | I/II | Unknown | Unknown | SD |
| PIP4K2A | SNV | Missense_Mutation | c.117C>A | p.Ser39Arg | p.S39R | P48426 | protein_coding | deleterious(0) | benign(0.048) | TCGA-F4-6460-01 | Colorectum | colon adenocarcinoma | Female | <65 | III/IV | Chemotherapy | capecitabine | PD | |
| PIP4K2A | SNV | Missense_Mutation | c.319A>G | p.Ile107Val | p.I107V | P48426 | protein_coding | tolerated(0.24) | benign(0.05) | TCGA-WS-AB45-01 | Colorectum | colon adenocarcinoma | Female | <65 | I/II | Unknown | Unknown | SD | |
| PIP4K2A | SNV | Missense_Mutation | c.304C>T | p.Arg102Trp | p.R102W | P48426 | protein_coding | deleterious(0) | probably_damaging(1) | TCGA-EI-6882-01 | Colorectum | rectum adenocarcinoma | Male | <65 | I/II | Unknown | Unknown | SD | |
| PIP4K2A | SNV | Missense_Mutation | novel | c.121N>T | p.Leu41Phe | p.L41F | P48426 | protein_coding | tolerated(1) | benign(0.001) | TCGA-EI-6917-01 | Colorectum | rectum adenocarcinoma | Male | <65 | III/IV | Chemotherapy | 5fluorouracil+oxaciplatina+l-folinian | SD |
| Page: 1 2 3 4 5 |
Top |
Related drugs of malignant transformation related genes |
| Identification of chemicals and drugs interact with genes involved in malignant transfromation |
| (DGIdb 4.0) |
| Entrez ID | Symbol | Category | Interaction Types | Drug Claim Name | Drug Name | PMIDs |
| 5305 | PIP4K2A | ENZYME, KINASE | SJ000201788 | CHEMBL602923 | ||
| 5305 | PIP4K2A | ENZYME, KINASE | CB7969312 | CHEMBL599255 | ||
| 5305 | PIP4K2A | ENZYME, KINASE | GNF-PF-1678 | CHEMBL580340 | ||
| 5305 | PIP4K2A | ENZYME, KINASE | FLUPIRTINE MALEATE | FLUPIRTINE MALEATE | ||
| 5305 | PIP4K2A | ENZYME, KINASE | TDR77225 | CHEMBL1353528 |
| Page: 1 |

Copyright 2023-Present -The University of Texas Health Science Center at Houston |