
|
|||||
|
 | |
| |
| |
| |
| |
| |
|
Gene: PIK3C3 |
Gene summary for PIK3C3 |
| Gene information | Species | Human | Gene symbol | PIK3C3 | Gene ID | 5289 |
| Gene name | phosphatidylinositol 3-kinase catalytic subunit type 3 | |
| Gene Alias | VPS34 | |
| Cytomap | 18q12.3 | |
| Gene Type | protein-coding | GO ID | GO:0000045 | UniProtAcc | A8MYT4 |
Top |
Malignant transformation analysis |
| Identification of the aberrant gene expression in precancerous and cancerous lesions by comparing the gene expression of stem-like cells in diseased tissues with normal stem cells |
| Entrez ID | Symbol | Replicates | Species | Organ | Tissue | Adj P-value | Log2FC | Malignancy |
| 5289 | PIK3C3 | LZE4T | Human | Esophagus | ESCC | 8.77e-11 | 2.10e-01 | 0.0811 |
| 5289 | PIK3C3 | LZE7T | Human | Esophagus | ESCC | 6.20e-09 | 5.40e-01 | 0.0667 |
| 5289 | PIK3C3 | LZE20T | Human | Esophagus | ESCC | 4.83e-07 | 1.28e-01 | 0.0662 |
| 5289 | PIK3C3 | LZE24T | Human | Esophagus | ESCC | 4.94e-14 | 2.12e-01 | 0.0596 |
| 5289 | PIK3C3 | LZE21T | Human | Esophagus | ESCC | 3.05e-02 | 1.02e-01 | 0.0655 |
| 5289 | PIK3C3 | P1T-E | Human | Esophagus | ESCC | 1.38e-05 | 1.43e-01 | 0.0875 |
| 5289 | PIK3C3 | P2T-E | Human | Esophagus | ESCC | 5.28e-13 | 2.24e-01 | 0.1177 |
| 5289 | PIK3C3 | P4T-E | Human | Esophagus | ESCC | 1.29e-14 | 2.36e-01 | 0.1323 |
| 5289 | PIK3C3 | P5T-E | Human | Esophagus | ESCC | 1.08e-05 | 7.29e-02 | 0.1327 |
| 5289 | PIK3C3 | P8T-E | Human | Esophagus | ESCC | 2.63e-19 | 2.95e-01 | 0.0889 |
| 5289 | PIK3C3 | P9T-E | Human | Esophagus | ESCC | 1.95e-14 | 2.35e-01 | 0.1131 |
| 5289 | PIK3C3 | P10T-E | Human | Esophagus | ESCC | 7.81e-13 | 1.80e-01 | 0.116 |
| 5289 | PIK3C3 | P11T-E | Human | Esophagus | ESCC | 2.40e-05 | 2.14e-01 | 0.1426 |
| 5289 | PIK3C3 | P12T-E | Human | Esophagus | ESCC | 3.53e-10 | 2.09e-01 | 0.1122 |
| 5289 | PIK3C3 | P15T-E | Human | Esophagus | ESCC | 3.23e-05 | 8.94e-02 | 0.1149 |
| 5289 | PIK3C3 | P16T-E | Human | Esophagus | ESCC | 1.71e-10 | 1.57e-01 | 0.1153 |
| 5289 | PIK3C3 | P19T-E | Human | Esophagus | ESCC | 2.32e-04 | 2.03e-01 | 0.1662 |
| 5289 | PIK3C3 | P20T-E | Human | Esophagus | ESCC | 1.12e-13 | 2.39e-01 | 0.1124 |
| 5289 | PIK3C3 | P21T-E | Human | Esophagus | ESCC | 3.79e-12 | 1.72e-01 | 0.1617 |
| 5289 | PIK3C3 | P22T-E | Human | Esophagus | ESCC | 3.79e-14 | 2.11e-01 | 0.1236 |
| Page: 1 2 3 4 |
| Tissue | Expression Dynamics | Abbreviation |
| Esophagus | 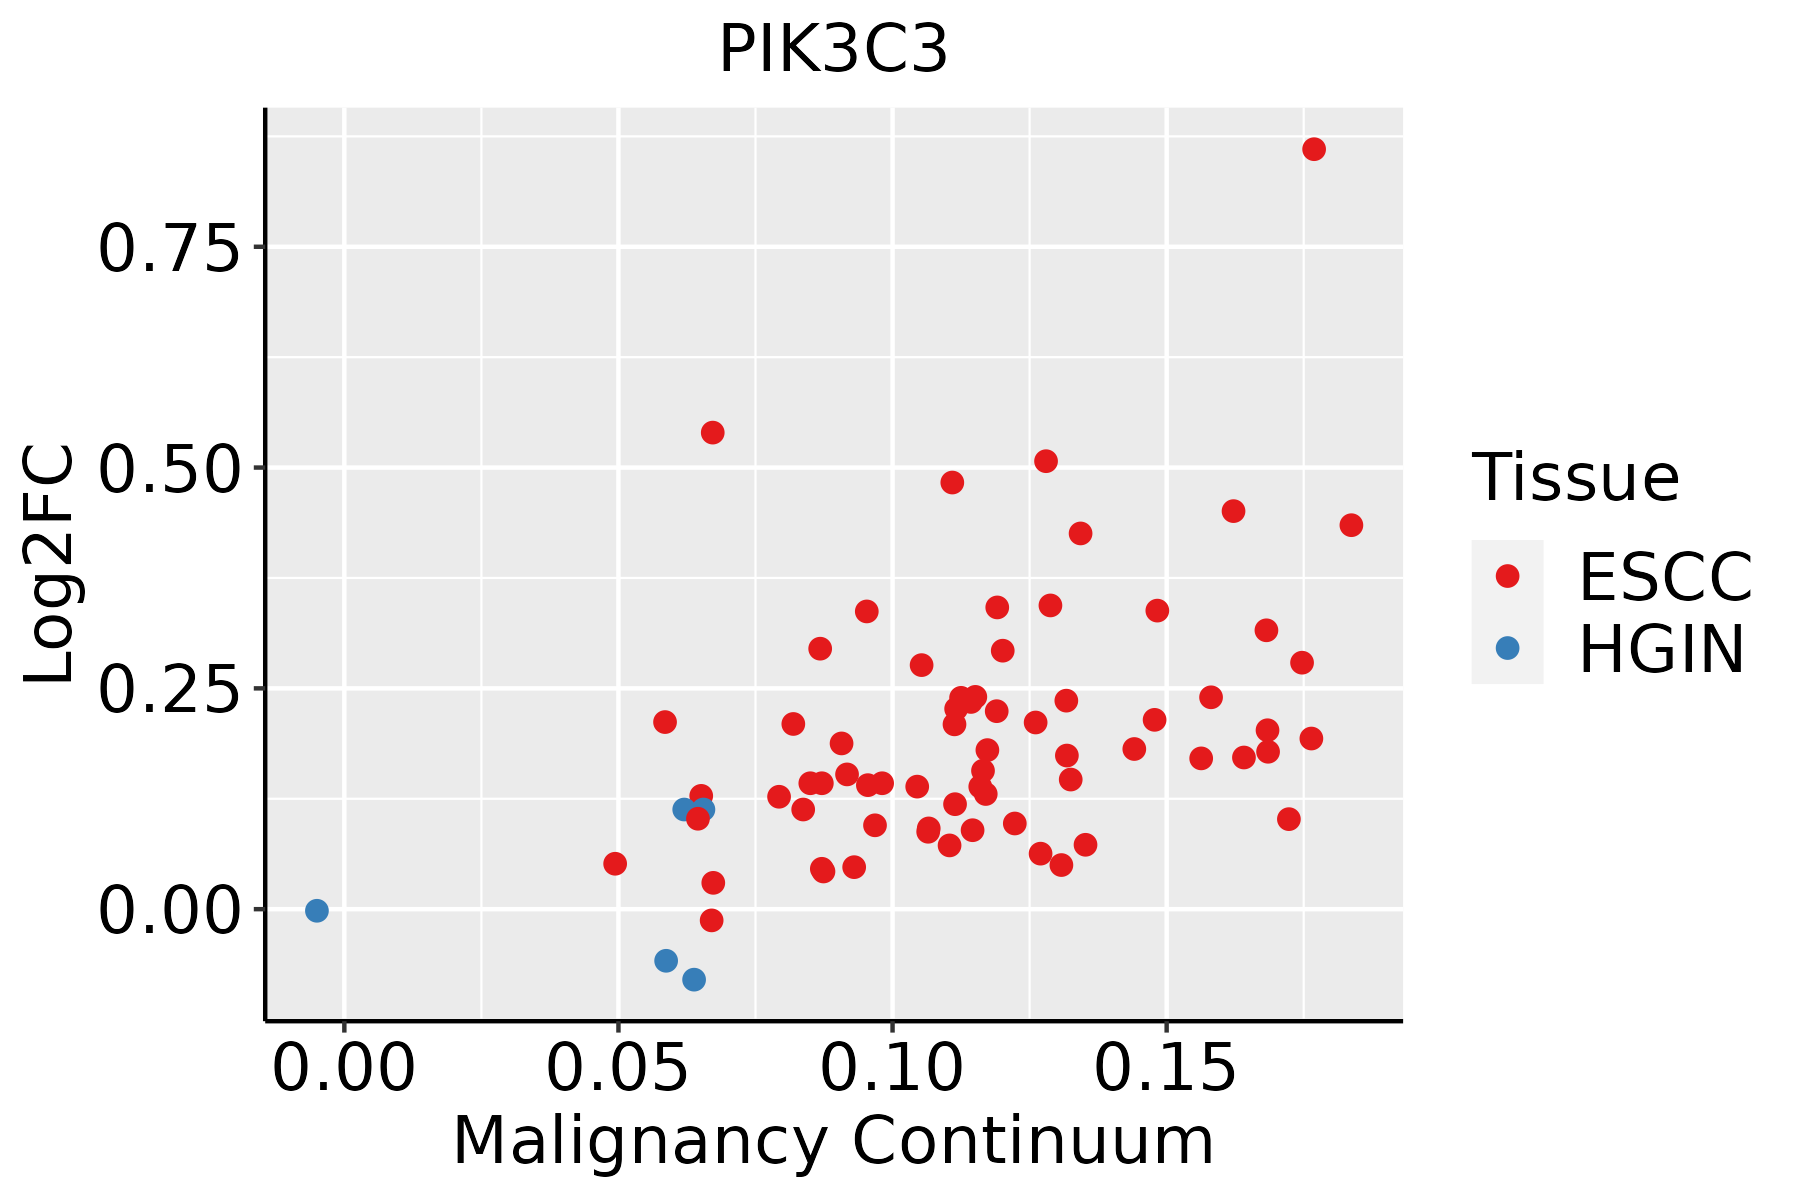 | ESCC: Esophageal squamous cell carcinoma |
| HGIN: High-grade intraepithelial neoplasias | ||
| LGIN: Low-grade intraepithelial neoplasias | ||
| Thyroid | 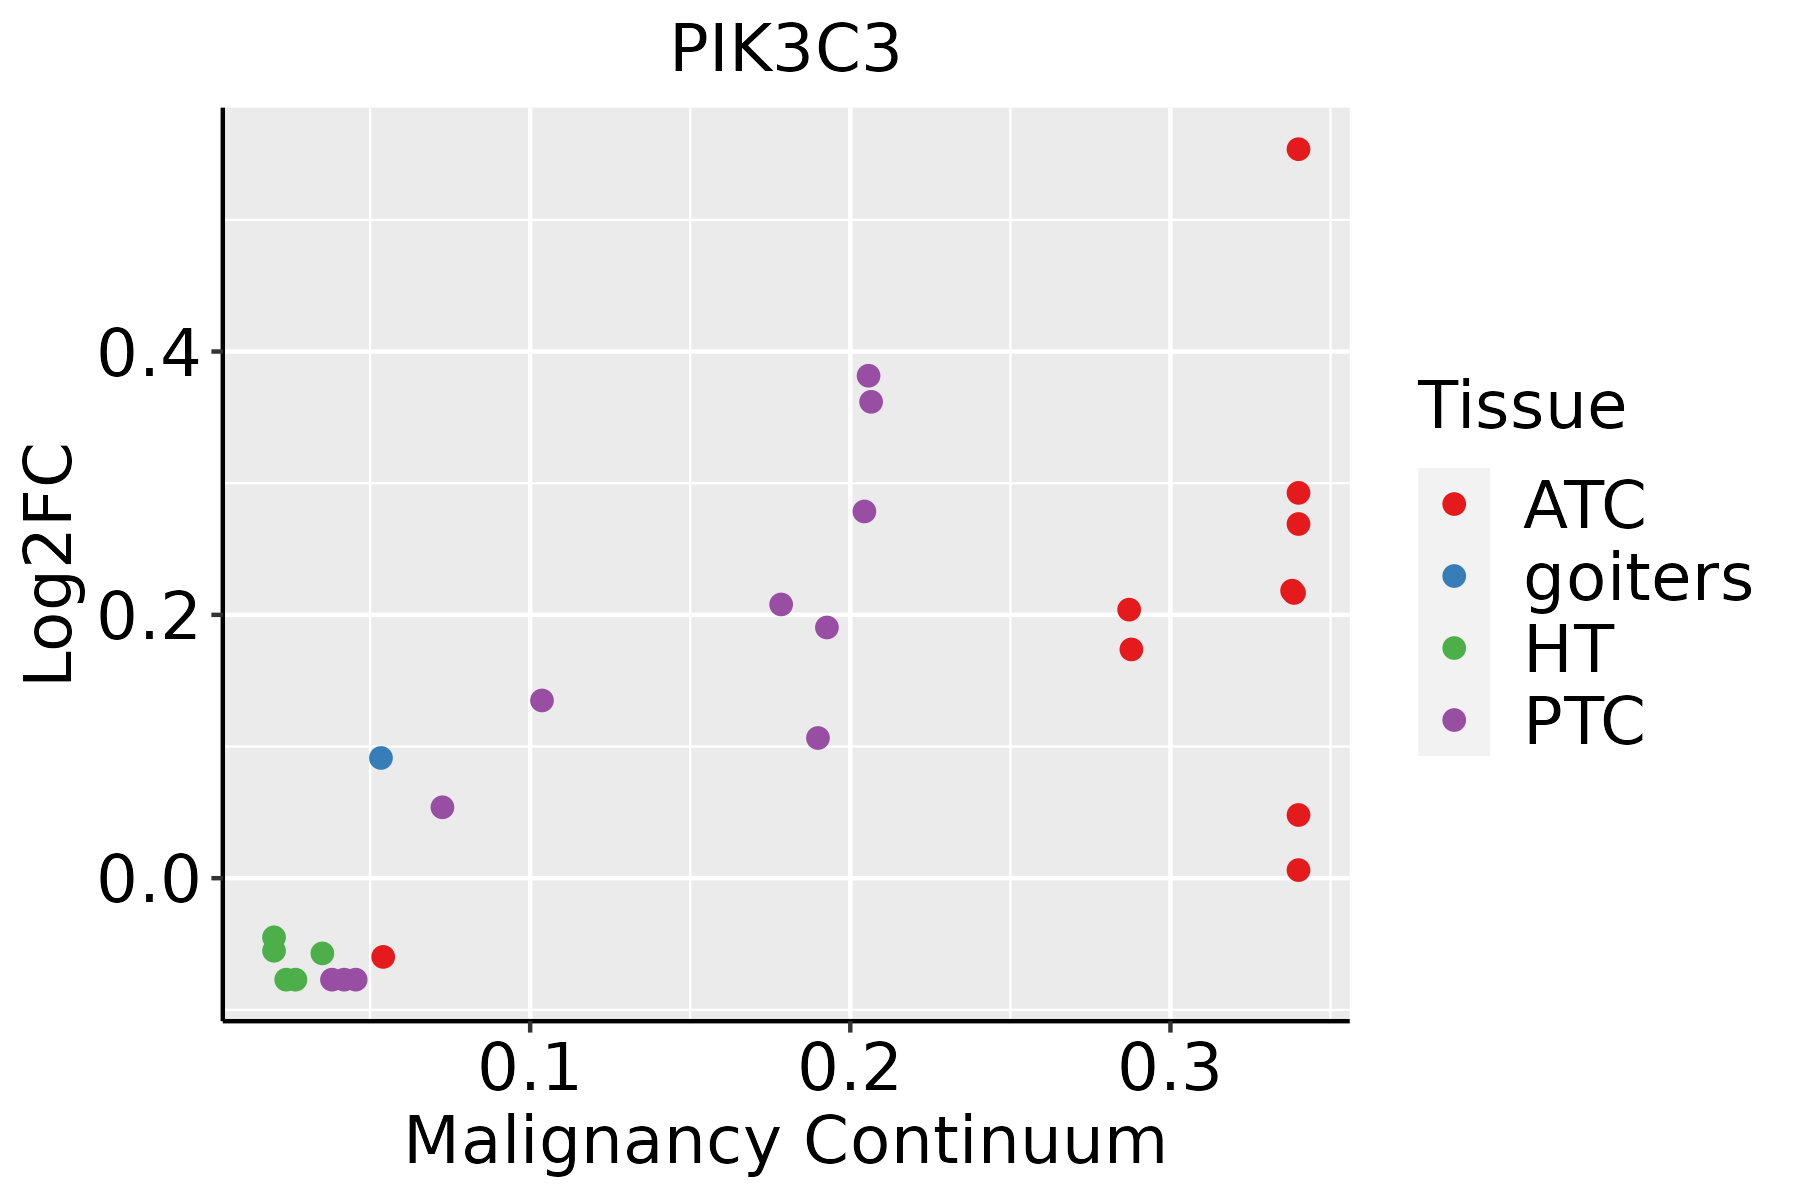 | ATC: Anaplastic thyroid cancer |
| HT: Hashimoto's thyroiditis | ||
| PTC: Papillary thyroid cancer |
| ∗log2FC in expression of this searched gene in stem-like cells from each diseased tissue sample relative to stem-like cells in normal samples in each tissue plotted against the malignancy continuum. Samples are colored based on if they are from different disease stage. |
Top |
Malignant transformation related pathway analysis |
| Find out the enriched GO biological processes and KEGG pathways involved in transition from healthy to precancer to cancer |
| Tissue | Disease Stage | Enriched GO biological Processes |
| Colorectum | AD |  |
| Colorectum | SER |  |
| Colorectum | MSS |  |
| Colorectum | MSI-H |  |
| Colorectum | FAP |  |
| ∗Top 15 enriched GO BP terms are showed in the bar plot of each disease state in each tissue. Each row represents a significant GO biological process which is colored according to the -log10(p.adjust). |
| Page: 1 2 3 4 5 6 7 8 9 |
| GO ID | Tissue | Disease Stage | Description | Gene Ratio | Bg Ratio | pvalue | p.adjust | Count |
| GO:00066446 | Esophagus | ESCC | phospholipid metabolic process | 218/8552 | 383/18723 | 5.37e-06 | 5.59e-05 | 218 |
| GO:00421573 | Esophagus | ESCC | lipoprotein metabolic process | 86/8552 | 135/18723 | 1.78e-05 | 1.57e-04 | 86 |
| GO:001648514 | Esophagus | ESCC | protein processing | 134/8552 | 225/18723 | 1.81e-05 | 1.60e-04 | 134 |
| GO:00064973 | Esophagus | ESCC | protein lipidation | 62/8552 | 92/18723 | 2.08e-05 | 1.80e-04 | 62 |
| GO:00421583 | Esophagus | ESCC | lipoprotein biosynthetic process | 64/8552 | 96/18723 | 2.61e-05 | 2.20e-04 | 64 |
| GO:00421492 | Esophagus | ESCC | cellular response to glucose starvation | 36/8552 | 48/18723 | 3.43e-05 | 2.80e-04 | 36 |
| GO:00066505 | Esophagus | ESCC | glycerophospholipid metabolic process | 174/8552 | 306/18723 | 4.92e-05 | 3.85e-04 | 174 |
| GO:00432007 | Esophagus | ESCC | response to amino acid | 74/8552 | 116/18723 | 6.23e-05 | 4.76e-04 | 74 |
| GO:000110110 | Esophagus | ESCC | response to acid chemical | 84/8552 | 135/18723 | 7.70e-05 | 5.74e-04 | 84 |
| GO:00464864 | Esophagus | ESCC | glycerolipid metabolic process | 211/8552 | 392/18723 | 6.51e-04 | 3.46e-03 | 211 |
| GO:00324653 | Esophagus | ESCC | regulation of cytokinesis | 57/8552 | 92/18723 | 1.20e-03 | 5.88e-03 | 57 |
| GO:000930617 | Esophagus | ESCC | protein secretion | 190/8552 | 359/18723 | 3.22e-03 | 1.34e-02 | 190 |
| GO:003559217 | Esophagus | ESCC | establishment of protein localization to extracellular region | 190/8552 | 360/18723 | 3.77e-03 | 1.53e-02 | 190 |
| GO:007169210 | Esophagus | ESCC | protein localization to extracellular region | 193/8552 | 368/18723 | 5.01e-03 | 1.92e-02 | 193 |
| GO:00513025 | Esophagus | ESCC | regulation of cell division | 97/8552 | 177/18723 | 8.93e-03 | 3.12e-02 | 97 |
| GO:005070810 | Esophagus | ESCC | regulation of protein secretion | 142/8552 | 268/18723 | 9.31e-03 | 3.24e-02 | 142 |
| GO:00066611 | Esophagus | ESCC | phosphatidylinositol biosynthetic process | 73/8552 | 131/18723 | 1.31e-02 | 4.28e-02 | 73 |
| GO:0016236110 | Thyroid | PTC | macroautophagy | 167/5968 | 291/18723 | 1.51e-19 | 1.91e-17 | 167 |
| GO:001605017 | Thyroid | PTC | vesicle organization | 163/5968 | 300/18723 | 4.74e-16 | 3.69e-14 | 163 |
| GO:0071496113 | Thyroid | PTC | cellular response to external stimulus | 158/5968 | 320/18723 | 4.12e-11 | 1.47e-09 | 158 |
| Page: 1 2 3 4 5 |
| Pathway ID | Tissue | Disease Stage | Description | Gene Ratio | Bg Ratio | pvalue | p.adjust | qvalue | Count |
| hsa05014210 | Esophagus | ESCC | Amyotrophic lateral sclerosis | 266/4205 | 364/8465 | 1.31e-20 | 2.20e-18 | 1.13e-18 | 266 |
| hsa05132211 | Esophagus | ESCC | Salmonella infection | 191/4205 | 249/8465 | 6.51e-19 | 5.45e-17 | 2.79e-17 | 191 |
| hsa05016210 | Esophagus | ESCC | Huntington disease | 226/4205 | 306/8465 | 1.38e-18 | 8.72e-17 | 4.46e-17 | 226 |
| hsa05022210 | Esophagus | ESCC | Pathways of neurodegeneration - multiple diseases | 318/4205 | 476/8465 | 6.10e-15 | 2.04e-13 | 1.05e-13 | 318 |
| hsa05010210 | Esophagus | ESCC | Alzheimer disease | 263/4205 | 384/8465 | 1.80e-14 | 5.47e-13 | 2.80e-13 | 263 |
| hsa05131211 | Esophagus | ESCC | Shigellosis | 176/4205 | 247/8465 | 2.27e-12 | 4.01e-11 | 2.05e-11 | 176 |
| hsa05167211 | Esophagus | ESCC | Kaposi sarcoma-associated herpesvirus infection | 136/4205 | 194/8465 | 4.28e-09 | 4.22e-08 | 2.16e-08 | 136 |
| hsa0414010 | Esophagus | ESCC | Autophagy - animal | 101/4205 | 141/8465 | 7.60e-08 | 6.21e-07 | 3.18e-07 | 101 |
| hsa0414530 | Esophagus | ESCC | Phagosome | 100/4205 | 152/8465 | 3.81e-05 | 1.72e-04 | 8.82e-05 | 100 |
| hsa0501728 | Esophagus | ESCC | Spinocerebellar ataxia | 94/4205 | 143/8465 | 6.77e-05 | 2.90e-04 | 1.48e-04 | 94 |
| hsa051527 | Esophagus | ESCC | Tuberculosis | 111/4205 | 180/8465 | 7.14e-04 | 2.32e-03 | 1.19e-03 | 111 |
| hsa041362 | Esophagus | ESCC | Autophagy - other | 23/4205 | 32/8465 | 8.99e-03 | 2.14e-02 | 1.09e-02 | 23 |
| hsa0501438 | Esophagus | ESCC | Amyotrophic lateral sclerosis | 266/4205 | 364/8465 | 1.31e-20 | 2.20e-18 | 1.13e-18 | 266 |
| hsa05132310 | Esophagus | ESCC | Salmonella infection | 191/4205 | 249/8465 | 6.51e-19 | 5.45e-17 | 2.79e-17 | 191 |
| hsa0501638 | Esophagus | ESCC | Huntington disease | 226/4205 | 306/8465 | 1.38e-18 | 8.72e-17 | 4.46e-17 | 226 |
| hsa0502238 | Esophagus | ESCC | Pathways of neurodegeneration - multiple diseases | 318/4205 | 476/8465 | 6.10e-15 | 2.04e-13 | 1.05e-13 | 318 |
| hsa0501038 | Esophagus | ESCC | Alzheimer disease | 263/4205 | 384/8465 | 1.80e-14 | 5.47e-13 | 2.80e-13 | 263 |
| hsa05131310 | Esophagus | ESCC | Shigellosis | 176/4205 | 247/8465 | 2.27e-12 | 4.01e-11 | 2.05e-11 | 176 |
| hsa0516738 | Esophagus | ESCC | Kaposi sarcoma-associated herpesvirus infection | 136/4205 | 194/8465 | 4.28e-09 | 4.22e-08 | 2.16e-08 | 136 |
| hsa0414015 | Esophagus | ESCC | Autophagy - animal | 101/4205 | 141/8465 | 7.60e-08 | 6.21e-07 | 3.18e-07 | 101 |
| Page: 1 2 |
Top |
Cell-cell communication analysis |
| Identification of potential cell-cell interactions between two cell types and their ligand-receptor pairs for different disease states |
| Ligand | Receptor | LRpair | Pathway | Tissue | Disease Stage |
| Page: 1 |
Top |
Single-cell gene regulatory network inference analysis |
| Find out the significant the regulons (TFs) and the target genes of each regulon across cell types for different disease states |
| TF | Cell Type | Tissue | Disease Stage | Target Gene | RSS | Regulon Activity |
| PIK3C3 | SMC | Skin | ADJ | MLKL,TNFSF9,VPS11, etc. | 7.03e-03 |  |
| PIK3C3 | FIB | Skin | ADJ | MLKL,TNFSF9,VPS11, etc. | 1.40e-02 | |
| PIK3C3 | LYMEND | Skin | SCCIS | MLKL,TNFSF9,VPS11, etc. | 1.27e-02 |  |
| ∗The dot plots of a searched regulon are shown for all cell subpopulations in each disease state of each tissue based on the regulon specific score inferred using pySCENIC and by calculating the average expression. |
| Page: 1 |
Top |
Somatic mutation of malignant transformation related genes |
| Annotation of somatic variants for genes involved in malignant transformation |
| Hugo Symbol | Variant Class | Variant Classification | dbSNP RS | HGVSc | HGVSp | HGVSp Short | SWISSPROT | BIOTYPE | SIFT | PolyPhen | Tumor Sample Barcode | Tissue | Histology | Sex | Age | Stage | Therapy Types | Drugs | Outcome |
| PIK3C3 | SNV | Missense_Mutation | novel | c.1108N>T | p.His370Tyr | p.H370Y | Q8NEB9 | protein_coding | deleterious(0.04) | benign(0.025) | TCGA-5L-AAT1-01 | Breast | breast invasive carcinoma | Female | <65 | III/IV | Hormone Therapy | letrozol | SD |
| PIK3C3 | SNV | Missense_Mutation | c.1826N>A | p.Ala609Asp | p.A609D | Q8NEB9 | protein_coding | deleterious(0) | possibly_damaging(0.66) | TCGA-A2-A04N-01 | Breast | breast invasive carcinoma | Female | >=65 | I/II | Chemotherapy | cytoxan | SD | |
| PIK3C3 | SNV | Missense_Mutation | c.609G>T | p.Met203Ile | p.M203I | Q8NEB9 | protein_coding | tolerated(0.17) | benign(0.067) | TCGA-AC-A23H-01 | Breast | breast invasive carcinoma | Female | >=65 | I/II | Unknown | Unknown | PD | |
| PIK3C3 | SNV | Missense_Mutation | c.2114G>C | p.Arg705Thr | p.R705T | Q8NEB9 | protein_coding | deleterious(0) | possibly_damaging(0.65) | TCGA-AC-A23H-01 | Breast | breast invasive carcinoma | Female | >=65 | I/II | Unknown | Unknown | PD | |
| PIK3C3 | SNV | Missense_Mutation | novel | c.140N>T | p.Ser47Leu | p.S47L | Q8NEB9 | protein_coding | tolerated(0.07) | benign(0.051) | TCGA-AC-A5XS-01 | Breast | breast invasive carcinoma | Female | >=65 | I/II | Hormone Therapy | femara | SD |
| PIK3C3 | SNV | Missense_Mutation | c.292C>T | p.Pro98Ser | p.P98S | Q8NEB9 | protein_coding | tolerated(1) | benign(0) | TCGA-AN-A0XU-01 | Breast | breast invasive carcinoma | Female | <65 | I/II | Unknown | Unknown | SD | |
| PIK3C3 | SNV | Missense_Mutation | c.907N>T | p.Pro303Ser | p.P303S | Q8NEB9 | protein_coding | tolerated(0.14) | probably_damaging(0.942) | TCGA-GM-A2DO-01 | Breast | breast invasive carcinoma | Female | <65 | I/II | Hormone Therapy | tamoxiphen | CR | |
| PIK3C3 | SNV | Missense_Mutation | c.1652N>A | p.Arg551Gln | p.R551Q | Q8NEB9 | protein_coding | tolerated(0.4) | benign(0.018) | TCGA-2W-A8YY-01 | Cervix | cervical & endocervical cancer | Female | <65 | I/II | Chemotherapy | cisplatin | CR | |
| PIK3C3 | SNV | Missense_Mutation | rs376188539 | c.521N>A | p.Arg174His | p.R174H | Q8NEB9 | protein_coding | deleterious(0) | probably_damaging(0.969) | TCGA-BI-A0VS-01 | Cervix | cervical & endocervical cancer | Female | <65 | I/II | Unknown | Unknown | SD |
| PIK3C3 | SNV | Missense_Mutation | c.1212N>C | p.Lys404Asn | p.K404N | Q8NEB9 | protein_coding | deleterious(0) | probably_damaging(0.994) | TCGA-EA-A1QT-01 | Cervix | cervical & endocervical cancer | Female | <65 | I/II | Unknown | Unknown | SD |
| Page: 1 2 3 4 5 6 7 8 9 10 11 12 |
Top |
Related drugs of malignant transformation related genes |
| Identification of chemicals and drugs interact with genes involved in malignant transfromation |
| (DGIdb 4.0) |
| Entrez ID | Symbol | Category | Interaction Types | Drug Claim Name | Drug Name | PMIDs |
| 5289 | PIK3C3 | KINASE, PHOSPHATIDYLINOSITOL 3 KINASE, DRUGGABLE GENOME, CLINICALLY ACTIONABLE, ENZYME | inhibitor | PKI-587 | GEDATOLISIB | |
| 5289 | PIK3C3 | KINASE, PHOSPHATIDYLINOSITOL 3 KINASE, DRUGGABLE GENOME, CLINICALLY ACTIONABLE, ENZYME | inhibitor | PWT33597 | ||
| 5289 | PIK3C3 | KINASE, PHOSPHATIDYLINOSITOL 3 KINASE, DRUGGABLE GENOME, CLINICALLY ACTIONABLE, ENZYME | inhibitor | XL-765 | VOXTALISIB | |
| 5289 | PIK3C3 | KINASE, PHOSPHATIDYLINOSITOL 3 KINASE, DRUGGABLE GENOME, CLINICALLY ACTIONABLE, ENZYME | inhibitor | 252827496 | ||
| 5289 | PIK3C3 | KINASE, PHOSPHATIDYLINOSITOL 3 KINASE, DRUGGABLE GENOME, CLINICALLY ACTIONABLE, ENZYME | inhibitor | 381118852 | ||
| 5289 | PIK3C3 | KINASE, PHOSPHATIDYLINOSITOL 3 KINASE, DRUGGABLE GENOME, CLINICALLY ACTIONABLE, ENZYME | inhibitor | 385612248 | ||
| 5289 | PIK3C3 | KINASE, PHOSPHATIDYLINOSITOL 3 KINASE, DRUGGABLE GENOME, CLINICALLY ACTIONABLE, ENZYME | SF1126 | |||
| 5289 | PIK3C3 | KINASE, PHOSPHATIDYLINOSITOL 3 KINASE, DRUGGABLE GENOME, CLINICALLY ACTIONABLE, ENZYME | inhibitor | GDC-0980 | APITOLISIB | |
| 5289 | PIK3C3 | KINASE, PHOSPHATIDYLINOSITOL 3 KINASE, DRUGGABLE GENOME, CLINICALLY ACTIONABLE, ENZYME | inhibitor | PX-866 | SONOLISIB | |
| 5289 | PIK3C3 | KINASE, PHOSPHATIDYLINOSITOL 3 KINASE, DRUGGABLE GENOME, CLINICALLY ACTIONABLE, ENZYME | inhibitor | GDC-0941 | PICTILISIB |
| Page: 1 2 3 |

Copyright 2023-Present -The University of Texas Health Science Center at Houston |