
|
|||||
|
 | |
| |
| |
| |
| |
| |
|
Gene: PIGL |
Gene summary for PIGL |
| Gene information | Species | Human | Gene symbol | PIGL | Gene ID | 9487 |
| Gene name | phosphatidylinositol glycan anchor biosynthesis class L | |
| Gene Alias | CHIME | |
| Cytomap | 17p11.2 | |
| Gene Type | protein-coding | GO ID | GO:0006464 | UniProtAcc | Q9Y2B2 |
Top |
Malignant transformation analysis |
| Identification of the aberrant gene expression in precancerous and cancerous lesions by comparing the gene expression of stem-like cells in diseased tissues with normal stem cells |
| Entrez ID | Symbol | Replicates | Species | Organ | Tissue | Adj P-value | Log2FC | Malignancy |
| 9487 | PIGL | HTA11_3410_2000001011 | Human | Colorectum | AD | 1.89e-07 | -3.41e-01 | 0.0155 |
| 9487 | PIGL | HTA11_866_3004761011 | Human | Colorectum | AD | 7.69e-03 | -3.24e-01 | 0.096 |
| 9487 | PIGL | HTA11_99999970781_79442 | Human | Colorectum | MSS | 6.24e-08 | -3.14e-01 | 0.294 |
| 9487 | PIGL | F007 | Human | Colorectum | FAP | 2.03e-02 | -3.50e-01 | 0.1176 |
| 9487 | PIGL | A001-C-207 | Human | Colorectum | FAP | 2.32e-02 | -2.65e-01 | 0.1278 |
| 9487 | PIGL | A015-C-203 | Human | Colorectum | FAP | 4.02e-22 | -3.10e-01 | -0.1294 |
| 9487 | PIGL | A015-C-204 | Human | Colorectum | FAP | 1.13e-03 | -2.37e-01 | -0.0228 |
| 9487 | PIGL | A014-C-040 | Human | Colorectum | FAP | 1.50e-02 | -2.55e-01 | -0.1184 |
| 9487 | PIGL | A002-C-201 | Human | Colorectum | FAP | 4.45e-11 | -2.78e-01 | 0.0324 |
| 9487 | PIGL | A001-C-119 | Human | Colorectum | FAP | 8.51e-04 | -2.56e-01 | -0.1557 |
| 9487 | PIGL | A001-C-108 | Human | Colorectum | FAP | 3.29e-12 | -1.32e-01 | -0.0272 |
| 9487 | PIGL | A002-C-205 | Human | Colorectum | FAP | 3.59e-18 | -2.76e-01 | -0.1236 |
| 9487 | PIGL | A001-C-104 | Human | Colorectum | FAP | 1.11e-02 | -1.06e-01 | 0.0184 |
| 9487 | PIGL | A015-C-006 | Human | Colorectum | FAP | 4.61e-11 | -3.17e-01 | -0.0994 |
| 9487 | PIGL | A015-C-106 | Human | Colorectum | FAP | 6.83e-08 | -1.45e-01 | -0.0511 |
| 9487 | PIGL | A002-C-114 | Human | Colorectum | FAP | 3.99e-14 | -3.22e-01 | -0.1561 |
| 9487 | PIGL | A015-C-104 | Human | Colorectum | FAP | 2.05e-25 | -2.35e-01 | -0.1899 |
| 9487 | PIGL | A001-C-014 | Human | Colorectum | FAP | 3.28e-12 | -3.05e-01 | 0.0135 |
| 9487 | PIGL | A002-C-016 | Human | Colorectum | FAP | 1.05e-17 | -3.49e-01 | 0.0521 |
| 9487 | PIGL | A015-C-002 | Human | Colorectum | FAP | 3.66e-10 | -4.37e-01 | -0.0763 |
| Page: 1 2 3 4 5 |
| Tissue | Expression Dynamics | Abbreviation |
| Colorectum (GSE201348) |  | FAP: Familial adenomatous polyposis |
| CRC: Colorectal cancer | ||
| Colorectum (HTA11) |  | AD: Adenomas |
| SER: Sessile serrated lesions | ||
| MSI-H: Microsatellite-high colorectal cancer | ||
| MSS: Microsatellite stable colorectal cancer | ||
| Endometrium |  | AEH: Atypical endometrial hyperplasia |
| EEC: Endometrioid Cancer | ||
| Esophagus | 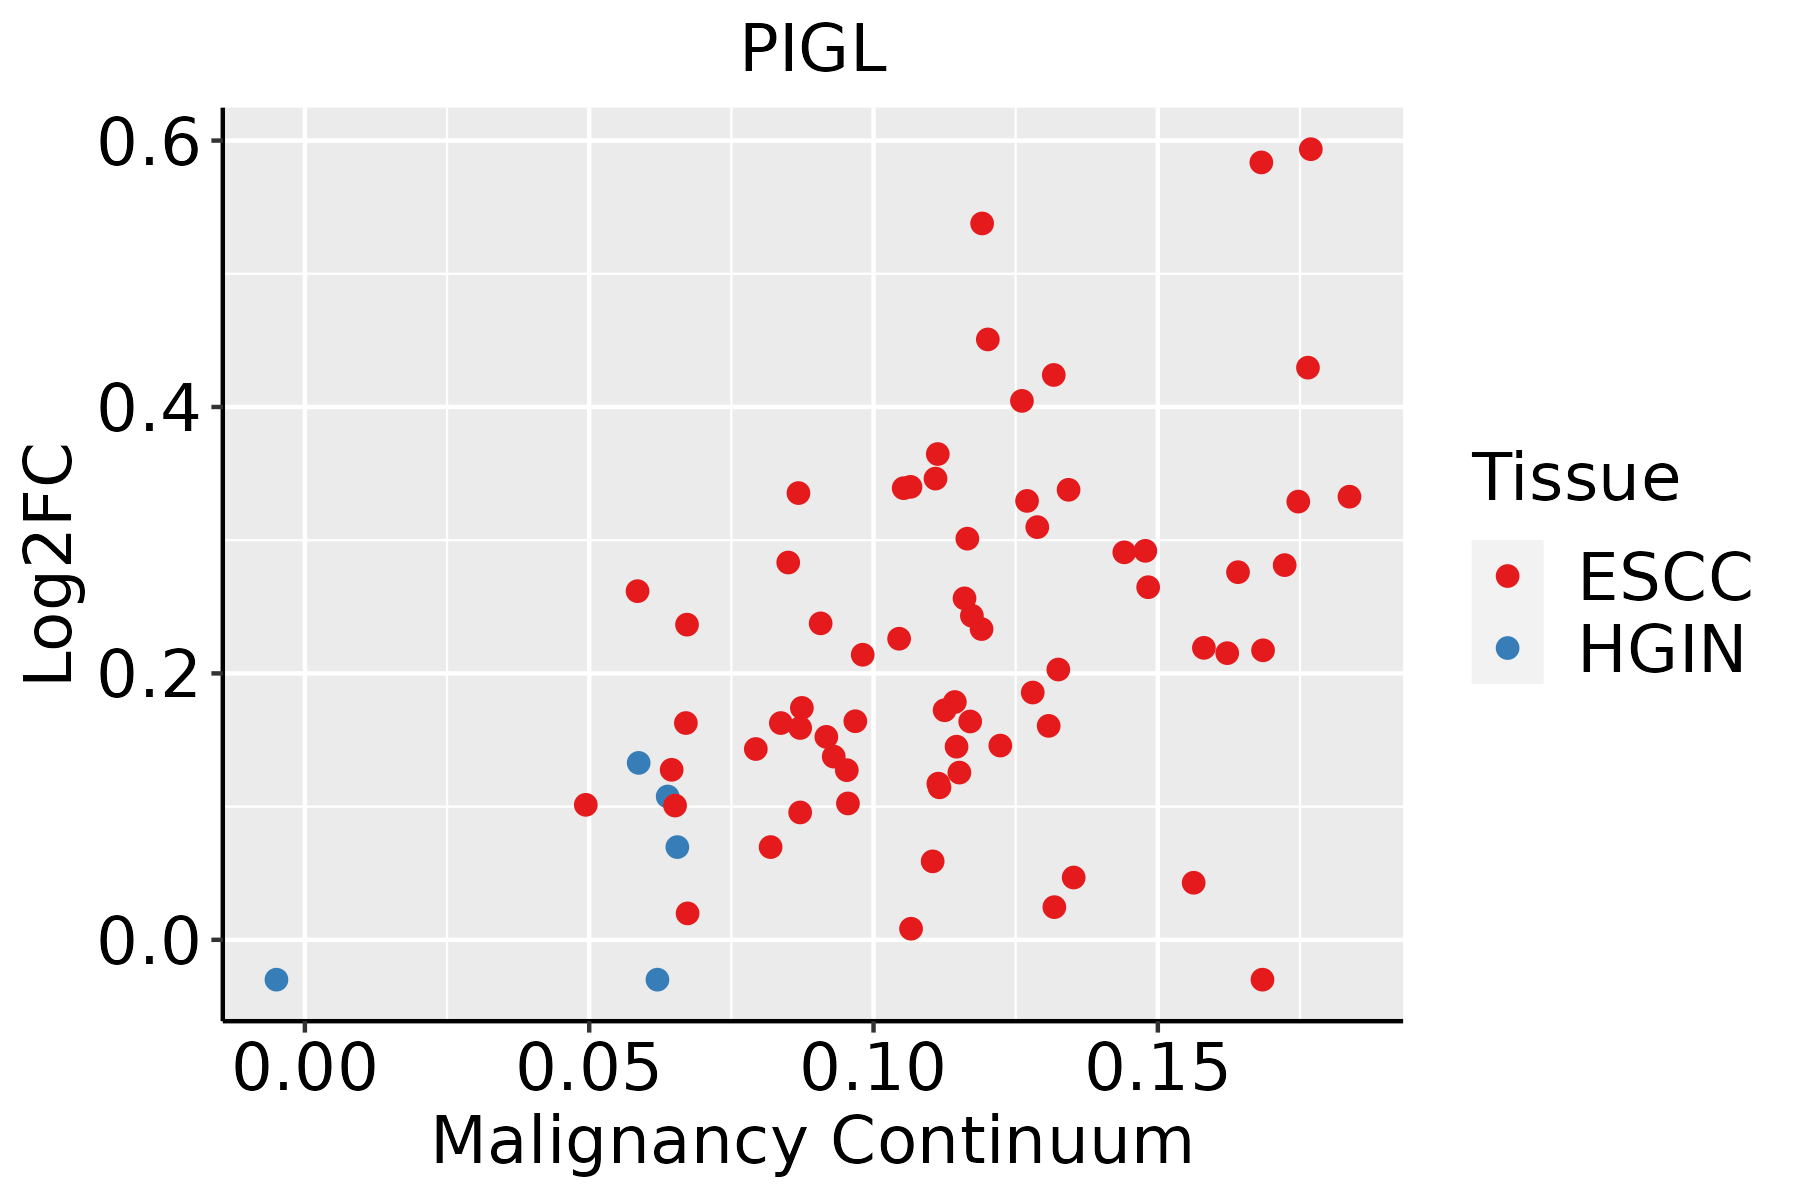 | ESCC: Esophageal squamous cell carcinoma |
| HGIN: High-grade intraepithelial neoplasias | ||
| LGIN: Low-grade intraepithelial neoplasias | ||
| Liver | 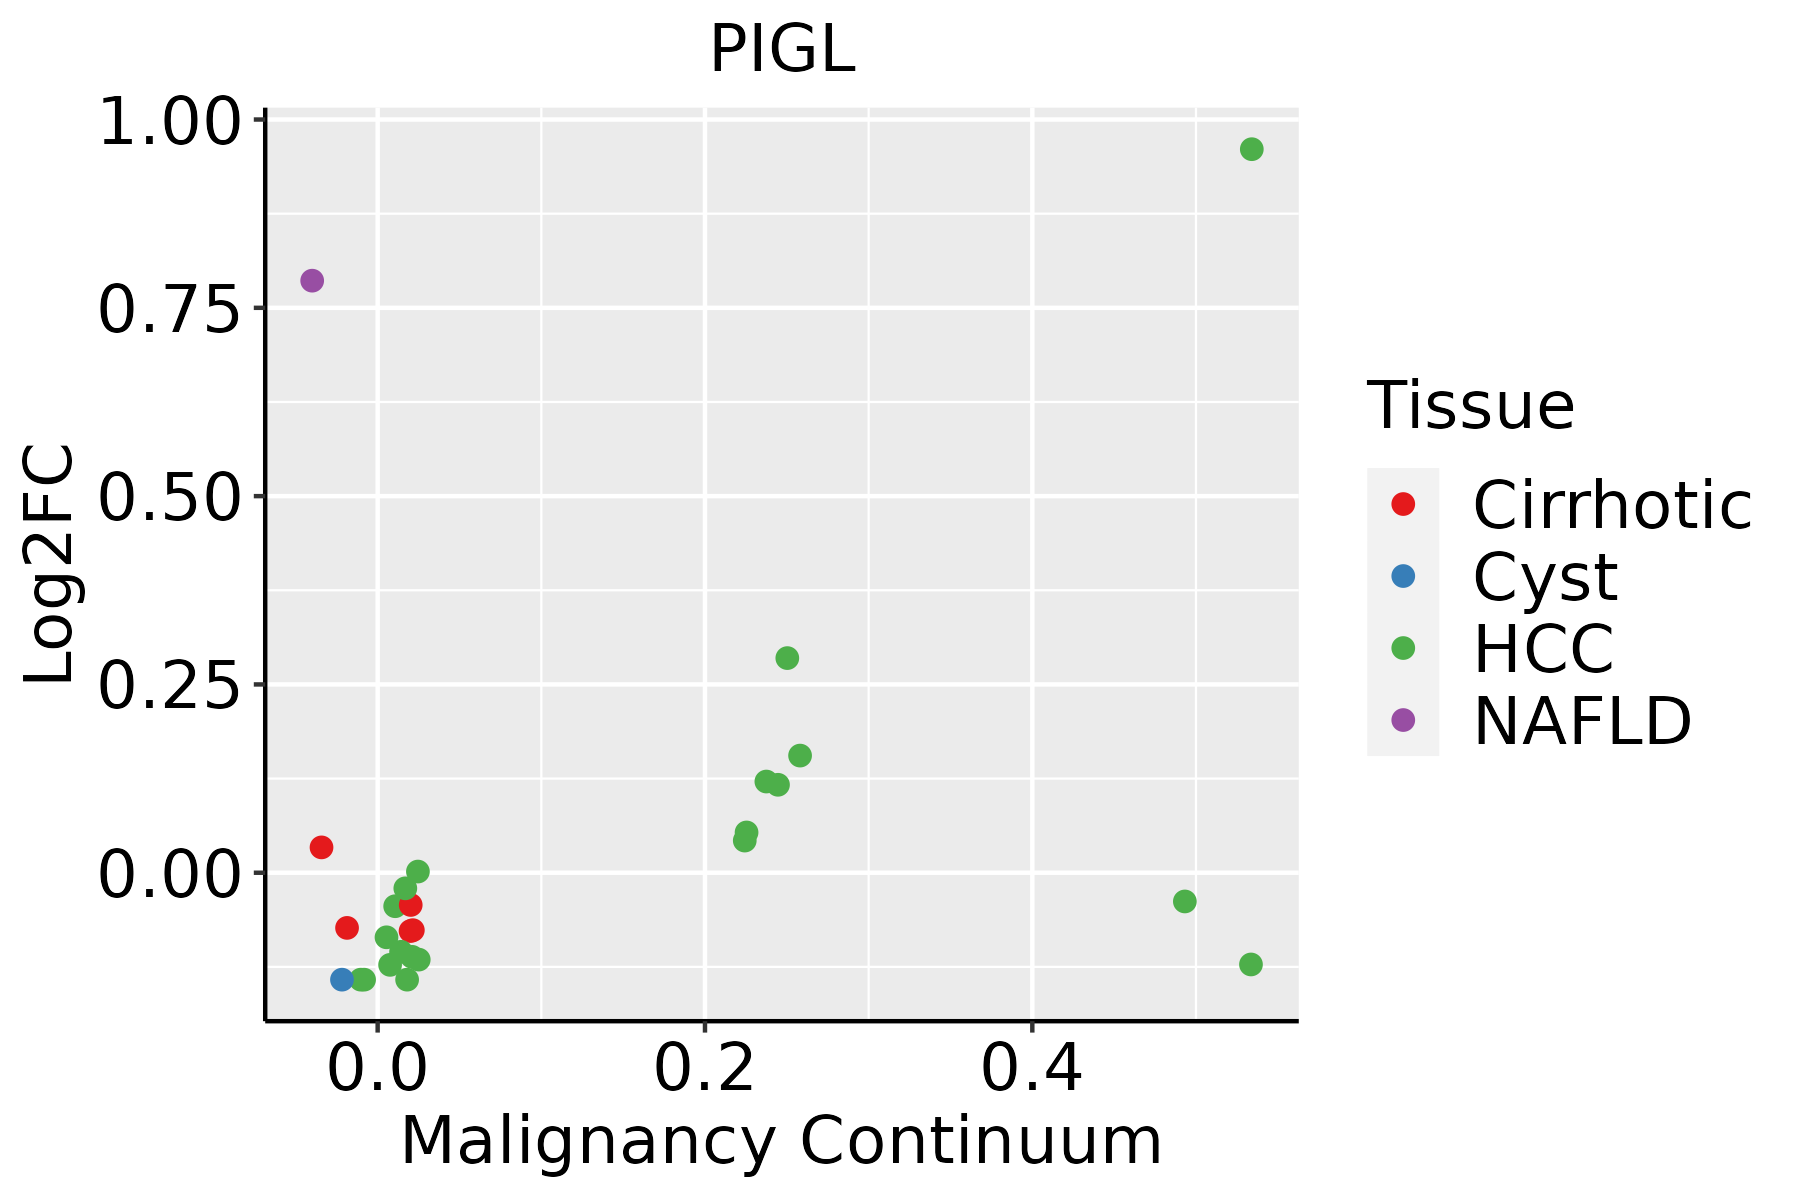 | HCC: Hepatocellular carcinoma |
| NAFLD: Non-alcoholic fatty liver disease |
| ∗log2FC in expression of this searched gene in stem-like cells from each diseased tissue sample relative to stem-like cells in normal samples in each tissue plotted against the malignancy continuum. Samples are colored based on if they are from different disease stage. |
Top |
Malignant transformation related pathway analysis |
| Find out the enriched GO biological processes and KEGG pathways involved in transition from healthy to precancer to cancer |
| Tissue | Disease Stage | Enriched GO biological Processes |
| Colorectum | AD |  |
| Colorectum | SER |  |
| Colorectum | MSS |  |
| Colorectum | MSI-H |  |
| Colorectum | FAP |  |
| ∗Top 15 enriched GO BP terms are showed in the bar plot of each disease state in each tissue. Each row represents a significant GO biological process which is colored according to the -log10(p.adjust). |
| Page: 1 2 3 4 5 6 7 8 9 |
| GO ID | Tissue | Disease Stage | Description | Gene Ratio | Bg Ratio | pvalue | p.adjust | Count |
| GO:00421573 | Esophagus | ESCC | lipoprotein metabolic process | 86/8552 | 135/18723 | 1.78e-05 | 1.57e-04 | 86 |
| GO:00064973 | Esophagus | ESCC | protein lipidation | 62/8552 | 92/18723 | 2.08e-05 | 1.80e-04 | 62 |
| GO:00421583 | Esophagus | ESCC | lipoprotein biosynthetic process | 64/8552 | 96/18723 | 2.61e-05 | 2.20e-04 | 64 |
| GO:00065063 | Esophagus | ESCC | GPI anchor biosynthetic process | 26/8552 | 32/18723 | 3.97e-05 | 3.21e-04 | 26 |
| GO:00066505 | Esophagus | ESCC | glycerophospholipid metabolic process | 174/8552 | 306/18723 | 4.92e-05 | 3.85e-04 | 174 |
| GO:00065053 | Esophagus | ESCC | GPI anchor metabolic process | 26/8552 | 33/18723 | 1.06e-04 | 7.43e-04 | 26 |
| GO:00066642 | Esophagus | ESCC | glycolipid metabolic process | 63/8552 | 100/18723 | 3.55e-04 | 2.06e-03 | 63 |
| GO:19035092 | Esophagus | ESCC | liposaccharide metabolic process | 63/8552 | 101/18723 | 5.25e-04 | 2.90e-03 | 63 |
| GO:00464864 | Esophagus | ESCC | glycerolipid metabolic process | 211/8552 | 392/18723 | 6.51e-04 | 3.46e-03 | 211 |
| GO:0009247 | Esophagus | ESCC | glycolipid biosynthetic process | 42/8552 | 68/18723 | 5.48e-03 | 2.05e-02 | 42 |
| GO:00066611 | Esophagus | ESCC | phosphatidylinositol biosynthetic process | 73/8552 | 131/18723 | 1.31e-02 | 4.28e-02 | 73 |
| GO:00464863 | Liver | NAFLD | glycerolipid metabolic process | 66/1882 | 392/18723 | 1.94e-05 | 5.52e-04 | 66 |
| GO:00450174 | Liver | NAFLD | glycerolipid biosynthetic process | 43/1882 | 252/18723 | 3.83e-04 | 5.73e-03 | 43 |
| GO:00464742 | Liver | NAFLD | glycerophospholipid biosynthetic process | 33/1882 | 211/18723 | 6.93e-03 | 4.88e-02 | 33 |
| GO:00086542 | Liver | HCC | phospholipid biosynthetic process | 150/7958 | 253/18723 | 4.77e-08 | 1.03e-06 | 150 |
| GO:00066444 | Liver | HCC | phospholipid metabolic process | 214/7958 | 383/18723 | 7.25e-08 | 1.48e-06 | 214 |
| GO:004648611 | Liver | HCC | glycerolipid metabolic process | 215/7958 | 392/18723 | 4.54e-07 | 7.49e-06 | 215 |
| GO:00421571 | Liver | HCC | lipoprotein metabolic process | 86/7958 | 135/18723 | 5.21e-07 | 8.38e-06 | 86 |
| GO:004501711 | Liver | HCC | glycerolipid biosynthetic process | 143/7958 | 252/18723 | 3.27e-06 | 4.31e-05 | 143 |
| GO:00066504 | Liver | HCC | glycerophospholipid metabolic process | 168/7958 | 306/18723 | 7.27e-06 | 8.62e-05 | 168 |
| Page: 1 2 3 |
| Pathway ID | Tissue | Disease Stage | Description | Gene Ratio | Bg Ratio | pvalue | p.adjust | qvalue | Count |
| hsa005632 | Esophagus | ESCC | Glycosylphosphatidylinositol (GPI)-anchor biosynthesis | 21/4205 | 26/8465 | 1.10e-03 | 3.42e-03 | 1.75e-03 | 21 |
| hsa0056311 | Esophagus | ESCC | Glycosylphosphatidylinositol (GPI)-anchor biosynthesis | 21/4205 | 26/8465 | 1.10e-03 | 3.42e-03 | 1.75e-03 | 21 |
| hsa00563 | Liver | HCC | Glycosylphosphatidylinositol (GPI)-anchor biosynthesis | 18/4020 | 26/8465 | 2.08e-02 | 4.81e-02 | 2.68e-02 | 18 |
| hsa005631 | Liver | HCC | Glycosylphosphatidylinositol (GPI)-anchor biosynthesis | 18/4020 | 26/8465 | 2.08e-02 | 4.81e-02 | 2.68e-02 | 18 |
| Page: 1 |
Top |
Cell-cell communication analysis |
| Identification of potential cell-cell interactions between two cell types and their ligand-receptor pairs for different disease states |
| Ligand | Receptor | LRpair | Pathway | Tissue | Disease Stage |
| Page: 1 |
Top |
Single-cell gene regulatory network inference analysis |
| Find out the significant the regulons (TFs) and the target genes of each regulon across cell types for different disease states |
| TF | Cell Type | Tissue | Disease Stage | Target Gene | RSS | Regulon Activity |
| ∗The dot plots of a searched regulon are shown for all cell subpopulations in each disease state of each tissue based on the regulon specific score inferred using pySCENIC and by calculating the average expression. |
| Page: 1 |
Top |
Somatic mutation of malignant transformation related genes |
| Annotation of somatic variants for genes involved in malignant transformation |
| Hugo Symbol | Variant Class | Variant Classification | dbSNP RS | HGVSc | HGVSp | HGVSp Short | SWISSPROT | BIOTYPE | SIFT | PolyPhen | Tumor Sample Barcode | Tissue | Histology | Sex | Age | Stage | Therapy Types | Drugs | Outcome |
| PIGL | SNV | Missense_Mutation | novel | c.146A>C | p.His49Pro | p.H49P | Q9Y2B2 | protein_coding | deleterious(0) | probably_damaging(1) | TCGA-AC-A23C-01 | Breast | breast invasive carcinoma | Female | <65 | I/II | Chemotherapy | chemo | CR |
| PIGL | SNV | Missense_Mutation | novel | c.607N>A | p.His203Asn | p.H203N | Q9Y2B2 | protein_coding | tolerated(0.3) | benign(0.01) | TCGA-AN-A046-01 | Breast | breast invasive carcinoma | Female | >=65 | I/II | Unknown | Unknown | SD |
| PIGL | SNV | Missense_Mutation | novel | c.146A>C | p.His49Pro | p.H49P | Q9Y2B2 | protein_coding | deleterious(0) | probably_damaging(1) | TCGA-AR-A1AY-01 | Breast | breast invasive carcinoma | Female | >=65 | I/II | Unspecific | Doxorubicin | SD |
| PIGL | SNV | Missense_Mutation | rs750654333 | c.725N>A | p.Arg242Gln | p.R242Q | Q9Y2B2 | protein_coding | deleterious(0) | probably_damaging(0.998) | TCGA-AP-A0LT-01 | Endometrium | uterine corpus endometrioid carcinoma | Female | <65 | I/II | Unknown | Unknown | SD |
| PIGL | SNV | Missense_Mutation | novel | c.352N>A | p.Pro118Thr | p.P118T | Q9Y2B2 | protein_coding | deleterious(0) | probably_damaging(0.994) | TCGA-AP-A1DK-01 | Endometrium | uterine corpus endometrioid carcinoma | Female | <65 | I/II | Unknown | Unknown | SD |
| PIGL | SNV | Missense_Mutation | novel | c.343N>T | p.Pro115Ser | p.P115S | Q9Y2B2 | protein_coding | deleterious(0) | probably_damaging(0.945) | TCGA-AX-A3FT-01 | Endometrium | uterine corpus endometrioid carcinoma | Female | <65 | I/II | Unknown | Unknown | SD |
| PIGL | SNV | Missense_Mutation | rs751560960 | c.163A>G | p.Met55Val | p.M55V | Q9Y2B2 | protein_coding | deleterious(0) | benign(0.278) | TCGA-D1-A175-01 | Endometrium | uterine corpus endometrioid carcinoma | Female | <65 | I/II | Chemotherapy | paclitaxel | SD |
| PIGL | SNV | Missense_Mutation | novel | c.160N>A | p.Ala54Thr | p.A54T | Q9Y2B2 | protein_coding | deleterious(0.02) | possibly_damaging(0.721) | TCGA-EO-A22R-01 | Endometrium | uterine corpus endometrioid carcinoma | Female | <65 | I/II | Unknown | Unknown | SD |
| PIGL | SNV | Missense_Mutation | novel | c.228N>A | p.Phe76Leu | p.F76L | Q9Y2B2 | protein_coding | tolerated(0.98) | benign(0.007) | TCGA-EO-A3B0-01 | Endometrium | uterine corpus endometrioid carcinoma | Female | <65 | III/IV | Unknown | Unknown | SD |
| PIGL | SNV | Missense_Mutation | c.462N>A | p.His154Gln | p.H154Q | Q9Y2B2 | protein_coding | deleterious(0) | probably_damaging(0.999) | TCGA-MI-A75C-01 | Liver | liver hepatocellular carcinoma | Male | <65 | I/II | Unknown | Unknown | SD |
| Page: 1 2 3 |
Top |
Related drugs of malignant transformation related genes |
| Identification of chemicals and drugs interact with genes involved in malignant transfromation |
| (DGIdb 4.0) |
| Entrez ID | Symbol | Category | Interaction Types | Drug Claim Name | Drug Name | PMIDs |
| Page: 1 |

Copyright 2023-Present -The University of Texas Health Science Center at Houston |