
|
|||||
|
 | |
| |
| |
| |
| |
| |
|
Gene: PID1 |
Gene summary for PID1 |
| Gene information | Species | Human | Gene symbol | PID1 | Gene ID | 55022 |
| Gene name | phosphotyrosine interaction domain containing 1 | |
| Gene Alias | HMFN2073 | |
| Cytomap | 2q36.3 | |
| Gene Type | protein-coding | GO ID | GO:0001932 | UniProtAcc | Q7Z2X4 |
Top |
Malignant transformation analysis |
| Identification of the aberrant gene expression in precancerous and cancerous lesions by comparing the gene expression of stem-like cells in diseased tissues with normal stem cells |
| Entrez ID | Symbol | Replicates | Species | Organ | Tissue | Adj P-value | Log2FC | Malignancy |
| 55022 | PID1 | HTA11_3410_2000001011 | Human | Colorectum | AD | 2.27e-18 | -6.95e-01 | 0.0155 |
| 55022 | PID1 | HTA11_2487_2000001011 | Human | Colorectum | SER | 3.75e-03 | -4.58e-01 | -0.1808 |
| 55022 | PID1 | HTA11_347_2000001011 | Human | Colorectum | AD | 6.87e-12 | 7.05e-01 | -0.1954 |
| 55022 | PID1 | HTA11_3361_2000001011 | Human | Colorectum | AD | 2.85e-08 | -7.99e-01 | -0.1207 |
| 55022 | PID1 | HTA11_866_3004761011 | Human | Colorectum | AD | 5.41e-05 | -5.51e-01 | 0.096 |
| 55022 | PID1 | HTA11_4255_2000001011 | Human | Colorectum | SER | 4.85e-02 | -7.30e-01 | 0.0446 |
| 55022 | PID1 | HTA11_8622_2000001021 | Human | Colorectum | SER | 5.52e-04 | -7.72e-01 | 0.0528 |
| 55022 | PID1 | HTA11_10711_2000001011 | Human | Colorectum | AD | 1.13e-07 | -7.06e-01 | 0.0338 |
| 55022 | PID1 | HTA11_7696_3000711011 | Human | Colorectum | AD | 4.55e-20 | -6.83e-01 | 0.0674 |
| 55022 | PID1 | HTA11_7469_2000001011 | Human | Colorectum | AD | 1.93e-03 | -3.82e-01 | -0.0124 |
| 55022 | PID1 | HTA11_99999970781_79442 | Human | Colorectum | MSS | 1.44e-44 | -9.88e-01 | 0.294 |
| 55022 | PID1 | HTA11_99999971662_82457 | Human | Colorectum | MSS | 8.41e-43 | -1.01e+00 | 0.3859 |
| 55022 | PID1 | HTA11_99999973899_84307 | Human | Colorectum | MSS | 8.46e-07 | -7.97e-01 | 0.2585 |
| 55022 | PID1 | HTA11_99999974143_84620 | Human | Colorectum | MSS | 9.35e-39 | -9.09e-01 | 0.3005 |
| 55022 | PID1 | A001-C-207 | Human | Colorectum | FAP | 3.23e-03 | -4.05e-01 | 0.1278 |
| 55022 | PID1 | A015-C-203 | Human | Colorectum | FAP | 1.39e-27 | -6.74e-01 | -0.1294 |
| 55022 | PID1 | A015-C-204 | Human | Colorectum | FAP | 7.98e-06 | -4.06e-01 | -0.0228 |
| 55022 | PID1 | A014-C-040 | Human | Colorectum | FAP | 8.80e-05 | -5.88e-01 | -0.1184 |
| 55022 | PID1 | A002-C-201 | Human | Colorectum | FAP | 2.51e-12 | -5.07e-01 | 0.0324 |
| 55022 | PID1 | A001-C-119 | Human | Colorectum | FAP | 9.03e-17 | -8.31e-01 | -0.1557 |
| Page: 1 2 3 |
| Tissue | Expression Dynamics | Abbreviation |
| Colorectum (GSE201348) |  | FAP: Familial adenomatous polyposis |
| CRC: Colorectal cancer | ||
| Colorectum (HTA11) |  | AD: Adenomas |
| SER: Sessile serrated lesions | ||
| MSI-H: Microsatellite-high colorectal cancer | ||
| MSS: Microsatellite stable colorectal cancer | ||
| Lung | 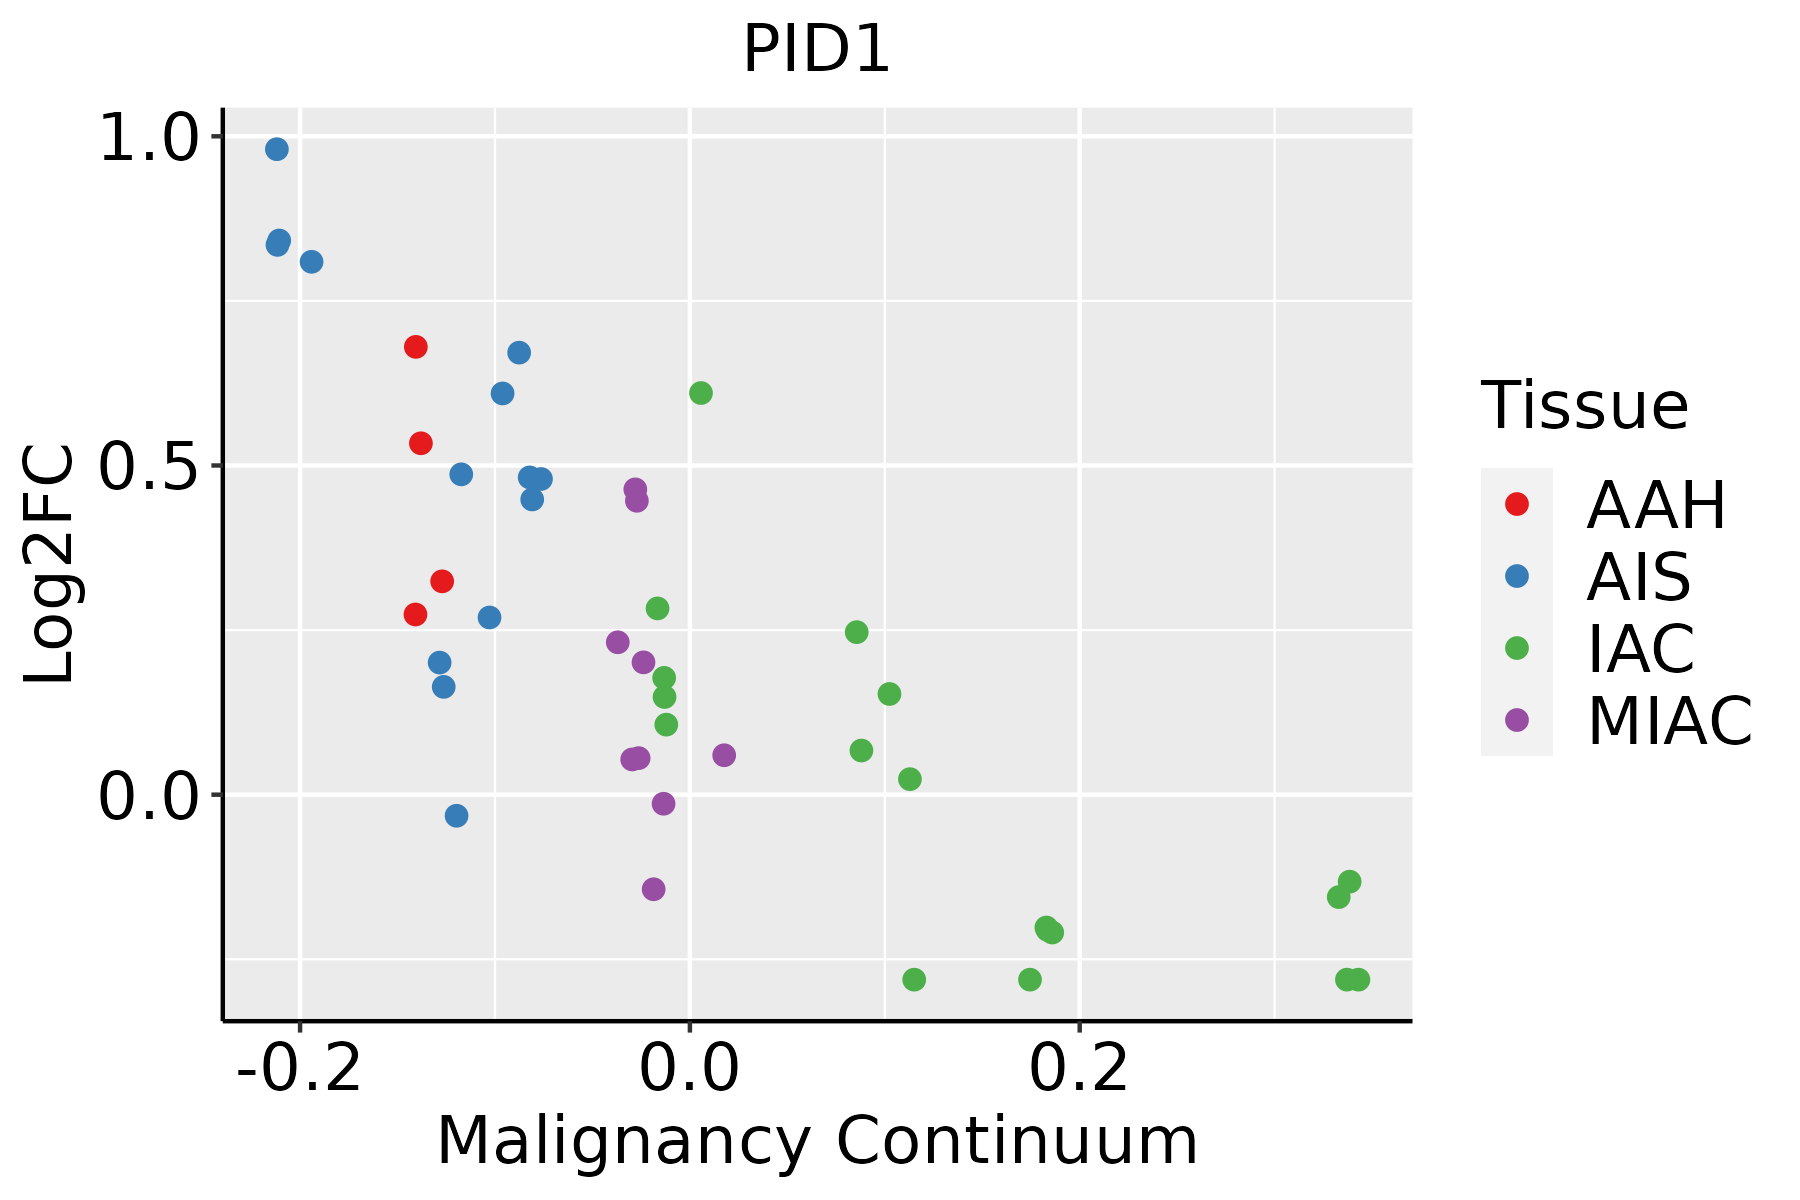 | AAH: Atypical adenomatous hyperplasia |
| AIS: Adenocarcinoma in situ | ||
| IAC: Invasive lung adenocarcinoma | ||
| MIA: Minimally invasive adenocarcinoma |
| ∗log2FC in expression of this searched gene in stem-like cells from each diseased tissue sample relative to stem-like cells in normal samples in each tissue plotted against the malignancy continuum. Samples are colored based on if they are from different disease stage. |
Top |
Malignant transformation related pathway analysis |
| Find out the enriched GO biological processes and KEGG pathways involved in transition from healthy to precancer to cancer |
| Tissue | Disease Stage | Enriched GO biological Processes |
| Colorectum | AD |  |
| Colorectum | SER |  |
| Colorectum | MSS |  |
| Colorectum | MSI-H |  |
| Colorectum | FAP |  |
| ∗Top 15 enriched GO BP terms are showed in the bar plot of each disease state in each tissue. Each row represents a significant GO biological process which is colored according to the -log10(p.adjust). |
| Page: 1 2 3 4 5 6 7 8 9 |
| GO ID | Tissue | Disease Stage | Description | Gene Ratio | Bg Ratio | pvalue | p.adjust | Count |
| GO:0032868 | Colorectum | AD | response to insulin | 91/3918 | 264/18723 | 2.02e-07 | 8.48e-06 | 91 |
| GO:0010821 | Colorectum | AD | regulation of mitochondrion organization | 57/3918 | 144/18723 | 2.43e-07 | 9.92e-06 | 57 |
| GO:0009199 | Colorectum | AD | ribonucleoside triphosphate metabolic process | 40/3918 | 89/18723 | 3.04e-07 | 1.21e-05 | 40 |
| GO:0009152 | Colorectum | AD | purine ribonucleotide biosynthetic process | 64/3918 | 169/18723 | 3.09e-07 | 1.22e-05 | 64 |
| GO:0009206 | Colorectum | AD | purine ribonucleoside triphosphate biosynthetic process | 33/3918 | 68/18723 | 3.68e-07 | 1.43e-05 | 33 |
| GO:1901653 | Colorectum | AD | cellular response to peptide | 114/3918 | 359/18723 | 8.32e-07 | 2.88e-05 | 114 |
| GO:0032869 | Colorectum | AD | cellular response to insulin stimulus | 72/3918 | 203/18723 | 1.10e-06 | 3.68e-05 | 72 |
| GO:0009201 | Colorectum | AD | ribonucleoside triphosphate biosynthetic process | 34/3918 | 74/18723 | 1.23e-06 | 4.01e-05 | 34 |
| GO:0009260 | Colorectum | AD | ribonucleotide biosynthetic process | 66/3918 | 182/18723 | 1.25e-06 | 4.02e-05 | 66 |
| GO:0071375 | Colorectum | AD | cellular response to peptide hormone stimulus | 95/3918 | 290/18723 | 1.50e-06 | 4.66e-05 | 95 |
| GO:0009142 | Colorectum | AD | nucleoside triphosphate biosynthetic process | 37/3918 | 85/18723 | 2.16e-06 | 6.35e-05 | 37 |
| GO:0043434 | Colorectum | AD | response to peptide hormone | 126/3918 | 414/18723 | 2.70e-06 | 7.86e-05 | 126 |
| GO:0046390 | Colorectum | AD | ribose phosphate biosynthetic process | 67/3918 | 190/18723 | 3.21e-06 | 9.05e-05 | 67 |
| GO:0006164 | Colorectum | AD | purine nucleotide biosynthetic process | 66/3918 | 191/18723 | 8.22e-06 | 1.97e-04 | 66 |
| GO:0072522 | Colorectum | AD | purine-containing compound biosynthetic process | 68/3918 | 200/18723 | 1.12e-05 | 2.55e-04 | 68 |
| GO:0010563 | Colorectum | AD | negative regulation of phosphorus metabolic process | 130/3918 | 442/18723 | 1.26e-05 | 2.76e-04 | 130 |
| GO:0045936 | Colorectum | AD | negative regulation of phosphate metabolic process | 129/3918 | 441/18723 | 1.81e-05 | 3.76e-04 | 129 |
| GO:1901293 | Colorectum | AD | nucleoside phosphate biosynthetic process | 80/3918 | 256/18723 | 6.31e-05 | 1.05e-03 | 80 |
| GO:0042326 | Colorectum | AD | negative regulation of phosphorylation | 112/3918 | 385/18723 | 8.02e-05 | 1.27e-03 | 112 |
| GO:1903578 | Colorectum | AD | regulation of ATP metabolic process | 34/3918 | 87/18723 | 8.30e-05 | 1.30e-03 | 34 |
| Page: 1 2 3 4 5 6 7 8 9 10 11 12 13 14 15 16 17 18 19 |
| Pathway ID | Tissue | Disease Stage | Description | Gene Ratio | Bg Ratio | pvalue | p.adjust | qvalue | Count |
| Page: 1 |
Top |
Cell-cell communication analysis |
| Identification of potential cell-cell interactions between two cell types and their ligand-receptor pairs for different disease states |
| Ligand | Receptor | LRpair | Pathway | Tissue | Disease Stage |
| Page: 1 |
Top |
Single-cell gene regulatory network inference analysis |
| Find out the significant the regulons (TFs) and the target genes of each regulon across cell types for different disease states |
| TF | Cell Type | Tissue | Disease Stage | Target Gene | RSS | Regulon Activity |
| ∗The dot plots of a searched regulon are shown for all cell subpopulations in each disease state of each tissue based on the regulon specific score inferred using pySCENIC and by calculating the average expression. |
| Page: 1 |
Top |
Somatic mutation of malignant transformation related genes |
| Annotation of somatic variants for genes involved in malignant transformation |
| Hugo Symbol | Variant Class | Variant Classification | dbSNP RS | HGVSc | HGVSp | HGVSp Short | SWISSPROT | BIOTYPE | SIFT | PolyPhen | Tumor Sample Barcode | Tissue | Histology | Sex | Age | Stage | Therapy Types | Drugs | Outcome |
| PID1 | SNV | Missense_Mutation | rs374635933 | c.640N>A | p.Ala214Thr | p.A214T | Q7Z2X4 | protein_coding | tolerated(0.22) | benign(0.141) | TCGA-BH-A0HW-01 | Breast | breast invasive carcinoma | Female | <65 | I/II | Chemotherapy | doxorubicin | SD |
| PID1 | SNV | Missense_Mutation | novel | c.64C>A | p.Leu22Ile | p.L22I | Q7Z2X4 | protein_coding | tolerated_low_confidence(0.1) | benign(0) | TCGA-D8-A27V-01 | Breast | breast invasive carcinoma | Female | <65 | I/II | Hormone Therapy | tamoxiphen | SD |
| PID1 | SNV | Missense_Mutation | novel | c.95G>A | p.Arg32His | p.R32H | Q7Z2X4 | protein_coding | deleterious_low_confidence(0.01) | benign(0) | TCGA-2W-A8YY-01 | Cervix | cervical & endocervical cancer | Female | <65 | I/II | Chemotherapy | cisplatin | CR |
| PID1 | SNV | Missense_Mutation | c.209N>C | p.Glu70Ala | p.E70A | Q7Z2X4 | protein_coding | deleterious_low_confidence(0.01) | probably_damaging(0.98) | TCGA-EA-A3HQ-01 | Cervix | cervical & endocervical cancer | Female | <65 | I/II | Unknown | Unknown | SD | |
| PID1 | SNV | Missense_Mutation | novel | c.619G>A | p.Glu207Lys | p.E207K | Q7Z2X4 | protein_coding | tolerated(0.63) | probably_damaging(0.951) | TCGA-EA-A97N-01 | Cervix | cervical & endocervical cancer | Female | <65 | I/II | Unknown | Unknown | SD |
| PID1 | SNV | Missense_Mutation | c.471N>A | p.His157Gln | p.H157Q | Q7Z2X4 | protein_coding | deleterious(0.01) | benign(0.313) | TCGA-EK-A2PL-01 | Cervix | cervical & endocervical cancer | Female | <65 | III/IV | Unknown | Unknown | SD | |
| PID1 | SNV | Missense_Mutation | rs267599242 | c.118G>A | p.Glu40Lys | p.E40K | Q7Z2X4 | protein_coding | deleterious_low_confidence(0.02) | benign(0) | TCGA-AA-3977-01 | Colorectum | colon adenocarcinoma | Male | >=65 | I/II | Unknown | Unknown | SD |
| PID1 | SNV | Missense_Mutation | novel | c.22N>T | p.Arg8Cys | p.R8C | Q7Z2X4 | protein_coding | deleterious_low_confidence(0.01) | possibly_damaging(0.835) | TCGA-AY-6197-01 | Colorectum | colon adenocarcinoma | Male | <65 | I/II | Unknown | Unknown | SD |
| PID1 | SNV | Missense_Mutation | c.511N>A | p.Ala171Thr | p.A171T | Q7Z2X4 | protein_coding | deleterious(0) | probably_damaging(0.997) | TCGA-AZ-6601-01 | Colorectum | colon adenocarcinoma | Male | >=65 | I/II | Unknown | Unknown | PD | |
| PID1 | SNV | Missense_Mutation | rs756817470 | c.415N>T | p.Arg139Trp | p.R139W | Q7Z2X4 | protein_coding | deleterious(0.01) | probably_damaging(0.998) | TCGA-D5-6930-01 | Colorectum | colon adenocarcinoma | Male | >=65 | I/II | Unknown | Unknown | SD |
| Page: 1 2 3 4 5 6 |
Top |
Related drugs of malignant transformation related genes |
| Identification of chemicals and drugs interact with genes involved in malignant transfromation |
| (DGIdb 4.0) |
| Entrez ID | Symbol | Category | Interaction Types | Drug Claim Name | Drug Name | PMIDs |
| Page: 1 |

Copyright 2023-Present -The University of Texas Health Science Center at Houston |