| Tissue | Expression Dynamics | Abbreviation |
| Breast | 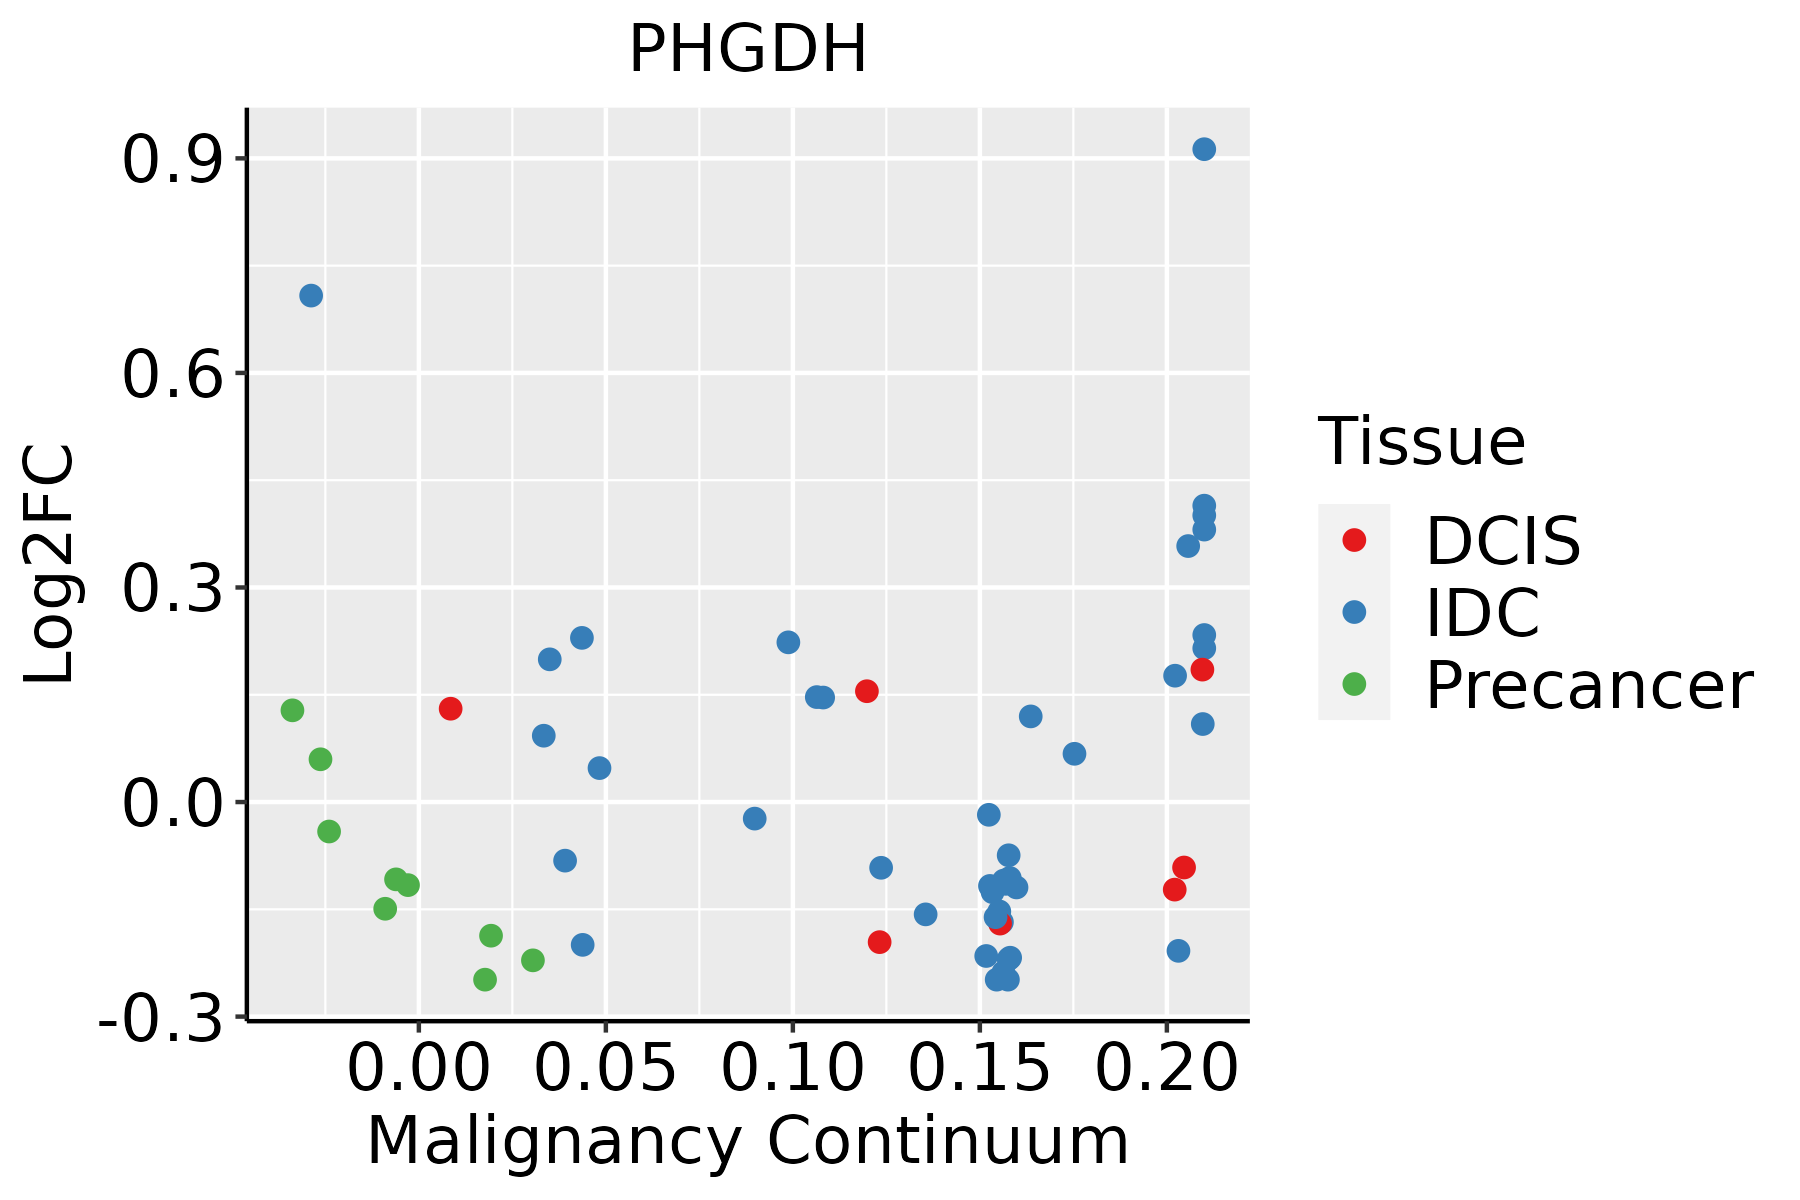 | IDC: Invasive ductal carcinoma |
| DCIS: Ductal carcinoma in situ |
| Precancer(BRCA1-mut): Precancerous lesion from BRCA1 mutation carriers |
| Esophagus |  | ESCC: Esophageal squamous cell carcinoma |
| HGIN: High-grade intraepithelial neoplasias |
| LGIN: Low-grade intraepithelial neoplasias |
| Liver | 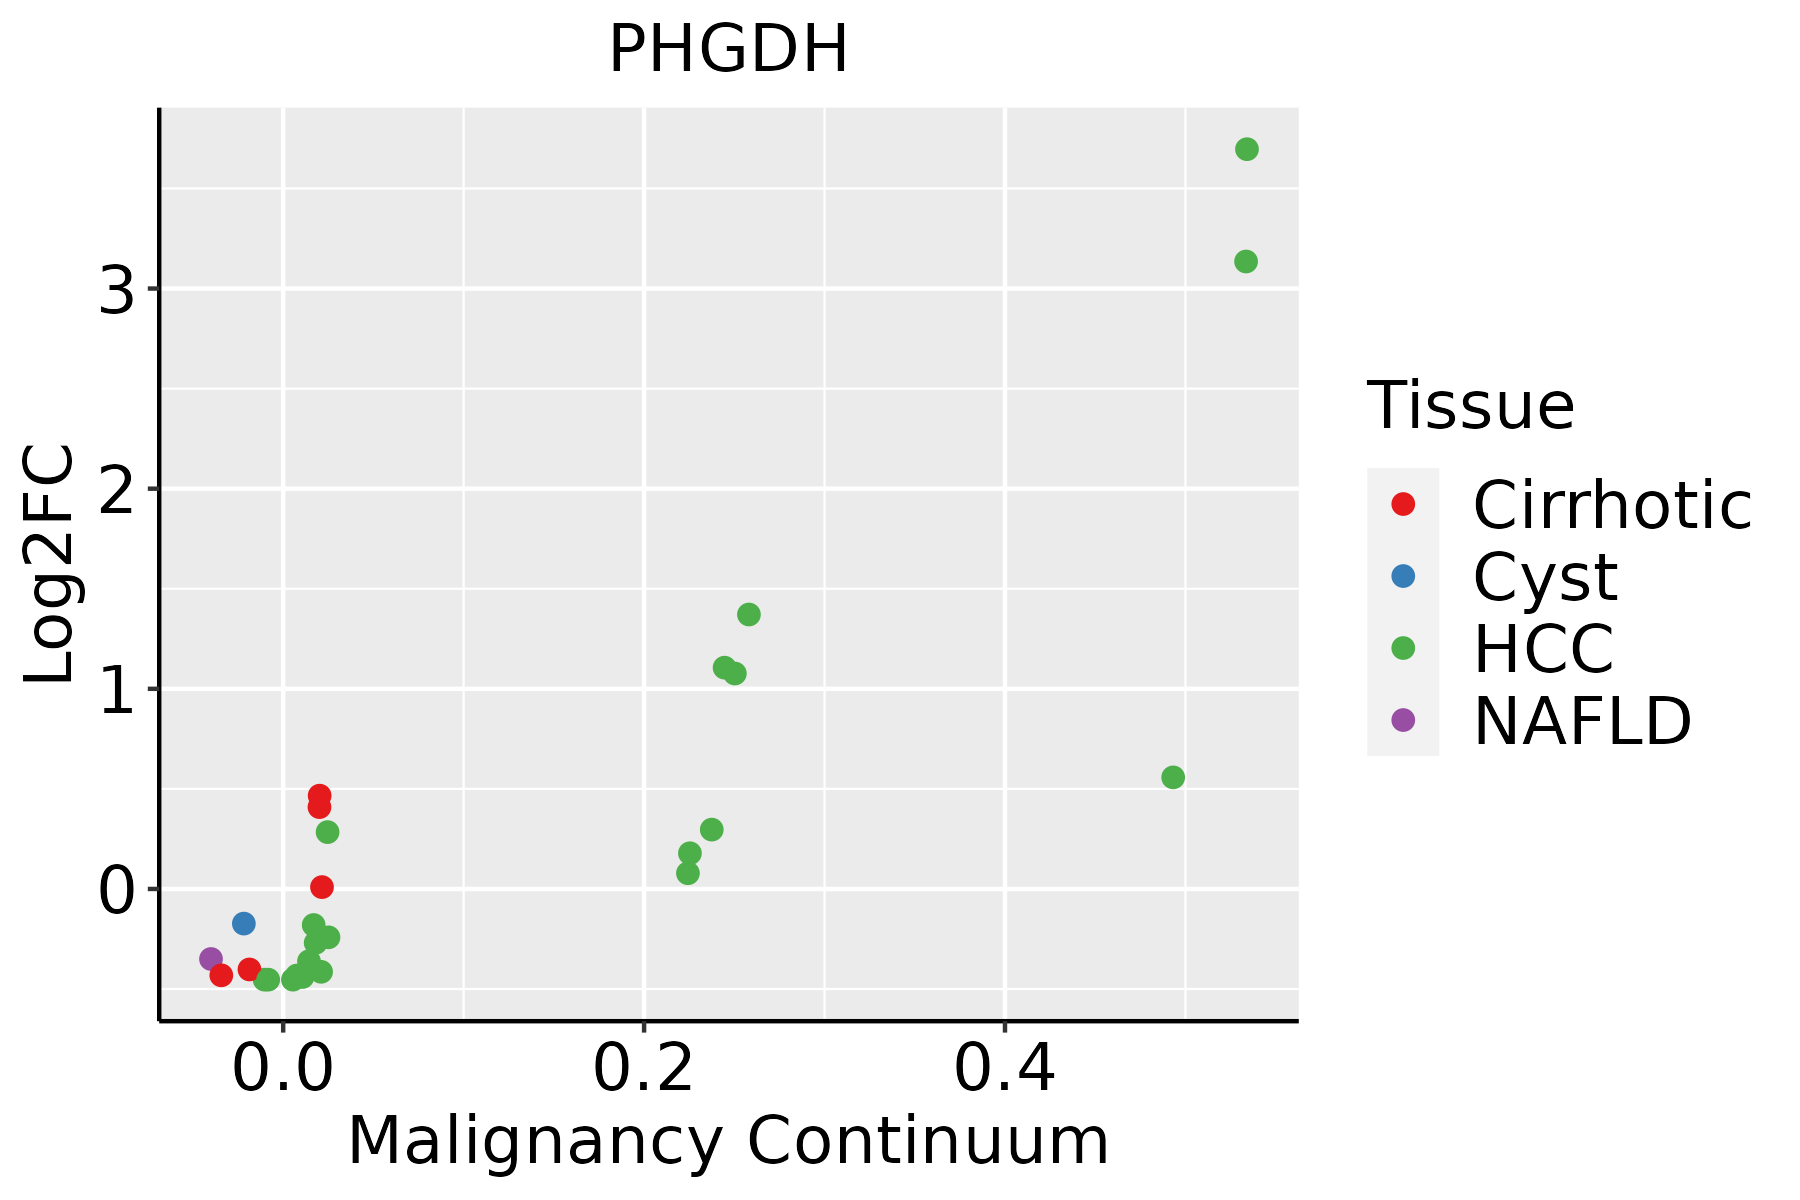 | HCC: Hepatocellular carcinoma |
| NAFLD: Non-alcoholic fatty liver disease |
| Oral Cavity |  | EOLP: Erosive Oral lichen planus |
| LP: leukoplakia |
| NEOLP: Non-erosive oral lichen planus |
| OSCC: Oral squamous cell carcinoma |
| Skin |  | AK: Actinic keratosis |
| cSCC: Cutaneous squamous cell carcinoma |
| SCCIS:squamous cell carcinoma in situ |
| Thyroid | 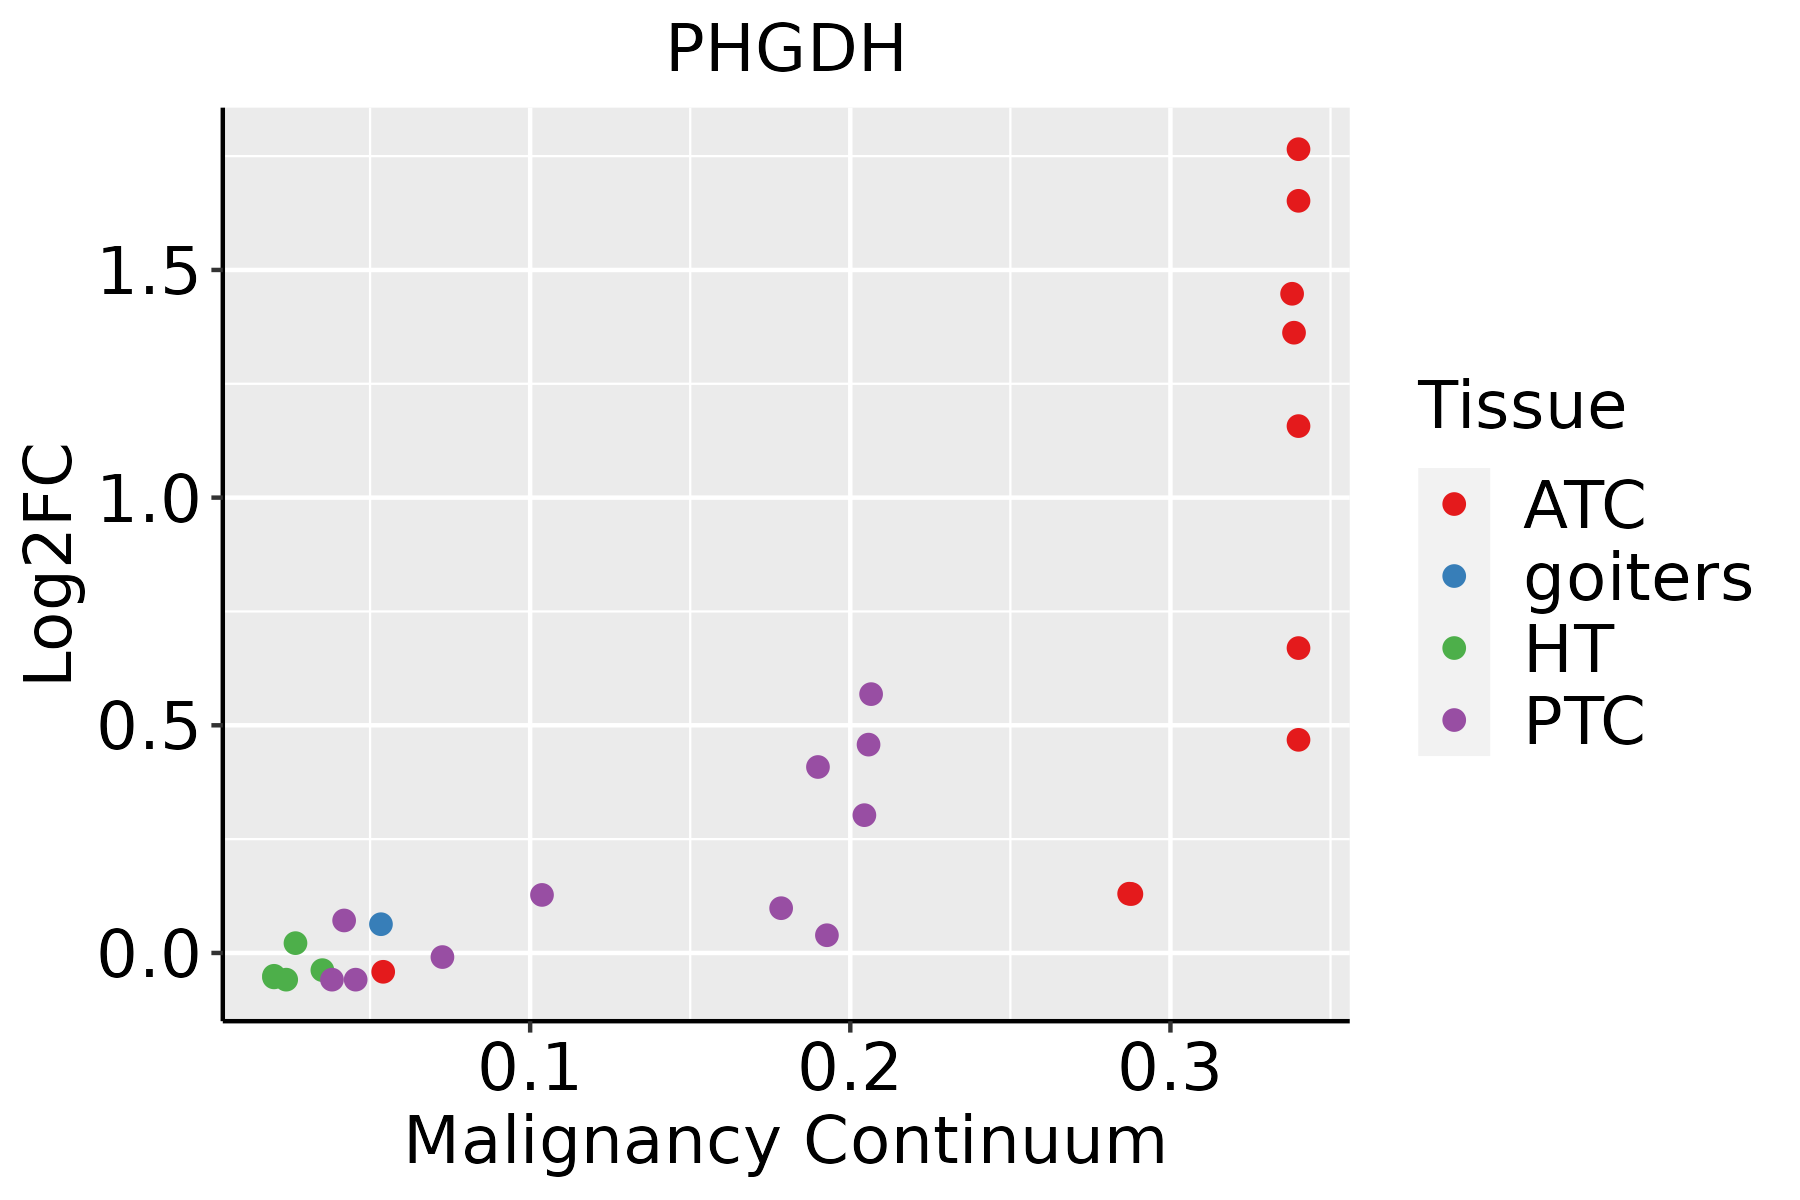 | ATC: Anaplastic thyroid cancer |
| HT: Hashimoto's thyroiditis |
| PTC: Papillary thyroid cancer |
| GO ID | Tissue | Disease Stage | Description | Gene Ratio | Bg Ratio | pvalue | p.adjust | Count |
| GO:00160538 | Esophagus | ESCC | organic acid biosynthetic process | 175/8552 | 316/18723 | 3.04e-04 | 1.82e-03 | 175 |
| GO:19016075 | Esophagus | ESCC | alpha-amino acid biosynthetic process | 45/8552 | 68/18723 | 5.13e-04 | 2.84e-03 | 45 |
| GO:000609112 | Liver | Cirrhotic | generation of precursor metabolites and energy | 238/4634 | 490/18723 | 6.85e-31 | 1.07e-27 | 238 |
| GO:002290012 | Liver | Cirrhotic | electron transport chain | 111/4634 | 175/18723 | 1.94e-27 | 1.52e-24 | 111 |
| GO:001605312 | Liver | Cirrhotic | organic acid biosynthetic process | 139/4634 | 316/18723 | 4.28e-14 | 3.83e-12 | 139 |
| GO:004639412 | Liver | Cirrhotic | carboxylic acid biosynthetic process | 137/4634 | 314/18723 | 1.40e-13 | 1.14e-11 | 137 |
| GO:000679011 | Liver | Cirrhotic | sulfur compound metabolic process | 129/4634 | 339/18723 | 3.06e-08 | 1.04e-06 | 129 |
| GO:19016051 | Liver | Cirrhotic | alpha-amino acid metabolic process | 82/4634 | 195/18723 | 7.72e-08 | 2.30e-06 | 82 |
| GO:000652011 | Liver | Cirrhotic | cellular amino acid metabolic process | 103/4634 | 284/18723 | 8.88e-06 | 1.30e-04 | 103 |
| GO:00086521 | Liver | Cirrhotic | cellular amino acid biosynthetic process | 36/4634 | 76/18723 | 1.55e-05 | 2.11e-04 | 36 |
| GO:19016071 | Liver | Cirrhotic | alpha-amino acid biosynthetic process | 33/4634 | 68/18723 | 1.84e-05 | 2.49e-04 | 33 |
| GO:00090691 | Liver | Cirrhotic | serine family amino acid metabolic process | 22/4634 | 40/18723 | 4.04e-05 | 4.82e-04 | 22 |
| GO:0042063 | Liver | Cirrhotic | gliogenesis | 98/4634 | 301/18723 | 1.28e-03 | 8.60e-03 | 98 |
| GO:0006544 | Liver | Cirrhotic | glycine metabolic process | 10/4634 | 16/18723 | 1.51e-03 | 9.91e-03 | 10 |
| GO:0010001 | Liver | Cirrhotic | glial cell differentiation | 75/4634 | 225/18723 | 2.24e-03 | 1.36e-02 | 75 |
| GO:00090661 | Liver | Cirrhotic | aspartate family amino acid metabolic process | 21/4634 | 49/18723 | 4.13e-03 | 2.21e-02 | 21 |
| GO:000609122 | Liver | HCC | generation of precursor metabolites and energy | 340/7958 | 490/18723 | 4.04e-34 | 2.85e-31 | 340 |
| GO:002290022 | Liver | HCC | electron transport chain | 134/7958 | 175/18723 | 3.32e-20 | 4.68e-18 | 134 |
| GO:001605321 | Liver | HCC | organic acid biosynthetic process | 200/7958 | 316/18723 | 5.24e-14 | 3.22e-12 | 200 |
| GO:000679021 | Liver | HCC | sulfur compound metabolic process | 212/7958 | 339/18723 | 5.60e-14 | 3.39e-12 | 212 |
| Pathway ID | Tissue | Disease Stage | Description | Gene Ratio | Bg Ratio | pvalue | p.adjust | qvalue | Count |
| hsa0120023 | Esophagus | ESCC | Carbon metabolism | 79/4205 | 115/8465 | 2.50e-05 | 1.21e-04 | 6.22e-05 | 79 |
| hsa0123023 | Esophagus | ESCC | Biosynthesis of amino acids | 49/4205 | 75/8465 | 4.35e-03 | 1.12e-02 | 5.74e-03 | 49 |
| hsa0120033 | Esophagus | ESCC | Carbon metabolism | 79/4205 | 115/8465 | 2.50e-05 | 1.21e-04 | 6.22e-05 | 79 |
| hsa0123033 | Esophagus | ESCC | Biosynthesis of amino acids | 49/4205 | 75/8465 | 4.35e-03 | 1.12e-02 | 5.74e-03 | 49 |
| hsa0120021 | Liver | Cirrhotic | Carbon metabolism | 64/2530 | 115/8465 | 6.37e-09 | 1.18e-07 | 7.26e-08 | 64 |
| hsa00270 | Liver | Cirrhotic | Cysteine and methionine metabolism | 27/2530 | 52/8465 | 6.98e-04 | 4.15e-03 | 2.56e-03 | 27 |
| hsa00260 | Liver | Cirrhotic | Glycine, serine and threonine metabolism | 22/2530 | 40/8465 | 7.85e-04 | 4.51e-03 | 2.78e-03 | 22 |
| hsa012304 | Liver | Cirrhotic | Biosynthesis of amino acids | 35/2530 | 75/8465 | 1.54e-03 | 7.83e-03 | 4.83e-03 | 35 |
| hsa0120031 | Liver | Cirrhotic | Carbon metabolism | 64/2530 | 115/8465 | 6.37e-09 | 1.18e-07 | 7.26e-08 | 64 |
| hsa002701 | Liver | Cirrhotic | Cysteine and methionine metabolism | 27/2530 | 52/8465 | 6.98e-04 | 4.15e-03 | 2.56e-03 | 27 |
| hsa002601 | Liver | Cirrhotic | Glycine, serine and threonine metabolism | 22/2530 | 40/8465 | 7.85e-04 | 4.51e-03 | 2.78e-03 | 22 |
| hsa0123011 | Liver | Cirrhotic | Biosynthesis of amino acids | 35/2530 | 75/8465 | 1.54e-03 | 7.83e-03 | 4.83e-03 | 35 |
| hsa0120041 | Liver | HCC | Carbon metabolism | 89/4020 | 115/8465 | 3.92e-11 | 6.56e-10 | 3.65e-10 | 89 |
| hsa0123021 | Liver | HCC | Biosynthesis of amino acids | 53/4020 | 75/8465 | 3.79e-05 | 2.11e-04 | 1.18e-04 | 53 |
| hsa002702 | Liver | HCC | Cysteine and methionine metabolism | 35/4020 | 52/8465 | 3.03e-03 | 9.94e-03 | 5.53e-03 | 35 |
| hsa002602 | Liver | HCC | Glycine, serine and threonine metabolism | 28/4020 | 40/8465 | 3.28e-03 | 1.07e-02 | 5.93e-03 | 28 |
| hsa0120051 | Liver | HCC | Carbon metabolism | 89/4020 | 115/8465 | 3.92e-11 | 6.56e-10 | 3.65e-10 | 89 |
| hsa0123031 | Liver | HCC | Biosynthesis of amino acids | 53/4020 | 75/8465 | 3.79e-05 | 2.11e-04 | 1.18e-04 | 53 |
| hsa002703 | Liver | HCC | Cysteine and methionine metabolism | 35/4020 | 52/8465 | 3.03e-03 | 9.94e-03 | 5.53e-03 | 35 |
| hsa002603 | Liver | HCC | Glycine, serine and threonine metabolism | 28/4020 | 40/8465 | 3.28e-03 | 1.07e-02 | 5.93e-03 | 28 |
| Hugo Symbol | Variant Class | Variant Classification | dbSNP RS | HGVSc | HGVSp | HGVSp Short | SWISSPROT | BIOTYPE | SIFT | PolyPhen | Tumor Sample Barcode | Tissue | Histology | Sex | Age | Stage | Therapy Types | Drugs | Outcome |
| PHGDH | insertion | In_Frame_Ins | novel | c.51_52insCGTAACTTTCCAAGTCTG | p.Pro17_Cys18insArgAsnPheProSerLeu | p.P17_C18insRNFPSL | O43175 | protein_coding | | | TCGA-A8-A06P-01 | Breast | breast invasive carcinoma | Female | <65 | III/IV | Unspecific | | SD |
| PHGDH | insertion | Nonsense_Mutation | novel | c.882_883insATAATCCCCACAGTAATGTTATGAGGGAGATAGGATCAACCCA | p.Cys295IlefsTer8 | p.C295Ifs*8 | O43175 | protein_coding | | | TCGA-A8-A07J-01 | Breast | breast invasive carcinoma | Female | <65 | I/II | Chemotherapy | 5-fluorouracil | CR |
| PHGDH | insertion | Nonsense_Mutation | novel | c.80_81insATTTTCTTTTTGATAGTCGAATTCCCTTCAACGTCTA | p.Leu28PhefsTer4 | p.L28Ffs*4 | O43175 | protein_coding | | | TCGA-A8-A08H-01 | Breast | breast invasive carcinoma | Female | >=65 | I/II | Unknown | Unknown | SD |
| PHGDH | SNV | Missense_Mutation | novel | c.686N>C | p.Val229Ala | p.V229A | O43175 | protein_coding | deleterious(0) | probably_damaging(0.98) | TCGA-AA-3811-01 | Colorectum | colon adenocarcinoma | Female | >=65 | III/IV | Unknown | Unknown | PD |
| PHGDH | SNV | Missense_Mutation | | c.1162G>A | p.Val388Met | p.V388M | O43175 | protein_coding | tolerated(0.11) | benign(0.071) | TCGA-AA-A022-01 | Colorectum | colon adenocarcinoma | Female | >=65 | I/II | Unknown | Unknown | SD |
| PHGDH | deletion | Frame_Shift_Del | novel | c.654delN | p.Asn218LysfsTer15 | p.N218Kfs*15 | O43175 | protein_coding | | | TCGA-AY-4070-01 | Colorectum | colon adenocarcinoma | Female | <65 | III/IV | Chemotherapy | 5-fu | PD |
| PHGDH | SNV | Missense_Mutation | novel | c.625N>A | p.Leu209Ile | p.L209I | O43175 | protein_coding | deleterious(0) | probably_damaging(0.992) | TCGA-A5-A0G2-01 | Endometrium | uterine corpus endometrioid carcinoma | Female | <65 | III/IV | Unknown | Unknown | SD |
| PHGDH | SNV | Missense_Mutation | novel | c.764N>T | p.Ala255Val | p.A255V | O43175 | protein_coding | deleterious(0.01) | possibly_damaging(0.611) | TCGA-A5-A0G2-01 | Endometrium | uterine corpus endometrioid carcinoma | Female | <65 | III/IV | Unknown | Unknown | SD |
| PHGDH | SNV | Missense_Mutation | rs200693896 | c.1450N>T | p.Leu484Phe | p.L484F | O43175 | protein_coding | tolerated(0.06) | possibly_damaging(0.799) | TCGA-A5-A0GP-01 | Endometrium | uterine corpus endometrioid carcinoma | Female | <65 | I/II | Unknown | Unknown | SD |
| PHGDH | SNV | Missense_Mutation | rs142988234 | c.262N>A | p.Ala88Thr | p.A88T | O43175 | protein_coding | deleterious(0.02) | probably_damaging(0.997) | TCGA-A5-A1OK-01 | Endometrium | uterine corpus endometrioid carcinoma | Female | <65 | III/IV | Chemotherapy | taxol | SD |


