Schematic overview of the cellular and molecular mechanisms involved in the cancer progression, including the proposed cellular and molecular mechanisms in cancer cells trajectory. AT1: alveolar type 1 cells; AT2: alveolar type 2 cells; AAH: atypical adenomatous hyperplasia; AIS: adenocarcinoma in situ; MIA: minimally invasive adenocarcinoma; IA: invasive adenocarcinoma; EMT: epithelial-mesenchymal transition

Home

Download

Statistics

Help

Contact

Center for Computational Systems Medicine
leaf

Gene summary

leaf

Malignant transformation analysis

leaf

Malignant transformation related pathway analysis

leaf

Cell-cell communication analysis

leaf

Single-cell gene regulatory network inference analysis

leaf

Somatic mutation of malignant transformation related genes

leaf

Related drugs of malignant transformation related genes

Gene: PES1

Gene summary for PES1

check button Gene summary.

Gene informationSpeciesHuman
Gene symbol

PES1

Gene ID

23481

Gene namepescadillo ribosomal biogenesis factor 1
Gene AliasNOP7
Cytomap22q12.2
Gene Typeprotein-coding
GO ID

GO:0000460

UniProtAcc

O00541


Top

Malignant transformation analysis

check button Identification of the aberrant gene expression in precancerous and cancerous lesions by comparing the gene expression of stem-like cells in diseased tissues with normal stem cells
check button Malignant transformation involving gene list.
Entrez IDSymbolReplicatesSpeciesOrganTissueAdj P-valueLog2FCMalignancy
23481PES1LZE2THumanEsophagusESCC9.83e-058.98e-010.082
23481PES1LZE4THumanEsophagusESCC1.18e-102.96e-010.0811
23481PES1LZE7THumanEsophagusESCC2.68e-056.13e-010.0667
23481PES1LZE8THumanEsophagusESCC1.10e-032.40e-010.067
23481PES1LZE24THumanEsophagusESCC2.12e-093.59e-010.0596
23481PES1LZE6THumanEsophagusESCC3.78e-042.18e-010.0845
23481PES1P1T-EHumanEsophagusESCC1.69e-043.89e-010.0875
23481PES1P2T-EHumanEsophagusESCC3.90e-264.30e-010.1177
23481PES1P4T-EHumanEsophagusESCC1.62e-175.36e-010.1323
23481PES1P5T-EHumanEsophagusESCC3.24e-162.51e-010.1327
23481PES1P8T-EHumanEsophagusESCC1.33e-254.93e-010.0889
23481PES1P9T-EHumanEsophagusESCC3.52e-205.98e-010.1131
23481PES1P10T-EHumanEsophagusESCC8.09e-591.04e+000.116
23481PES1P11T-EHumanEsophagusESCC1.34e-116.81e-010.1426
23481PES1P12T-EHumanEsophagusESCC8.52e-365.40e-010.1122
23481PES1P15T-EHumanEsophagusESCC3.35e-277.33e-010.1149
23481PES1P16T-EHumanEsophagusESCC3.77e-388.25e-010.1153
23481PES1P17T-EHumanEsophagusESCC4.56e-076.66e-010.1278
23481PES1P19T-EHumanEsophagusESCC5.15e-089.21e-010.1662
23481PES1P20T-EHumanEsophagusESCC3.68e-134.30e-010.1124
Page: 1 2 3 4 5 6 

check button Transcriptomic changes along malignancy continuum.
TissueExpression DynamicsAbbreviation
EsophagusThe image shows the transcriptomic changes along malignancy continuum.log2FC in expression of this searched gene in stem-like cells from each diseased tissue sample relative to stem-like cells in normal samples in each tissue plotted against the malignancy continuum. Samples are colored based on if they are from different disease stage.
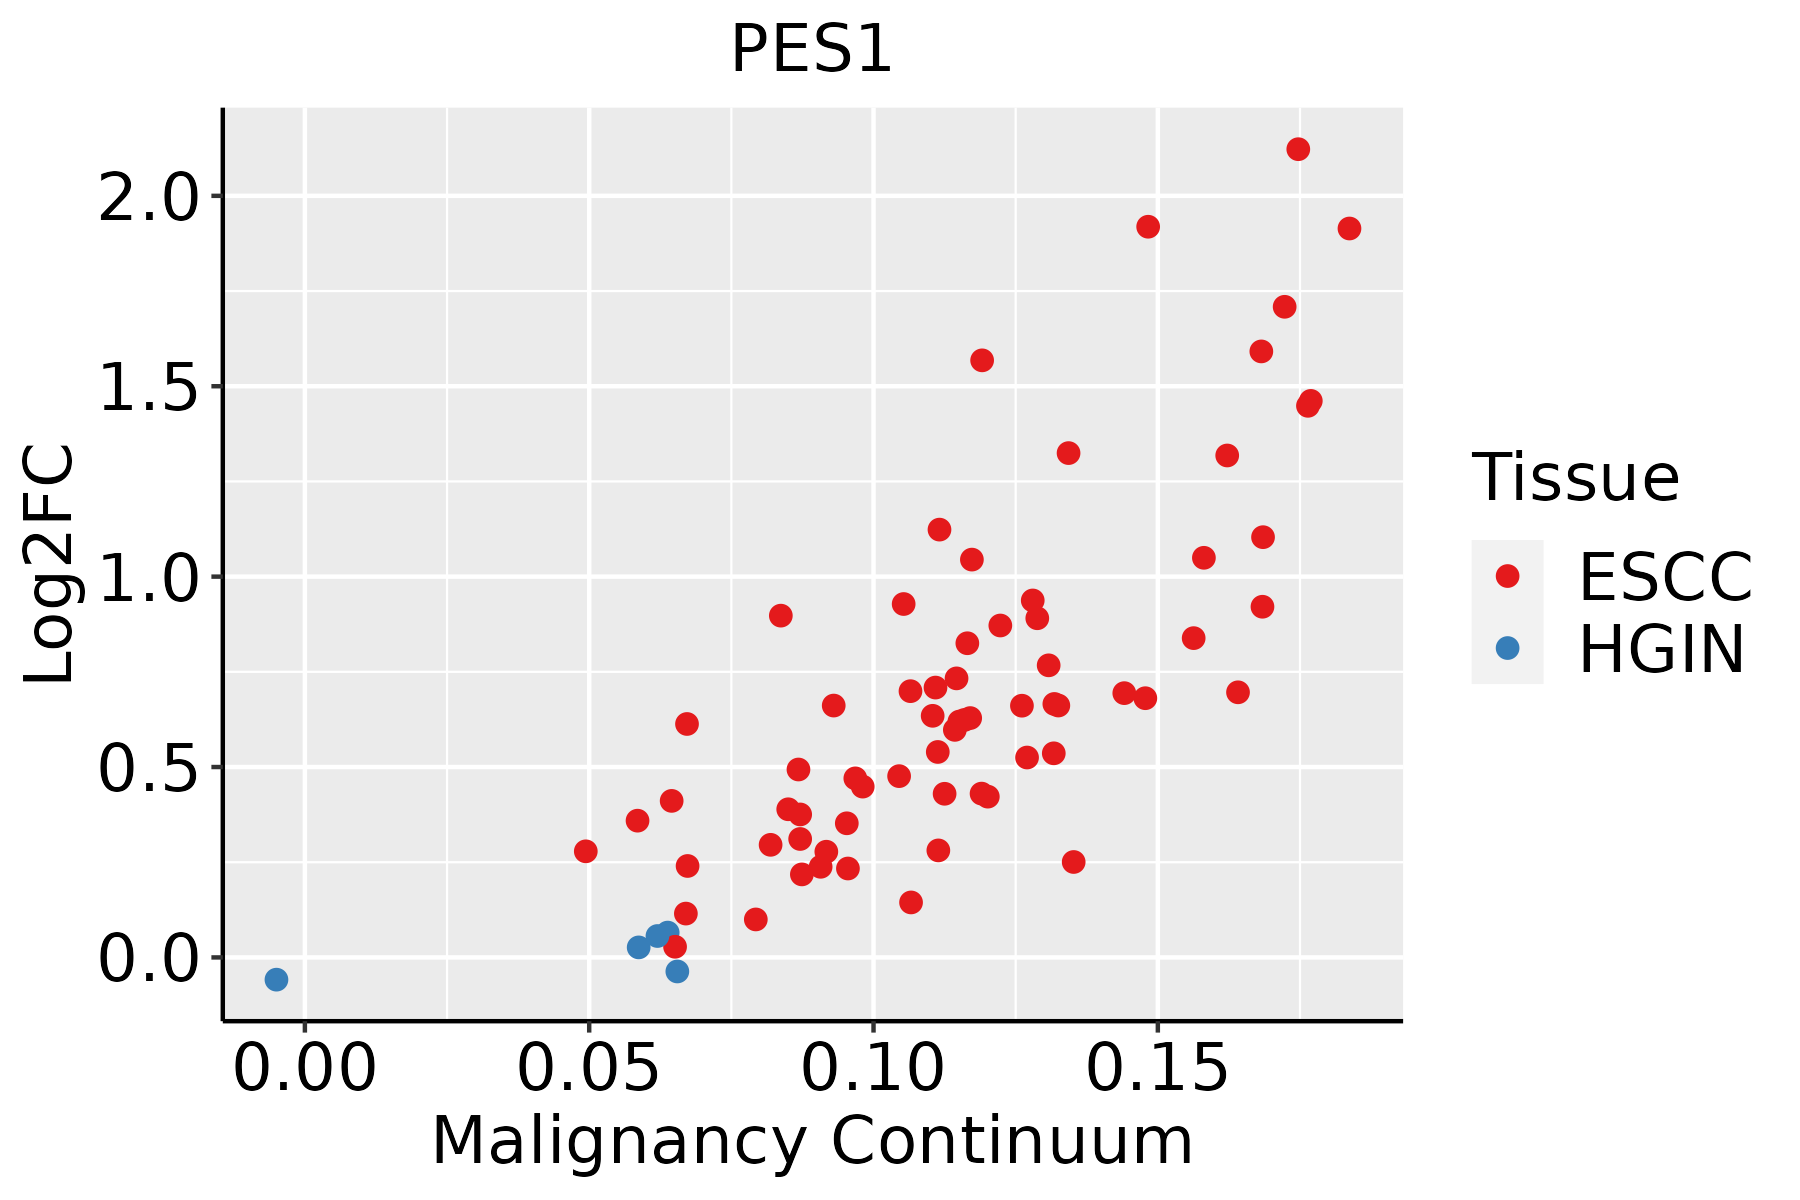
ESCC: Esophageal squamous cell carcinoma
HGIN: High-grade intraepithelial neoplasias
LGIN: Low-grade intraepithelial neoplasias
LiverThe image shows the transcriptomic changes along malignancy continuum.log2FC in expression of this searched gene in stem-like cells from each diseased tissue sample relative to stem-like cells in normal samples in each tissue plotted against the malignancy continuum. Samples are colored based on if they are from different disease stage.
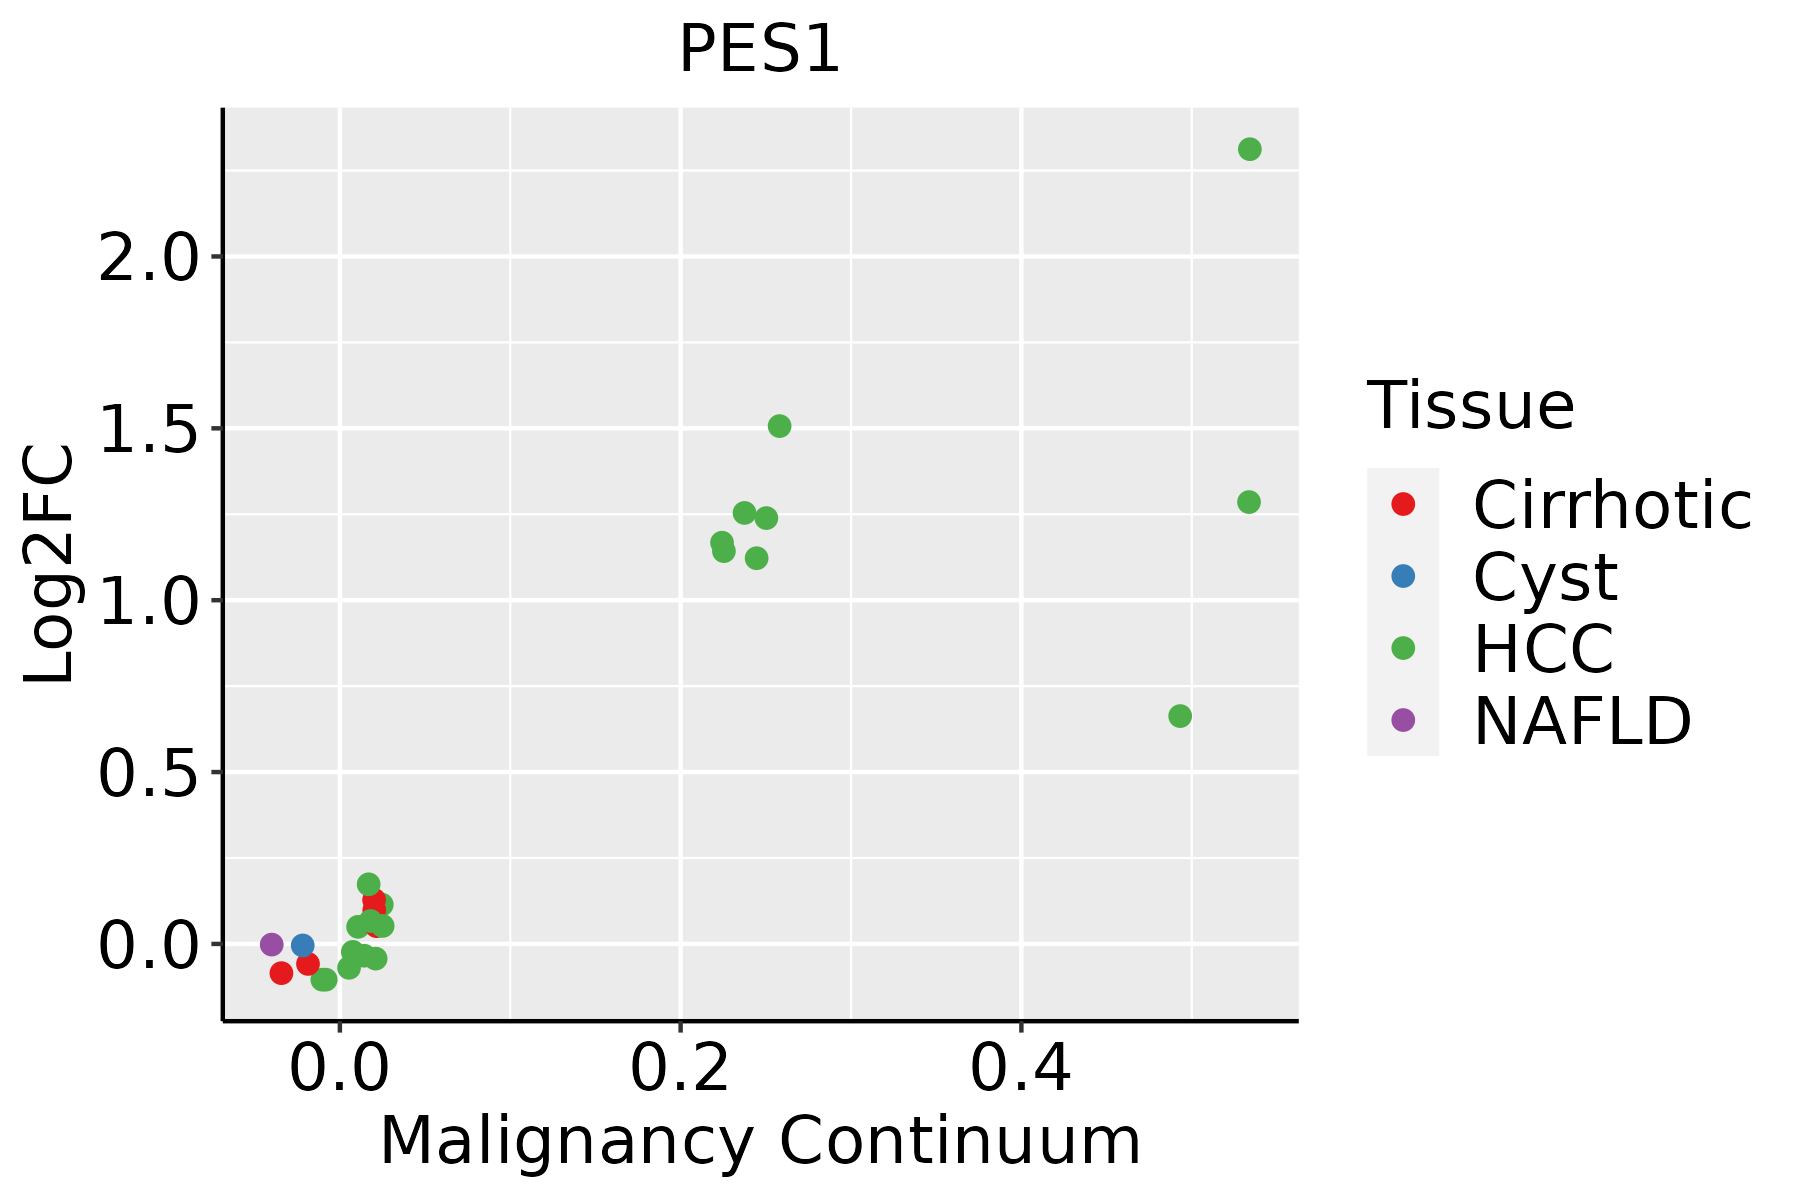
HCC: Hepatocellular carcinoma
NAFLD: Non-alcoholic fatty liver disease
Oral CavityThe image shows the transcriptomic changes along malignancy continuum.log2FC in expression of this searched gene in stem-like cells from each diseased tissue sample relative to stem-like cells in normal samples in each tissue plotted against the malignancy continuum. Samples are colored based on if they are from different disease stage.
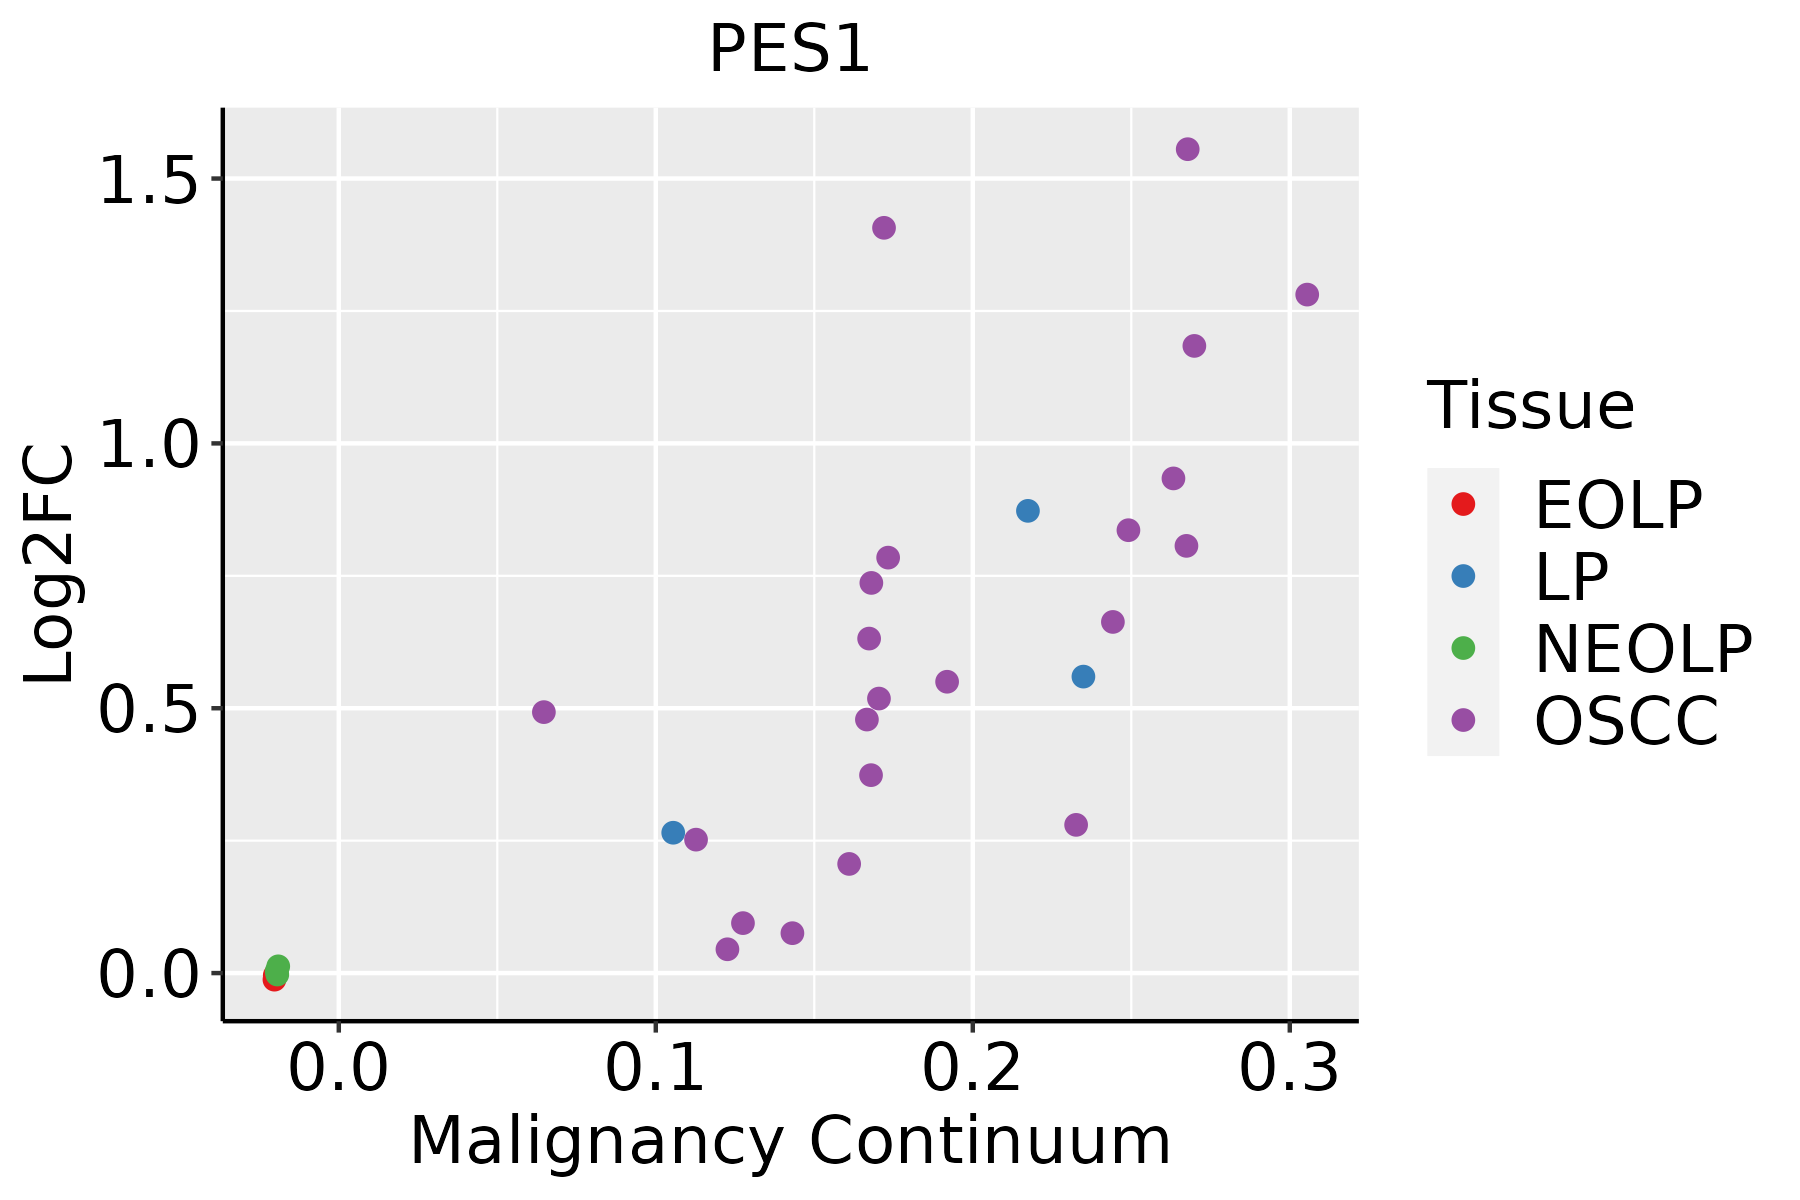
EOLP: Erosive Oral lichen planus
LP: leukoplakia
NEOLP: Non-erosive oral lichen planus
OSCC: Oral squamous cell carcinoma
SkinThe image shows the transcriptomic changes along malignancy continuum.log2FC in expression of this searched gene in stem-like cells from each diseased tissue sample relative to stem-like cells in normal samples in each tissue plotted against the malignancy continuum. Samples are colored based on if they are from different disease stage.
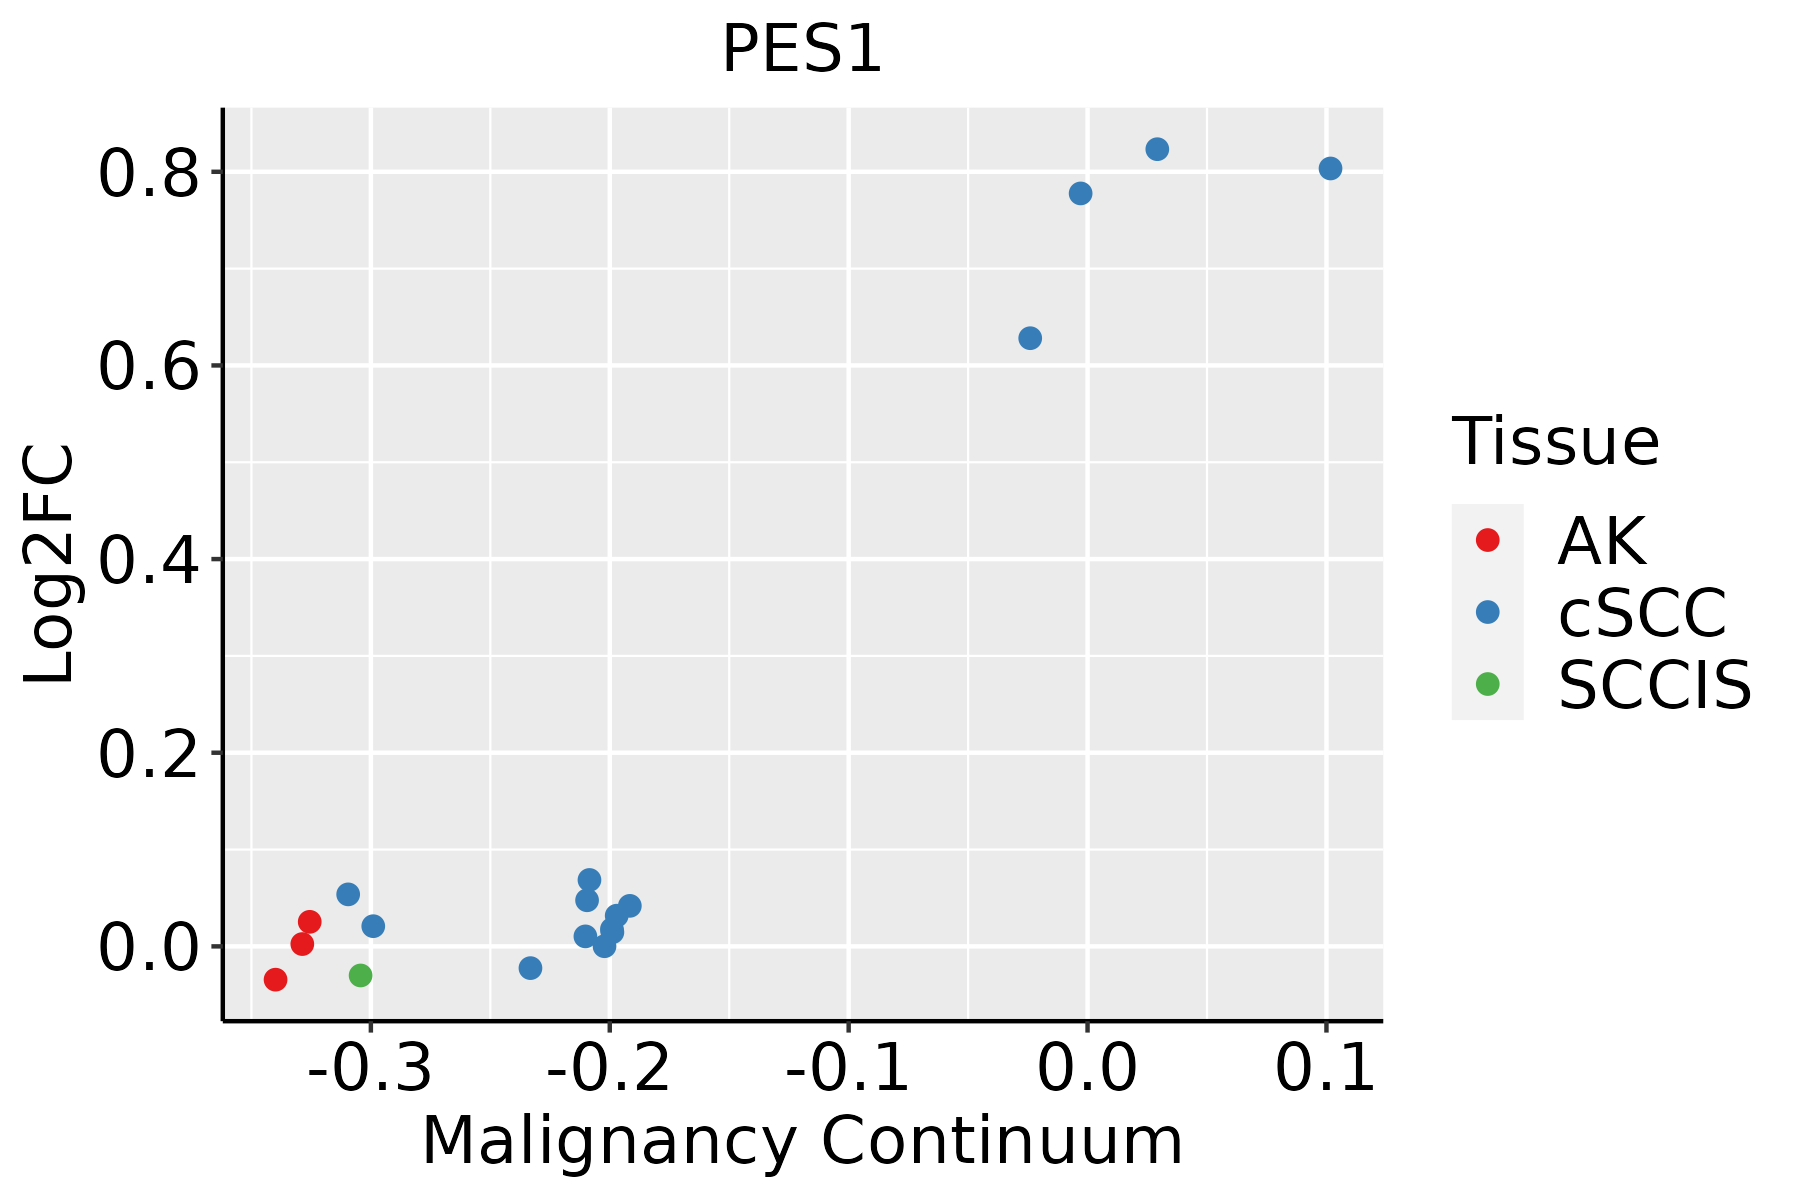
AK: Actinic keratosis
cSCC: Cutaneous squamous cell carcinoma
SCCIS:squamous cell carcinoma in situ
ThyroidThe image shows the transcriptomic changes along malignancy continuum.log2FC in expression of this searched gene in stem-like cells from each diseased tissue sample relative to stem-like cells in normal samples in each tissue plotted against the malignancy continuum. Samples are colored based on if they are from different disease stage.
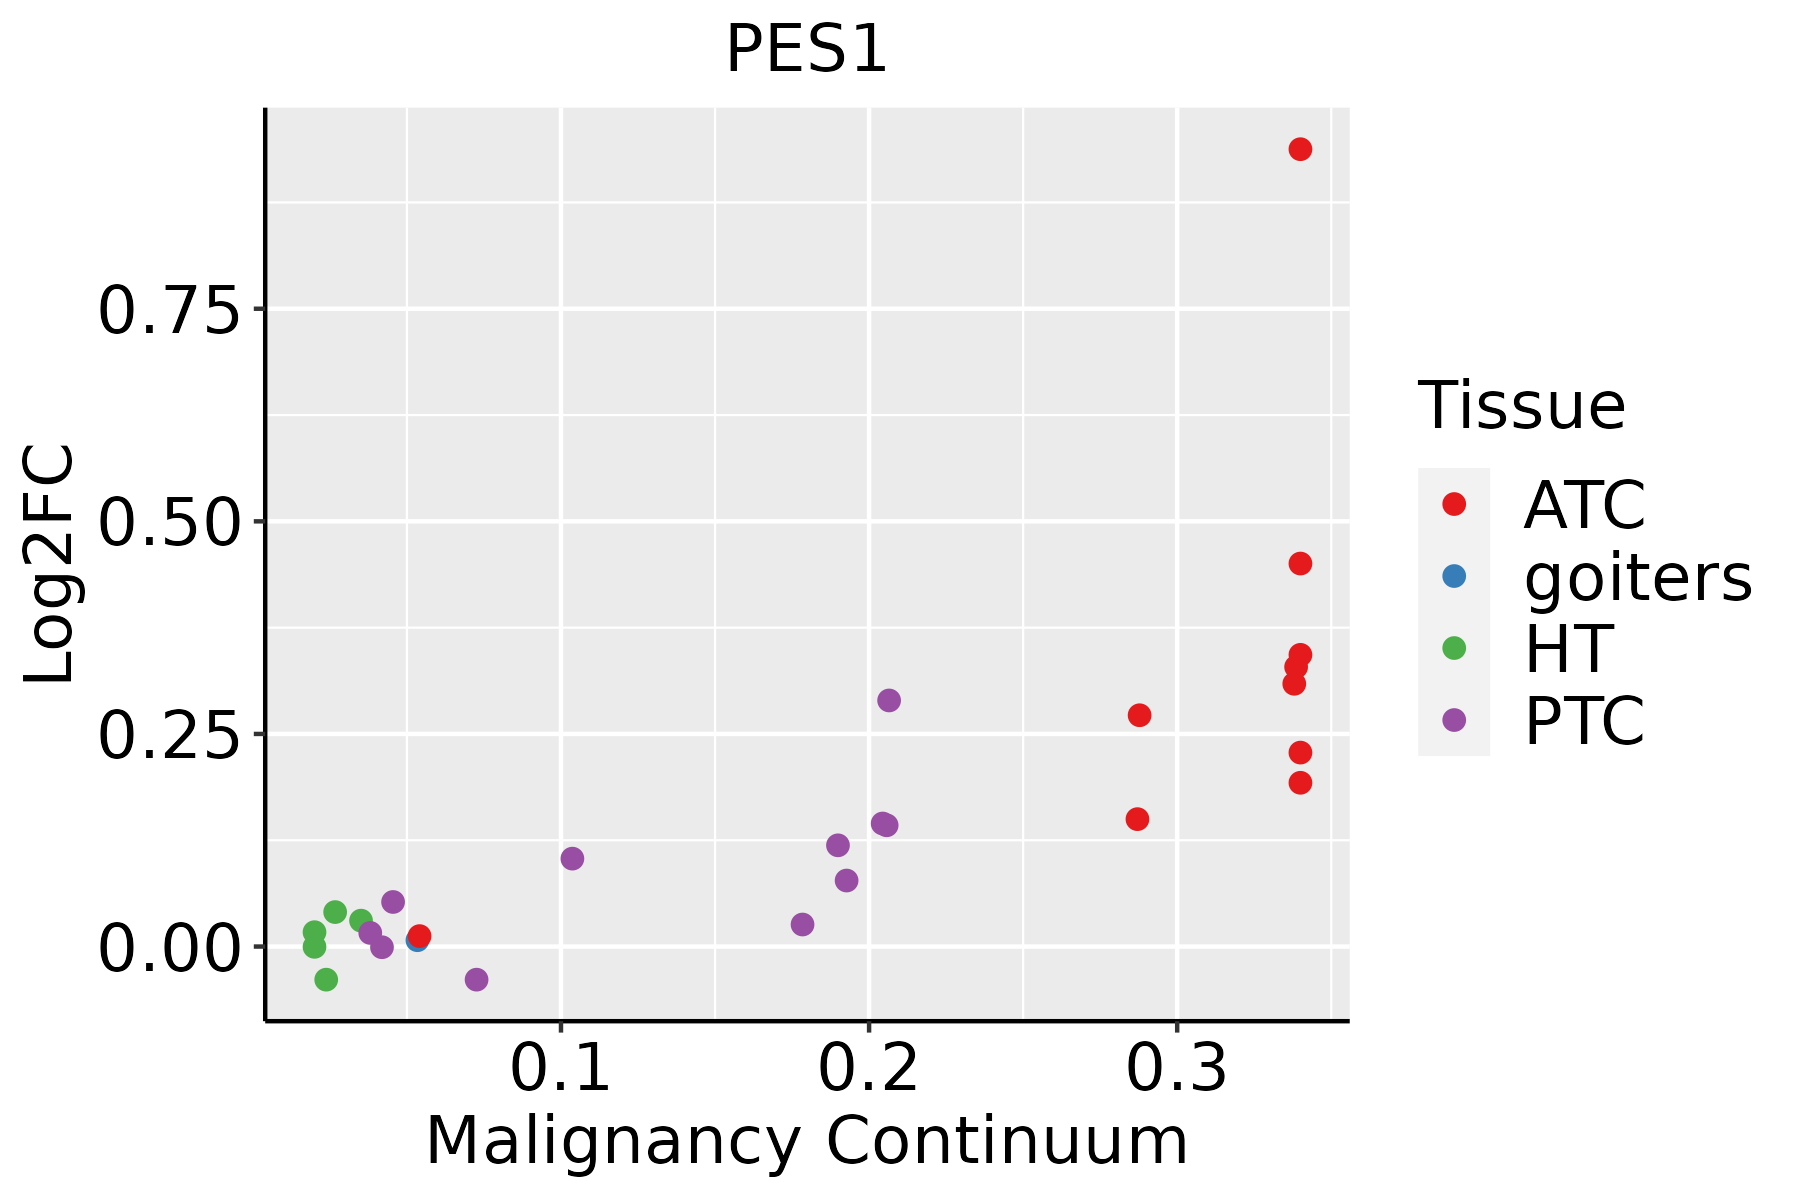
ATC: Anaplastic thyroid cancer
HT: Hashimoto's thyroiditis
PTC: Papillary thyroid cancer
∗log2FC in expression of this searched gene in stem-like cells from each diseased tissue sample relative to stem-like cells in normal samples in each tissue plotted against the malignancy continuum. Samples are colored based on if they are from different disease stage.

Top

Malignant transformation related pathway analysis

check buttonFind out the enriched GO biological processes and KEGG pathways involved in transition from healthy to precancer to cancer
check button Figure of enriched GO biological processes.
TissueDisease StageEnriched GO biological Processes
ColorectumADGO analysis - Figure of enriched GO biological processes: Top 15 enriched GO BP terms are showed in the bar plot of each disease state in each tissue. Each row represents a significant GO biological process which is colored according to the -log10(p.adjust).
ColorectumSERGO analysis - Figure of enriched GO biological processes: Top 15 enriched GO BP terms are showed in the bar plot of each disease state in each tissue. Each row represents a significant GO biological process which is colored according to the -log10(p.adjust).
ColorectumMSSGO analysis - Figure of enriched GO biological processes: Top 15 enriched GO BP terms are showed in the bar plot of each disease state in each tissue. Each row represents a significant GO biological process which is colored according to the -log10(p.adjust).
ColorectumMSI-HGO analysis - Figure of enriched GO biological processes: Top 15 enriched GO BP terms are showed in the bar plot of each disease state in each tissue. Each row represents a significant GO biological process which is colored according to the -log10(p.adjust).
ColorectumFAPGO analysis - Figure of enriched GO biological processes: Top 15 enriched GO BP terms are showed in the bar plot of each disease state in each tissue. Each row represents a significant GO biological process which is colored according to the -log10(p.adjust).
∗Top 15 enriched GO BP terms are showed in the bar plot of each disease state in each tissue. Each row represents a significant GO biological process which is colored according to the -log10(p.adjust).
Page: 1 2 3 4 5 6 7 8 9 

check button Enriched GO biological processes.
GO IDTissueDisease StageDescriptionGene RatioBg Ratiopvaluep.adjustCount
GO:0000463LiverCirrhoticmaturation of LSU-rRNA from tricistronic rRNA transcript (SSU-rRNA, 5.8S rRNA, LSU-rRNA)9/463415/187233.88e-032.10e-029
GO:002261322LiverHCCribonucleoprotein complex biogenesis355/7958463/187237.76e-524.92e-48355
GO:004225422LiverHCCribosome biogenesis246/7958299/187234.99e-461.58e-42246
GO:00344702LiverHCCncRNA processing293/7958395/187234.26e-386.76e-35293
GO:001607212LiverHCCrRNA metabolic process193/7958236/187231.26e-351.14e-32193
GO:000636421LiverHCCrRNA processing185/7958225/187238.14e-356.45e-32185
GO:00346601LiverHCCncRNA metabolic process332/7958485/187231.48e-317.80e-29332
GO:004227322LiverHCCribosomal large subunit biogenesis64/795872/187232.31e-162.03e-1464
GO:000047011LiverHCCmaturation of LSU-rRNA26/795828/187232.82e-086.43e-0726
GO:00004601LiverHCCmaturation of 5.8S rRNA29/795835/187231.12e-061.66e-0529
GO:00004631LiverHCCmaturation of LSU-rRNA from tricistronic rRNA transcript (SSU-rRNA, 5.8S rRNA, LSU-rRNA)15/795815/187232.65e-063.54e-0515
GO:0000466LiverHCCmaturation of 5.8S rRNA from tricistronic rRNA transcript (SSU-rRNA, 5.8S rRNA, LSU-rRNA)19/795824/187232.80e-042.02e-0319
GO:002261320Oral cavityOSCCribonucleoprotein complex biogenesis333/7305463/187238.28e-485.24e-44333
GO:004225420Oral cavityOSCCribosome biogenesis230/7305299/187233.22e-416.80e-38230
GO:000636410Oral cavityOSCCrRNA processing172/7305225/187231.57e-301.24e-27172
GO:00344709Oral cavityOSCCncRNA processing263/7305395/187234.38e-292.78e-26263
GO:001607210Oral cavityOSCCrRNA metabolic process176/7305236/187236.51e-293.24e-26176
GO:00346605Oral cavityOSCCncRNA metabolic process296/7305485/187232.94e-236.65e-21296
GO:004227320Oral cavityOSCCribosomal large subunit biogenesis61/730572/187231.52e-151.06e-1361
GO:00004706Oral cavityOSCCmaturation of LSU-rRNA26/730528/187233.39e-097.66e-0826
Page: 1 2 3 4 5 

check button Enriched KEGG pathways.
Pathway IDTissueDisease StageDescriptionGene RatioBg Ratiopvaluep.adjustqvalueCount
Page: 1 

Top

Cell-cell communication analysis

check buttonIdentification of potential cell-cell interactions between two cell types and their ligand-receptor pairs for different disease states
LigandReceptorLRpairPathwayTissueDisease Stage
Page: 1 

Top

Single-cell gene regulatory network inference analysis

check buttonFind out the significant the regulons (TFs) and the target genes of each regulon across cell types for different disease states
TFCell TypeTissueDisease StageTarget GeneRSSRegulon Activity
∗The dot plots of a searched regulon are shown for all cell subpopulations in each disease state of each tissue based on the regulon specific score inferred using pySCENIC and by calculating the average expression.
Page: 1 

Top

Somatic mutation of malignant transformation related genes

check buttonAnnotation of somatic variants for genes involved in malignant transformation
Hugo SymbolVariant ClassVariant ClassificationdbSNP RSHGVScHGVSpHGVSp ShortSWISSPROTBIOTYPESIFTPolyPhenTumor Sample BarcodeTissueHistologySexAgeStageTherapy TypesDrugsOutcome
PES1SNVMissense_Mutationrs774125501c.643G>Ap.Val215Metp.V215MO00541protein_codingdeleterious(0.03)possibly_damaging(0.56)TCGA-A2-A3XY-01Breastbreast invasive carcinomaFemale<65I/IIChemotherapyadriamycinPD
PES1SNVMissense_Mutationc.50N>Gp.Tyr17Cysp.Y17CO00541protein_codingdeleterious(0)probably_damaging(0.997)TCGA-A8-A09Z-01Breastbreast invasive carcinomaFemale>=65I/IIUnknownUnknownSD
PES1SNVMissense_Mutationc.1453G>Ap.Glu485Lysp.E485KO00541protein_codingtolerated(0.48)benign(0.021)TCGA-AN-A0XW-01Breastbreast invasive carcinomaFemale<65III/IVUnknownUnknownSD
PES1insertionNonsense_Mutationnovelc.281_282insCTTTTAGTAGAGACTGGGTTTCCCCATGTTGGCCAGGCTp.Lys94delinsAsnPheTerTerArgLeuGlyPheProMetLeuAlaArgLeup.K94delinsNF**RLGFPMLARLO00541protein_codingTCGA-A8-A094-01Breastbreast invasive carcinomaFemale>=65I/IIUnknownUnknownSD
PES1insertionFrame_Shift_Insnovelc.55_56insGAGTCAAAATAAGACTTp.Thr19ArgfsTer17p.T19Rfs*17O00541protein_codingTCGA-B6-A0I9-01Breastbreast invasive carcinomaFemale<65III/IVUnknownUnknownPD
PES1deletionFrame_Shift_Delnovelc.480delGp.Cys161AlafsTer170p.C161Afs*170O00541protein_codingTCGA-EW-A2FV-01Breastbreast invasive carcinomaFemale<65III/IVChemotherapydocetaxelSD
PES1SNVMissense_Mutationrs781772847c.673N>Ap.Glu225Lysp.E225KO00541protein_codingdeleterious(0)probably_damaging(0.976)TCGA-2W-A8YY-01Cervixcervical & endocervical cancerFemale<65I/IIChemotherapycisplatinCR
PES1SNVMissense_Mutationc.1463N>Tp.Ser488Leup.S488LO00541protein_codingtolerated(0.2)benign(0)TCGA-Q1-A73O-01Cervixcervical & endocervical cancerFemale<65I/IIChemotherapycisplatinCR
PES1SNVMissense_Mutationnovelc.1600N>Ap.Arg534Serp.R534SO00541protein_codingdeleterious(0)possibly_damaging(0.908)TCGA-AA-3939-01Colorectumcolon adenocarcinomaMale>=65I/IIUnknownUnknownSD
PES1SNVMissense_Mutationc.1052G>Ap.Gly351Aspp.G351DO00541protein_codingdeleterious(0.03)probably_damaging(0.992)TCGA-AD-6964-01Colorectumcolon adenocarcinomaMale<65III/IVChemotherapyfolfoxPD
Page: 1 2 3 4 5 6 7 

Top

Related drugs of malignant transformation related genes

check buttonIdentification of chemicals and drugs interact with genes involved in malignant transfromation
(DGIdb 4.0)
Entrez IDSymbolCategoryInteraction TypesDrug Claim NameDrug NamePMIDs
Page: 1