Schematic overview of the cellular and molecular mechanisms involved in the cancer progression, including the proposed cellular and molecular mechanisms in cancer cells trajectory. AT1: alveolar type 1 cells; AT2: alveolar type 2 cells; AAH: atypical adenomatous hyperplasia; AIS: adenocarcinoma in situ; MIA: minimally invasive adenocarcinoma; IA: invasive adenocarcinoma; EMT: epithelial-mesenchymal transition

Home

Download

Statistics

Help

Contact

Center for Computational Systems Medicine
leaf

Gene summary

leaf

Malignant transformation analysis

leaf

Malignant transformation related pathway analysis

leaf

Cell-cell communication analysis

leaf

Single-cell gene regulatory network inference analysis

leaf

Somatic mutation of malignant transformation related genes

leaf

Related drugs of malignant transformation related genes

Gene: PELI1

Gene summary for PELI1

check button Gene summary.

Gene informationSpeciesHuman
Gene symbol

PELI1

Gene ID

57162

Gene namepellino E3 ubiquitin protein ligase 1
Gene AliasPELI1
Cytomap2p14
Gene Typeprotein-coding
GO ID

GO:0000209

UniProtAcc

Q53T26


Top

Malignant transformation analysis

check button Identification of the aberrant gene expression in precancerous and cancerous lesions by comparing the gene expression of stem-like cells in diseased tissues with normal stem cells
check button Malignant transformation involving gene list.
Entrez IDSymbolReplicatesSpeciesOrganTissueAdj P-valueLog2FCMalignancy
57162PELI1CCI_1HumanCervixCC3.13e-091.44e+000.528
57162PELI1CCI_3HumanCervixCC1.90e-046.26e-010.516
57162PELI1HTA11_3410_2000001011HumanColorectumAD3.23e-04-2.96e-010.0155
57162PELI1HTA11_3361_2000001011HumanColorectumAD9.65e-06-5.58e-01-0.1207
57162PELI1HTA11_866_3004761011HumanColorectumAD3.92e-04-3.60e-010.096
57162PELI1HTA11_7696_3000711011HumanColorectumAD2.19e-02-3.68e-010.0674
57162PELI1HTA11_99999971662_82457HumanColorectumMSS1.12e-03-3.53e-010.3859
57162PELI1HTA11_99999973899_84307HumanColorectumMSS3.61e-03-5.20e-010.2585
57162PELI1HTA11_99999974143_84620HumanColorectumMSS6.66e-04-3.31e-010.3005
57162PELI1A015-C-203HumanColorectumFAP1.22e-19-3.19e-01-0.1294
57162PELI1A015-C-204HumanColorectumFAP1.19e-03-2.66e-01-0.0228
57162PELI1A014-C-040HumanColorectumFAP4.99e-04-4.51e-01-0.1184
57162PELI1A002-C-201HumanColorectumFAP7.12e-13-3.70e-010.0324
57162PELI1A001-C-119HumanColorectumFAP4.08e-08-3.86e-01-0.1557
57162PELI1A001-C-108HumanColorectumFAP1.87e-13-3.70e-01-0.0272
57162PELI1A002-C-205HumanColorectumFAP8.06e-25-5.67e-01-0.1236
57162PELI1A015-C-005HumanColorectumFAP4.36e-02-1.49e-01-0.0336
57162PELI1A015-C-006HumanColorectumFAP1.17e-16-5.66e-01-0.0994
57162PELI1A015-C-106HumanColorectumFAP1.79e-05-2.86e-01-0.0511
57162PELI1A002-C-114HumanColorectumFAP6.59e-18-5.04e-01-0.1561
Page: 1 2 3 4 5 6 7 8 9 

check button Transcriptomic changes along malignancy continuum.
TissueExpression DynamicsAbbreviation
CervixThe image shows the transcriptomic changes along malignancy continuum.log2FC in expression of this searched gene in stem-like cells from each diseased tissue sample relative to stem-like cells in normal samples in each tissue plotted against the malignancy continuum. Samples are colored based on if they are from different disease stage.CC: Cervix cancer
HSIL_HPV: HPV-infected high-grade squamous intraepithelial lesions
N_HPV: HPV-infected normal cervix
Colorectum (GSE201348)The image shows the transcriptomic changes along malignancy continuum.log2FC in expression of this searched gene in stem-like cells from each diseased tissue sample relative to stem-like cells in normal samples in each tissue plotted against the malignancy continuum. Samples are colored based on if they are from different disease stage.FAP: Familial adenomatous polyposis
CRC: Colorectal cancer
Colorectum (HTA11)The image shows the transcriptomic changes along malignancy continuum.log2FC in expression of this searched gene in stem-like cells from each diseased tissue sample relative to stem-like cells in normal samples in each tissue plotted against the malignancy continuum. Samples are colored based on if they are from different disease stage.AD: Adenomas
SER: Sessile serrated lesions
MSI-H: Microsatellite-high colorectal cancer
MSS: Microsatellite stable colorectal cancer
EndometriumThe image shows the transcriptomic changes along malignancy continuum.log2FC in expression of this searched gene in stem-like cells from each diseased tissue sample relative to stem-like cells in normal samples in each tissue plotted against the malignancy continuum. Samples are colored based on if they are from different disease stage.AEH: Atypical endometrial hyperplasia
EEC: Endometrioid Cancer
EsophagusThe image shows the transcriptomic changes along malignancy continuum.log2FC in expression of this searched gene in stem-like cells from each diseased tissue sample relative to stem-like cells in normal samples in each tissue plotted against the malignancy continuum. Samples are colored based on if they are from different disease stage.ESCC: Esophageal squamous cell carcinoma
HGIN: High-grade intraepithelial neoplasias
LGIN: Low-grade intraepithelial neoplasias
LiverThe image shows the transcriptomic changes along malignancy continuum.log2FC in expression of this searched gene in stem-like cells from each diseased tissue sample relative to stem-like cells in normal samples in each tissue plotted against the malignancy continuum. Samples are colored based on if they are from different disease stage.
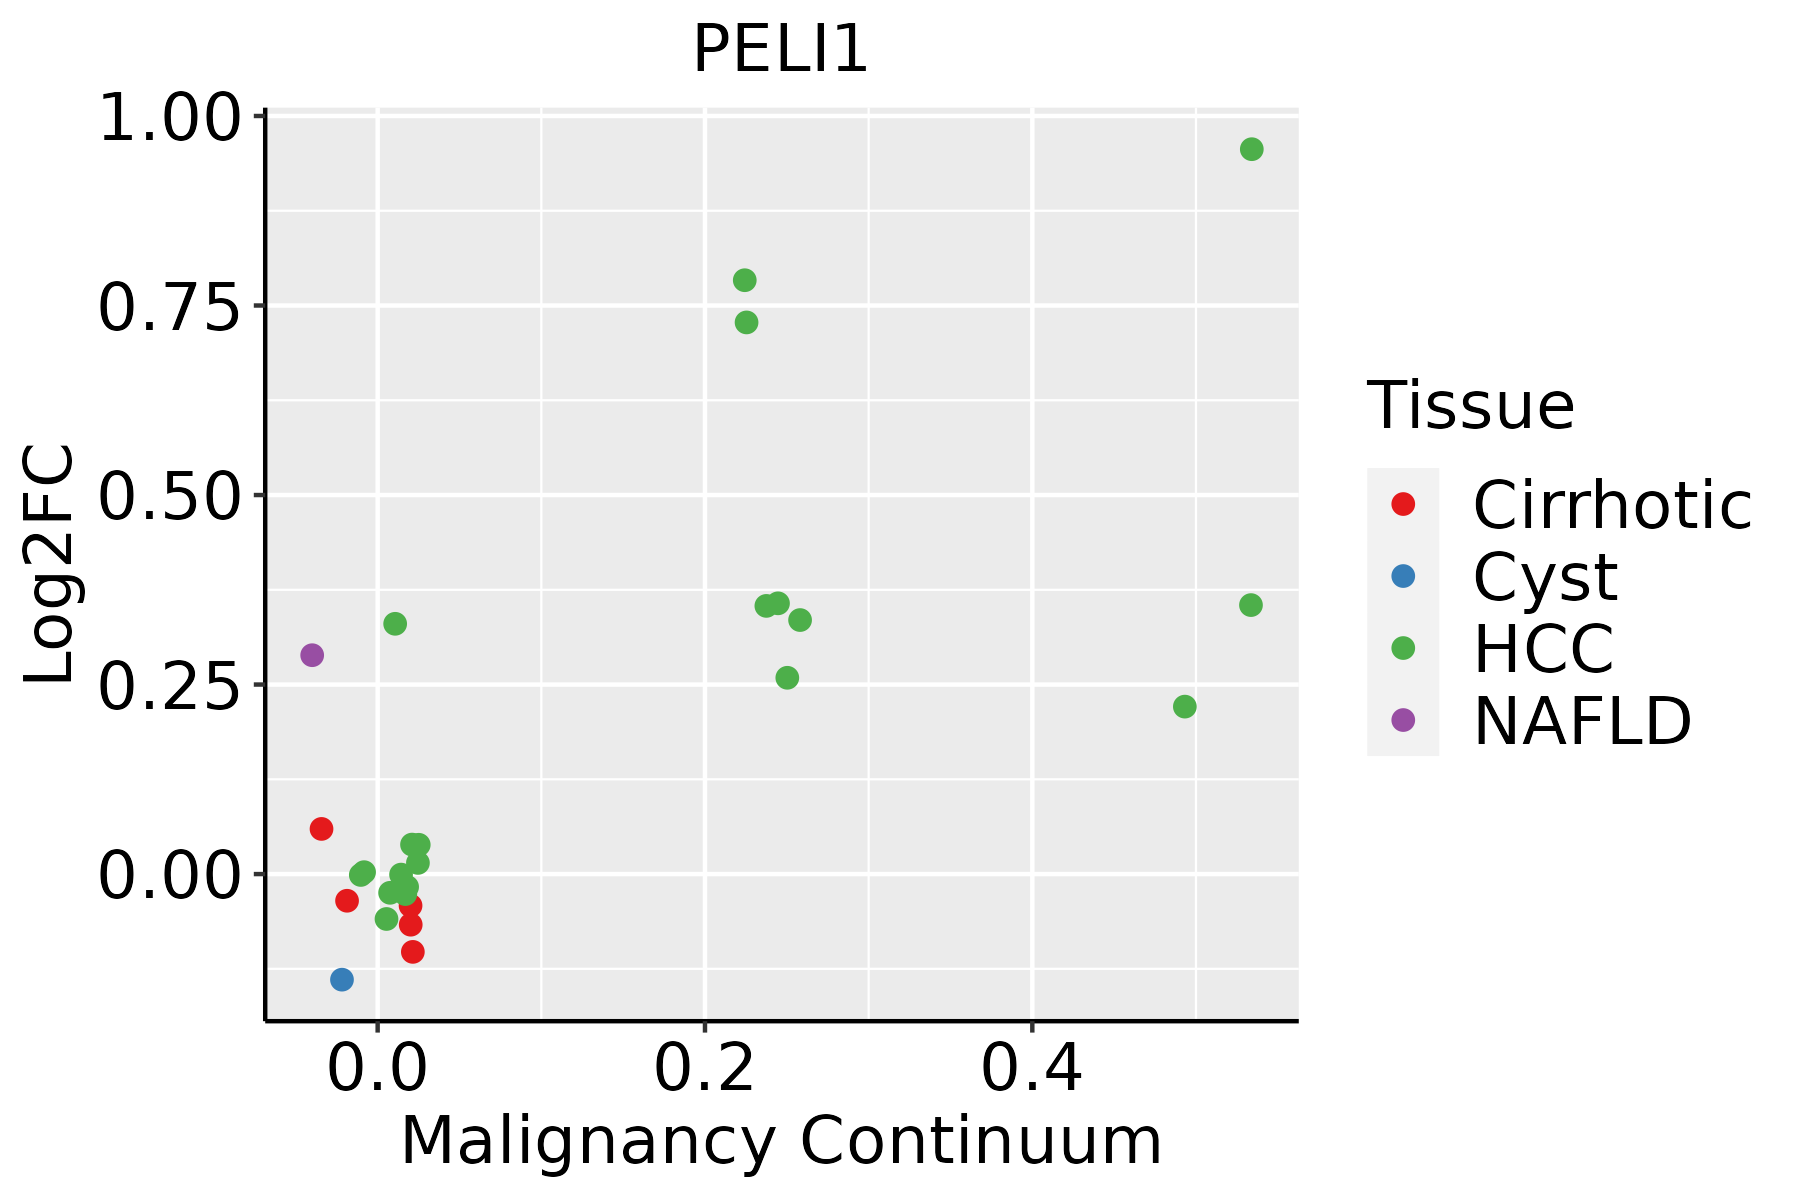
HCC: Hepatocellular carcinoma
NAFLD: Non-alcoholic fatty liver disease
LungThe image shows the transcriptomic changes along malignancy continuum.log2FC in expression of this searched gene in stem-like cells from each diseased tissue sample relative to stem-like cells in normal samples in each tissue plotted against the malignancy continuum. Samples are colored based on if they are from different disease stage.
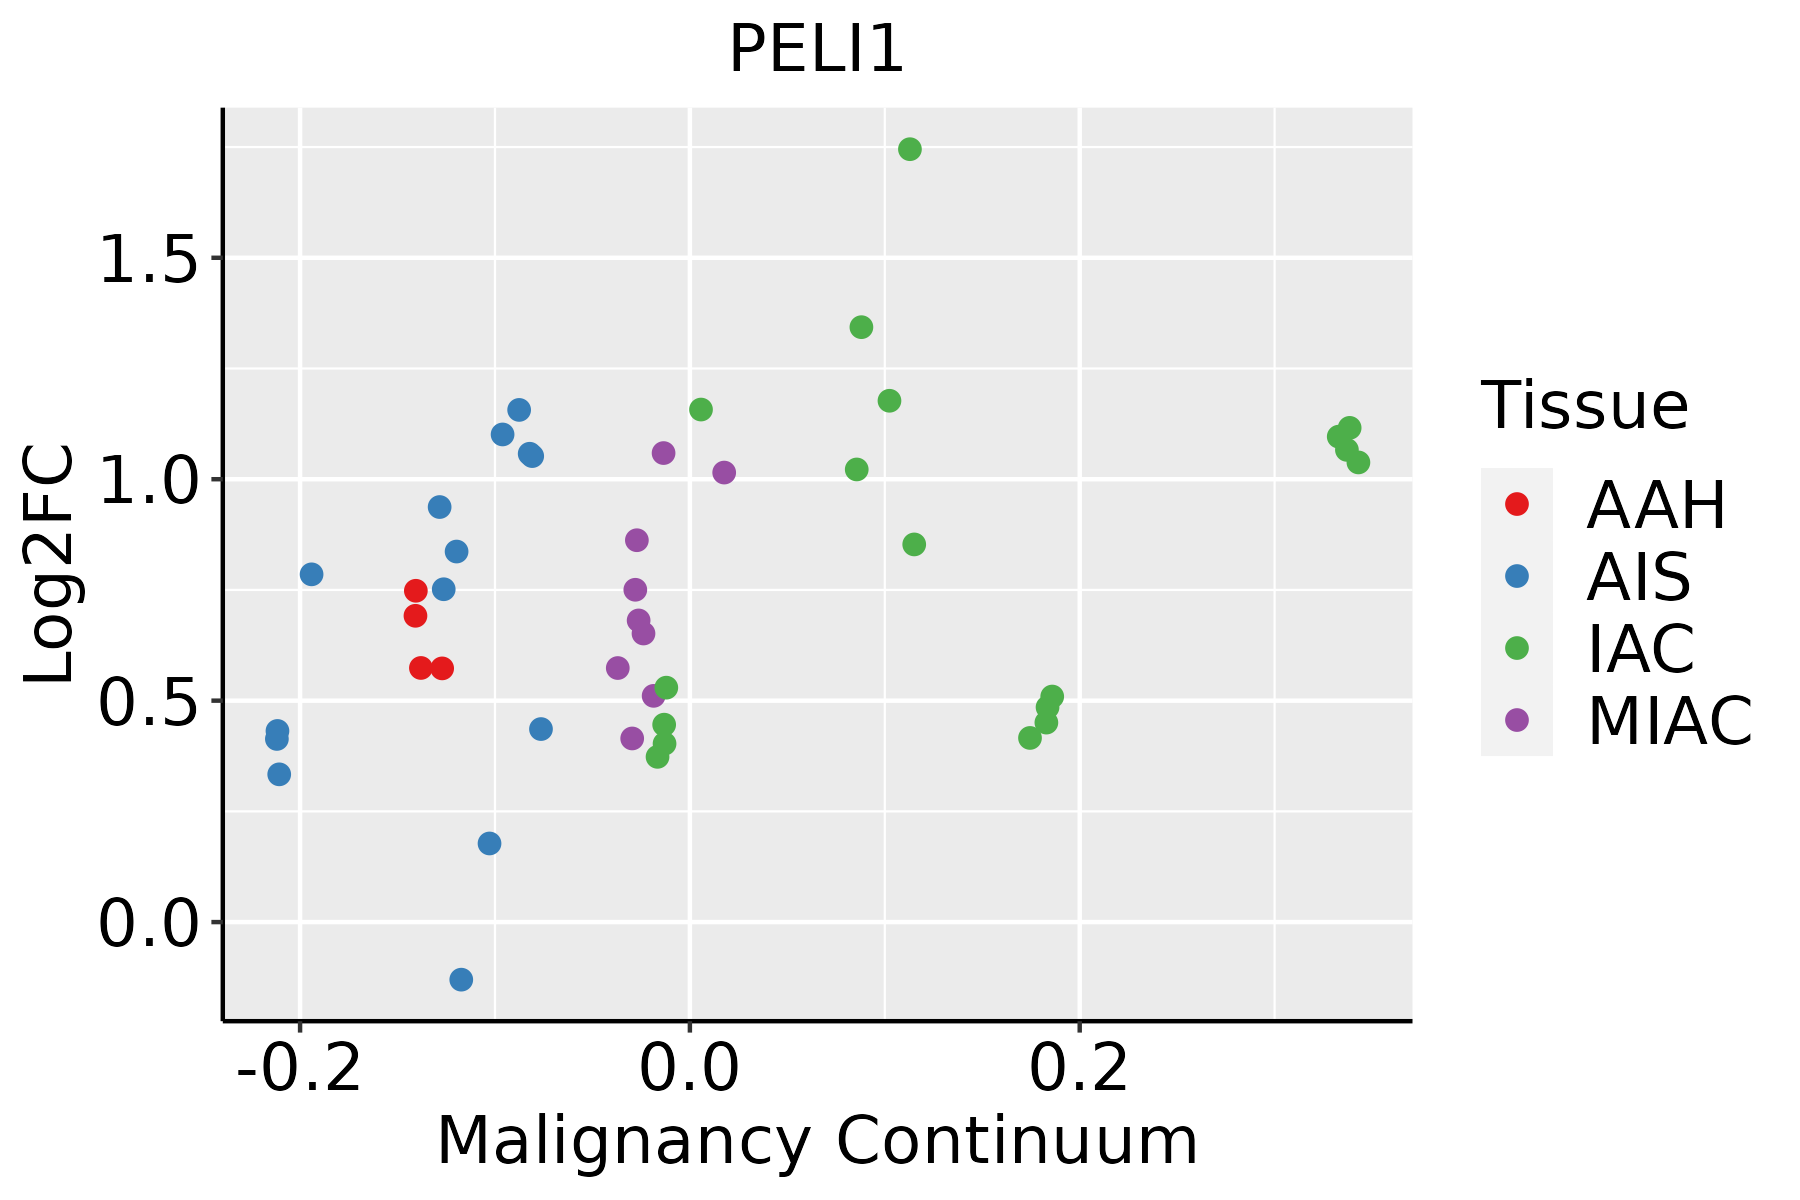
AAH: Atypical adenomatous hyperplasia
AIS: Adenocarcinoma in situ
IAC: Invasive lung adenocarcinoma
MIA: Minimally invasive adenocarcinoma
Oral CavityThe image shows the transcriptomic changes along malignancy continuum.log2FC in expression of this searched gene in stem-like cells from each diseased tissue sample relative to stem-like cells in normal samples in each tissue plotted against the malignancy continuum. Samples are colored based on if they are from different disease stage.EOLP: Erosive Oral lichen planus
LP: leukoplakia
NEOLP: Non-erosive oral lichen planus
OSCC: Oral squamous cell carcinoma
SkinThe image shows the transcriptomic changes along malignancy continuum.log2FC in expression of this searched gene in stem-like cells from each diseased tissue sample relative to stem-like cells in normal samples in each tissue plotted against the malignancy continuum. Samples are colored based on if they are from different disease stage.
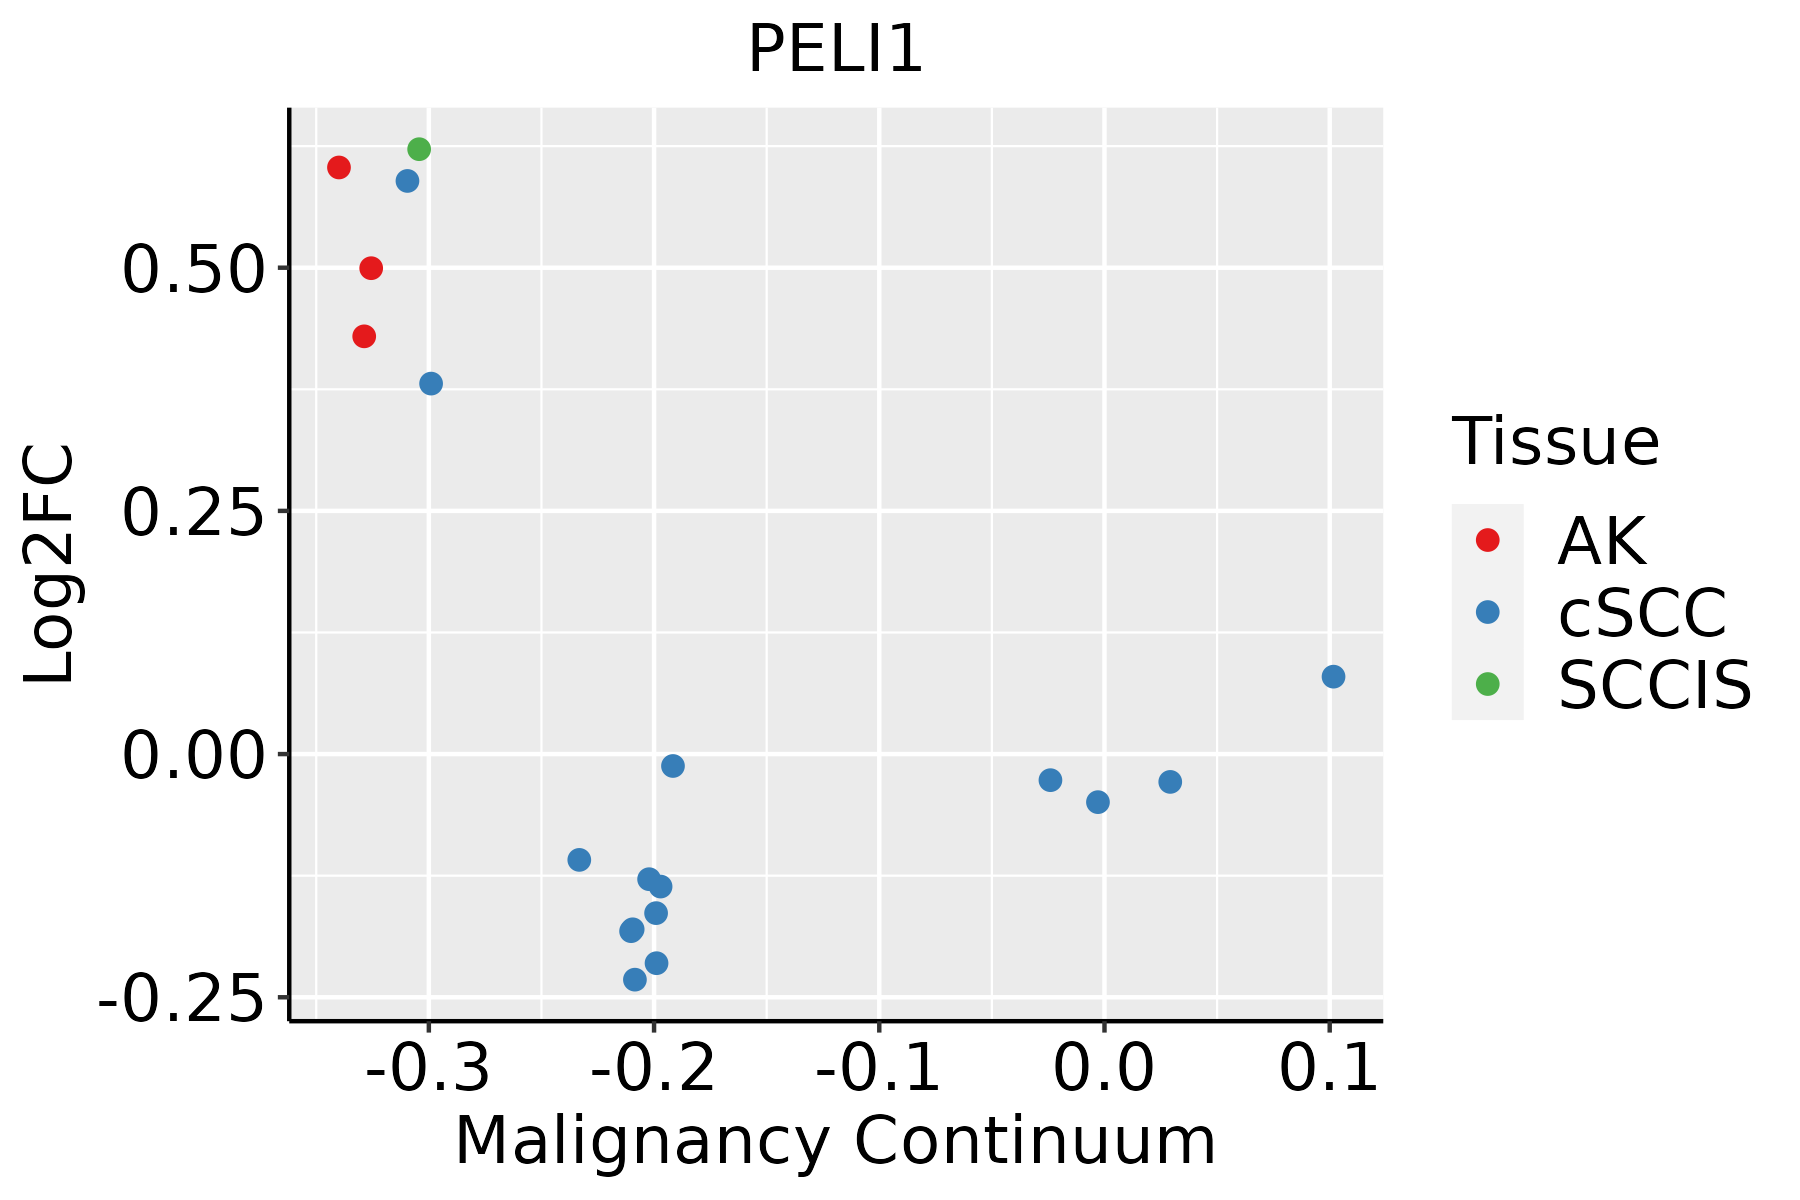
AK: Actinic keratosis
cSCC: Cutaneous squamous cell carcinoma
SCCIS:squamous cell carcinoma in situ
ThyroidThe image shows the transcriptomic changes along malignancy continuum.log2FC in expression of this searched gene in stem-like cells from each diseased tissue sample relative to stem-like cells in normal samples in each tissue plotted against the malignancy continuum. Samples are colored based on if they are from different disease stage.ATC: Anaplastic thyroid cancer
HT: Hashimoto's thyroiditis
PTC: Papillary thyroid cancer
∗log2FC in expression of this searched gene in stem-like cells from each diseased tissue sample relative to stem-like cells in normal samples in each tissue plotted against the malignancy continuum. Samples are colored based on if they are from different disease stage.

Top

Malignant transformation related pathway analysis

check buttonFind out the enriched GO biological processes and KEGG pathways involved in transition from healthy to precancer to cancer
check button Figure of enriched GO biological processes.
TissueDisease StageEnriched GO biological Processes
ColorectumADGO analysis - Figure of enriched GO biological processes: Top 15 enriched GO BP terms are showed in the bar plot of each disease state in each tissue. Each row represents a significant GO biological process which is colored according to the -log10(p.adjust).
ColorectumSERGO analysis - Figure of enriched GO biological processes: Top 15 enriched GO BP terms are showed in the bar plot of each disease state in each tissue. Each row represents a significant GO biological process which is colored according to the -log10(p.adjust).
ColorectumMSSGO analysis - Figure of enriched GO biological processes: Top 15 enriched GO BP terms are showed in the bar plot of each disease state in each tissue. Each row represents a significant GO biological process which is colored according to the -log10(p.adjust).
ColorectumMSI-HGO analysis - Figure of enriched GO biological processes: Top 15 enriched GO BP terms are showed in the bar plot of each disease state in each tissue. Each row represents a significant GO biological process which is colored according to the -log10(p.adjust).
ColorectumFAPGO analysis - Figure of enriched GO biological processes: Top 15 enriched GO BP terms are showed in the bar plot of each disease state in each tissue. Each row represents a significant GO biological process which is colored according to the -log10(p.adjust).
∗Top 15 enriched GO BP terms are showed in the bar plot of each disease state in each tissue. Each row represents a significant GO biological process which is colored according to the -log10(p.adjust).
Page: 1 2 3 4 5 6 7 8 9 

check button Enriched GO biological processes.
GO IDTissueDisease StageDescriptionGene RatioBg Ratiopvaluep.adjustCount
GO:00709366CervixCCprotein K48-linked ubiquitination22/231165/187235.56e-061.38e-0422
GO:00706637CervixCCregulation of leukocyte proliferation55/2311245/187236.51e-061.56e-0455
GO:00506705CervixCCregulation of lymphocyte proliferation51/2311225/187231.05e-052.32e-0451
GO:0051250CervixCCnegative regulation of lymphocyte activation39/2311157/187231.23e-052.57e-0439
GO:00329444CervixCCregulation of mononuclear cell proliferation51/2311227/187231.36e-052.73e-0451
GO:00706617CervixCCleukocyte proliferation65/2311318/187232.56e-054.32e-0465
GO:0002695CervixCCnegative regulation of leukocyte activation43/2311187/187233.47e-055.60e-0443
GO:00431228CervixCCregulation of I-kappaB kinase/NF-kappaB signaling53/2311249/187234.50e-056.87e-0453
GO:00466516CervixCClymphocyte proliferation59/2311288/187235.53e-058.10e-0459
GO:0050868CervixCCnegative regulation of T cell activation31/2311122/187235.81e-058.46e-0431
GO:00329435CervixCCmononuclear cell proliferation59/2311291/187237.51e-051.03e-0359
GO:00022212CervixCCpattern recognition receptor signaling pathway39/2311172/187231.08e-041.38e-0339
GO:00622073CervixCCregulation of pattern recognition receptor signaling pathway27/2311105/187231.37e-041.68e-0327
GO:00072497CervixCCI-kappaB kinase/NF-kappaB signaling56/2311281/187231.81e-042.12e-0356
GO:1903038CervixCCnegative regulation of leukocyte cell-cell adhesion33/2311141/187231.90e-042.21e-0333
GO:0050866CervixCCnegative regulation of cell activation44/2311210/187232.76e-043.02e-0344
GO:00026967CervixCCpositive regulation of leukocyte activation72/2311409/187231.13e-039.31e-0372
GO:00512516CervixCCpositive regulation of lymphocyte activation65/2311362/187231.15e-039.39e-0365
GO:00508676CervixCCpositive regulation of cell activation73/2311420/187231.50e-031.16e-0273
GO:00431237CervixCCpositive regulation of I-kappaB kinase/NF-kappaB signaling37/2311186/187232.15e-031.55e-0237
Page: 1 2 3 4 5 6 7 8 9 10 11 12 13 14 15 16 17 18 19 20 21 22 23 24 

check button Enriched KEGG pathways.
Pathway IDTissueDisease StageDescriptionGene RatioBg Ratiopvaluep.adjustqvalueCount
Page: 1 

Top

Cell-cell communication analysis

check buttonIdentification of potential cell-cell interactions between two cell types and their ligand-receptor pairs for different disease states
LigandReceptorLRpairPathwayTissueDisease Stage
Page: 1 

Top

Single-cell gene regulatory network inference analysis

check buttonFind out the significant the regulons (TFs) and the target genes of each regulon across cell types for different disease states
TFCell TypeTissueDisease StageTarget GeneRSSRegulon Activity
∗The dot plots of a searched regulon are shown for all cell subpopulations in each disease state of each tissue based on the regulon specific score inferred using pySCENIC and by calculating the average expression.
Page: 1 

Top

Somatic mutation of malignant transformation related genes

check buttonAnnotation of somatic variants for genes involved in malignant transformation
Hugo SymbolVariant ClassVariant ClassificationdbSNP RSHGVScHGVSpHGVSp ShortSWISSPROTBIOTYPESIFTPolyPhenTumor Sample BarcodeTissueHistologySexAgeStageTherapy TypesDrugsOutcome
PELI1SNVMissense_Mutationc.1156N>Tp.His386Tyrp.H386YQ96FA3protein_codingdeleterious(0.02)probably_damaging(0.998)TCGA-A2-A0EY-01Breastbreast invasive carcinomaFemale<65I/IIChemotherapyadriamycinSD
PELI1SNVMissense_Mutationrs761769713c.977G>Ap.Arg326Hisp.R326HQ96FA3protein_codingdeleterious(0.04)possibly_damaging(0.506)TCGA-AO-A0J4-01Breastbreast invasive carcinomaFemale<65I/IIChemotherapydoxorubicinSD
PELI1insertionFrame_Shift_Insnovelc.346_347insCCTACGTGAAACCAGATCGGCTCAGCAGAGAGGAp.Asp116AlafsTer20p.D116Afs*20Q96FA3protein_codingTCGA-AR-A0TY-01Breastbreast invasive carcinomaFemale<65I/IIUnspecificPaclitaxelPD
PELI1insertionFrame_Shift_Insnovelc.340_341insCp.Val114AlafsTer3p.V114Afs*3Q96FA3protein_codingTCGA-B6-A0IB-01Breastbreast invasive carcinomaFemale<65III/IVUnknownUnknownPD
PELI1insertionFrame_Shift_Insnovelc.339_340insCTCATACTTTTCATGCAGCCTGTCCCTTTTGTGCACATCAGTTGp.Val114LeufsTer16p.V114Lfs*16Q96FA3protein_codingTCGA-B6-A0IB-01Breastbreast invasive carcinomaFemale<65III/IVUnknownUnknownPD
PELI1SNVMissense_Mutationc.1181C>Tp.Ala394Valp.A394VQ96FA3protein_codingtolerated(0.84)benign(0.284)TCGA-2W-A8YY-01Cervixcervical & endocervical cancerFemale<65I/IIChemotherapycisplatinCR
PELI1SNVMissense_Mutationc.1174N>Tp.His392Tyrp.H392YQ96FA3protein_codingdeleterious(0.01)possibly_damaging(0.876)TCGA-DS-A1OC-01Cervixcervical & endocervical cancerFemale<65I/IIChemotherapygemcitabineSD
PELI1SNVMissense_Mutationrs761769713c.977N>Ap.Arg326Hisp.R326HQ96FA3protein_codingdeleterious(0.04)possibly_damaging(0.506)TCGA-MA-AA42-01Cervixcervical & endocervical cancerFemale>=65I/IIUnknownUnknownSD
PELI1SNVMissense_Mutationc.895N>Ap.Val299Ilep.V299IQ96FA3protein_codingtolerated(0.31)benign(0.007)TCGA-A6-6654-01Colorectumcolon adenocarcinomaFemale>=65III/IVChemotherapyoxaliplatinSD
PELI1SNVMissense_Mutationrs768293813c.859A>Gp.Asn287Aspp.N287DQ96FA3protein_codingdeleterious(0)possibly_damaging(0.627)TCGA-AA-3833-01Colorectumcolon adenocarcinomaFemale<65I/IIUnknownUnknownSD
Page: 1 2 3 4 5 

Top

Related drugs of malignant transformation related genes

check buttonIdentification of chemicals and drugs interact with genes involved in malignant transfromation
(DGIdb 4.0)
Entrez IDSymbolCategoryInteraction TypesDrug Claim NameDrug NamePMIDs
Page: 1