
|
|||||
|
 | |
| |
| |
| |
| |
| |
|
Gene: PDPK1 |
Gene summary for PDPK1 |
| Gene information | Species | Human | Gene symbol | PDPK1 | Gene ID | 5170 |
| Gene name | 3-phosphoinositide dependent protein kinase 1 | |
| Gene Alias | PDK1 | |
| Cytomap | 16p13.3 | |
| Gene Type | protein-coding | GO ID | GO:0001525 | UniProtAcc | O15530 |
Top |
Malignant transformation analysis |
| Identification of the aberrant gene expression in precancerous and cancerous lesions by comparing the gene expression of stem-like cells in diseased tissues with normal stem cells |
| Entrez ID | Symbol | Replicates | Species | Organ | Tissue | Adj P-value | Log2FC | Malignancy |
| 5170 | PDPK1 | CCI_1 | Human | Cervix | CC | 6.89e-03 | 5.25e-01 | 0.528 |
| 5170 | PDPK1 | CCI_2 | Human | Cervix | CC | 9.28e-03 | 6.57e-01 | 0.5249 |
| 5170 | PDPK1 | LZE4T | Human | Esophagus | ESCC | 1.69e-06 | 1.57e-01 | 0.0811 |
| 5170 | PDPK1 | LZE7T | Human | Esophagus | ESCC | 8.66e-08 | 3.91e-01 | 0.0667 |
| 5170 | PDPK1 | LZE8T | Human | Esophagus | ESCC | 5.07e-04 | 1.48e-01 | 0.067 |
| 5170 | PDPK1 | LZE24T | Human | Esophagus | ESCC | 1.80e-10 | 3.06e-01 | 0.0596 |
| 5170 | PDPK1 | P1T-E | Human | Esophagus | ESCC | 2.33e-06 | 2.63e-01 | 0.0875 |
| 5170 | PDPK1 | P2T-E | Human | Esophagus | ESCC | 1.97e-36 | 6.37e-01 | 0.1177 |
| 5170 | PDPK1 | P4T-E | Human | Esophagus | ESCC | 6.53e-20 | 4.69e-01 | 0.1323 |
| 5170 | PDPK1 | P5T-E | Human | Esophagus | ESCC | 8.09e-16 | 2.00e-01 | 0.1327 |
| 5170 | PDPK1 | P8T-E | Human | Esophagus | ESCC | 1.34e-16 | 3.38e-01 | 0.0889 |
| 5170 | PDPK1 | P9T-E | Human | Esophagus | ESCC | 2.42e-06 | 1.61e-01 | 0.1131 |
| 5170 | PDPK1 | P10T-E | Human | Esophagus | ESCC | 2.66e-16 | 1.81e-01 | 0.116 |
| 5170 | PDPK1 | P11T-E | Human | Esophagus | ESCC | 2.75e-06 | 5.00e-01 | 0.1426 |
| 5170 | PDPK1 | P12T-E | Human | Esophagus | ESCC | 1.43e-21 | 4.33e-01 | 0.1122 |
| 5170 | PDPK1 | P15T-E | Human | Esophagus | ESCC | 3.99e-16 | 3.01e-01 | 0.1149 |
| 5170 | PDPK1 | P16T-E | Human | Esophagus | ESCC | 7.32e-15 | 2.52e-01 | 0.1153 |
| 5170 | PDPK1 | P17T-E | Human | Esophagus | ESCC | 1.88e-05 | 2.14e-01 | 0.1278 |
| 5170 | PDPK1 | P19T-E | Human | Esophagus | ESCC | 5.11e-06 | 4.33e-01 | 0.1662 |
| 5170 | PDPK1 | P20T-E | Human | Esophagus | ESCC | 4.73e-14 | 2.67e-01 | 0.1124 |
| Page: 1 2 3 4 5 |
| Tissue | Expression Dynamics | Abbreviation |
| Cervix | 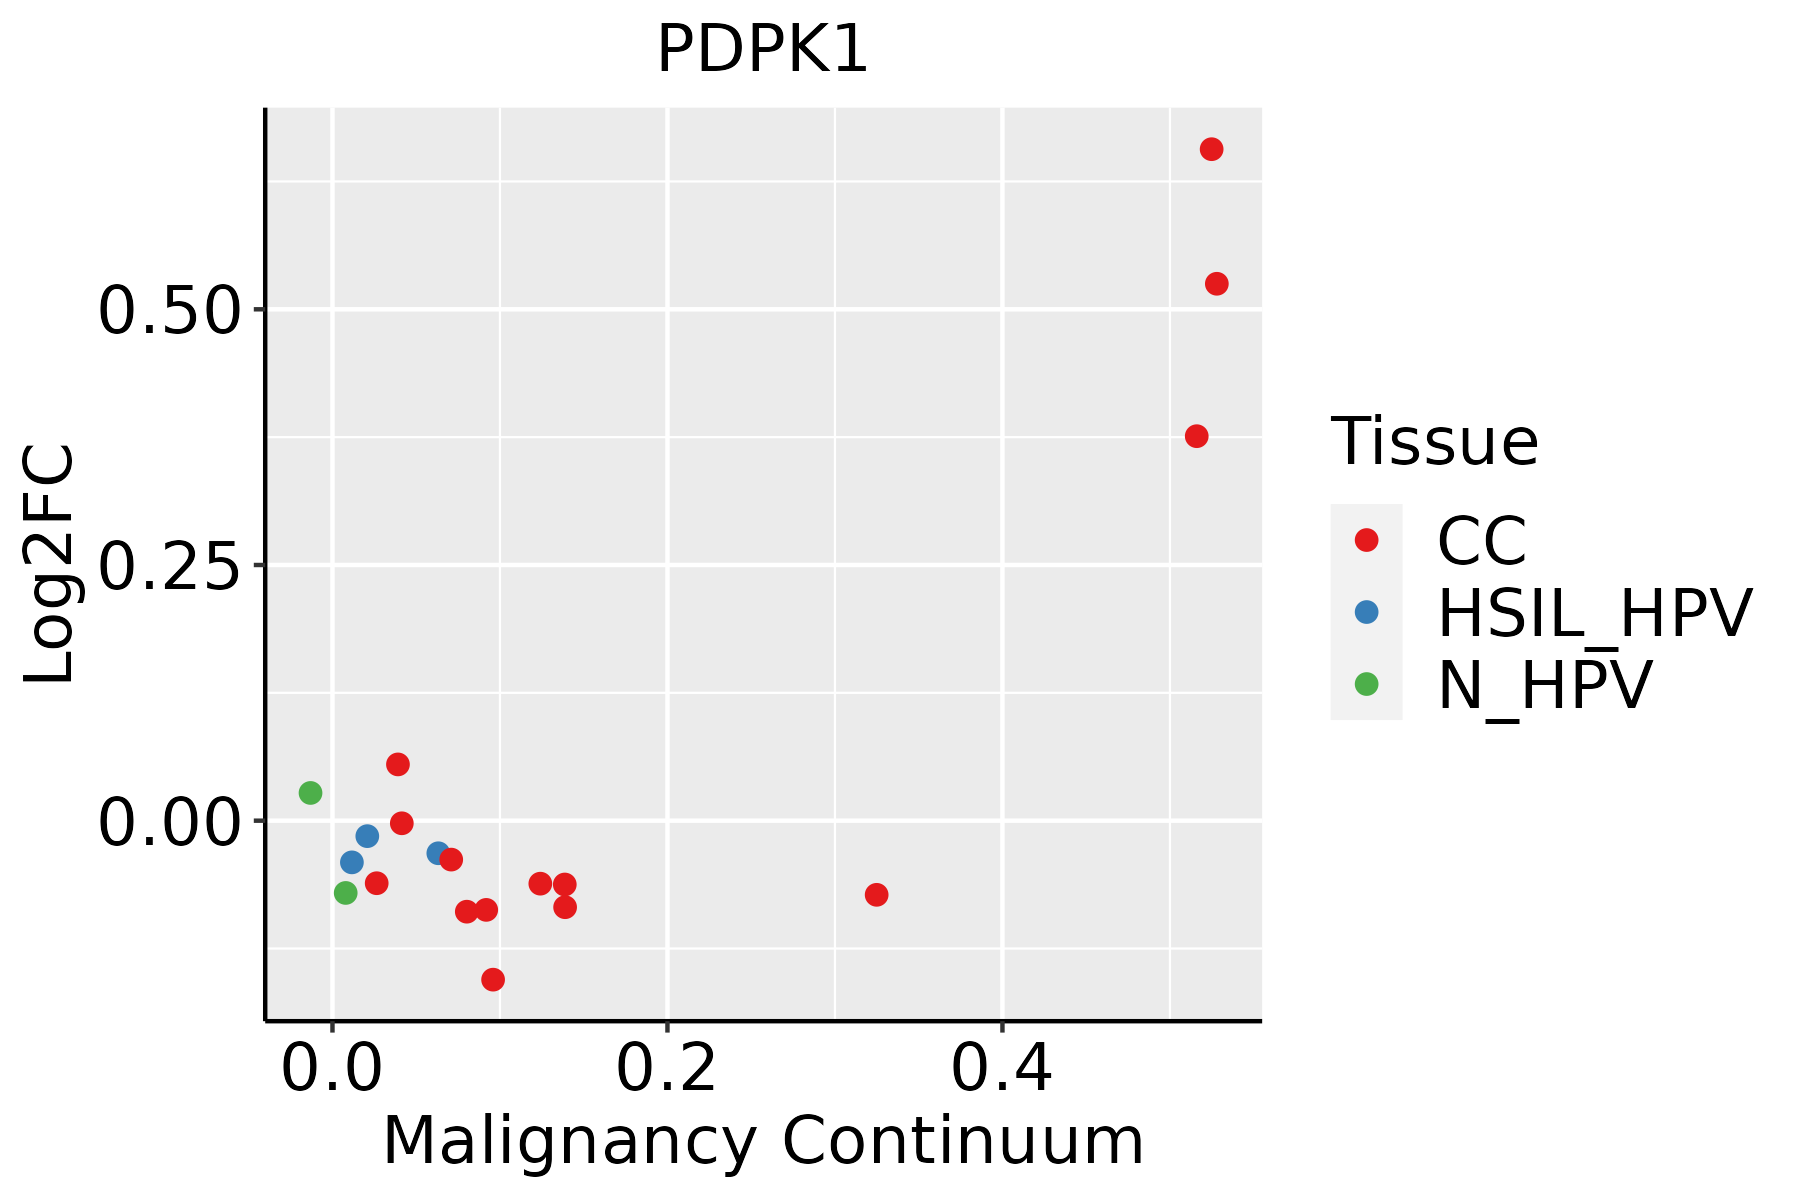 | CC: Cervix cancer |
| HSIL_HPV: HPV-infected high-grade squamous intraepithelial lesions | ||
| N_HPV: HPV-infected normal cervix | ||
| Esophagus | 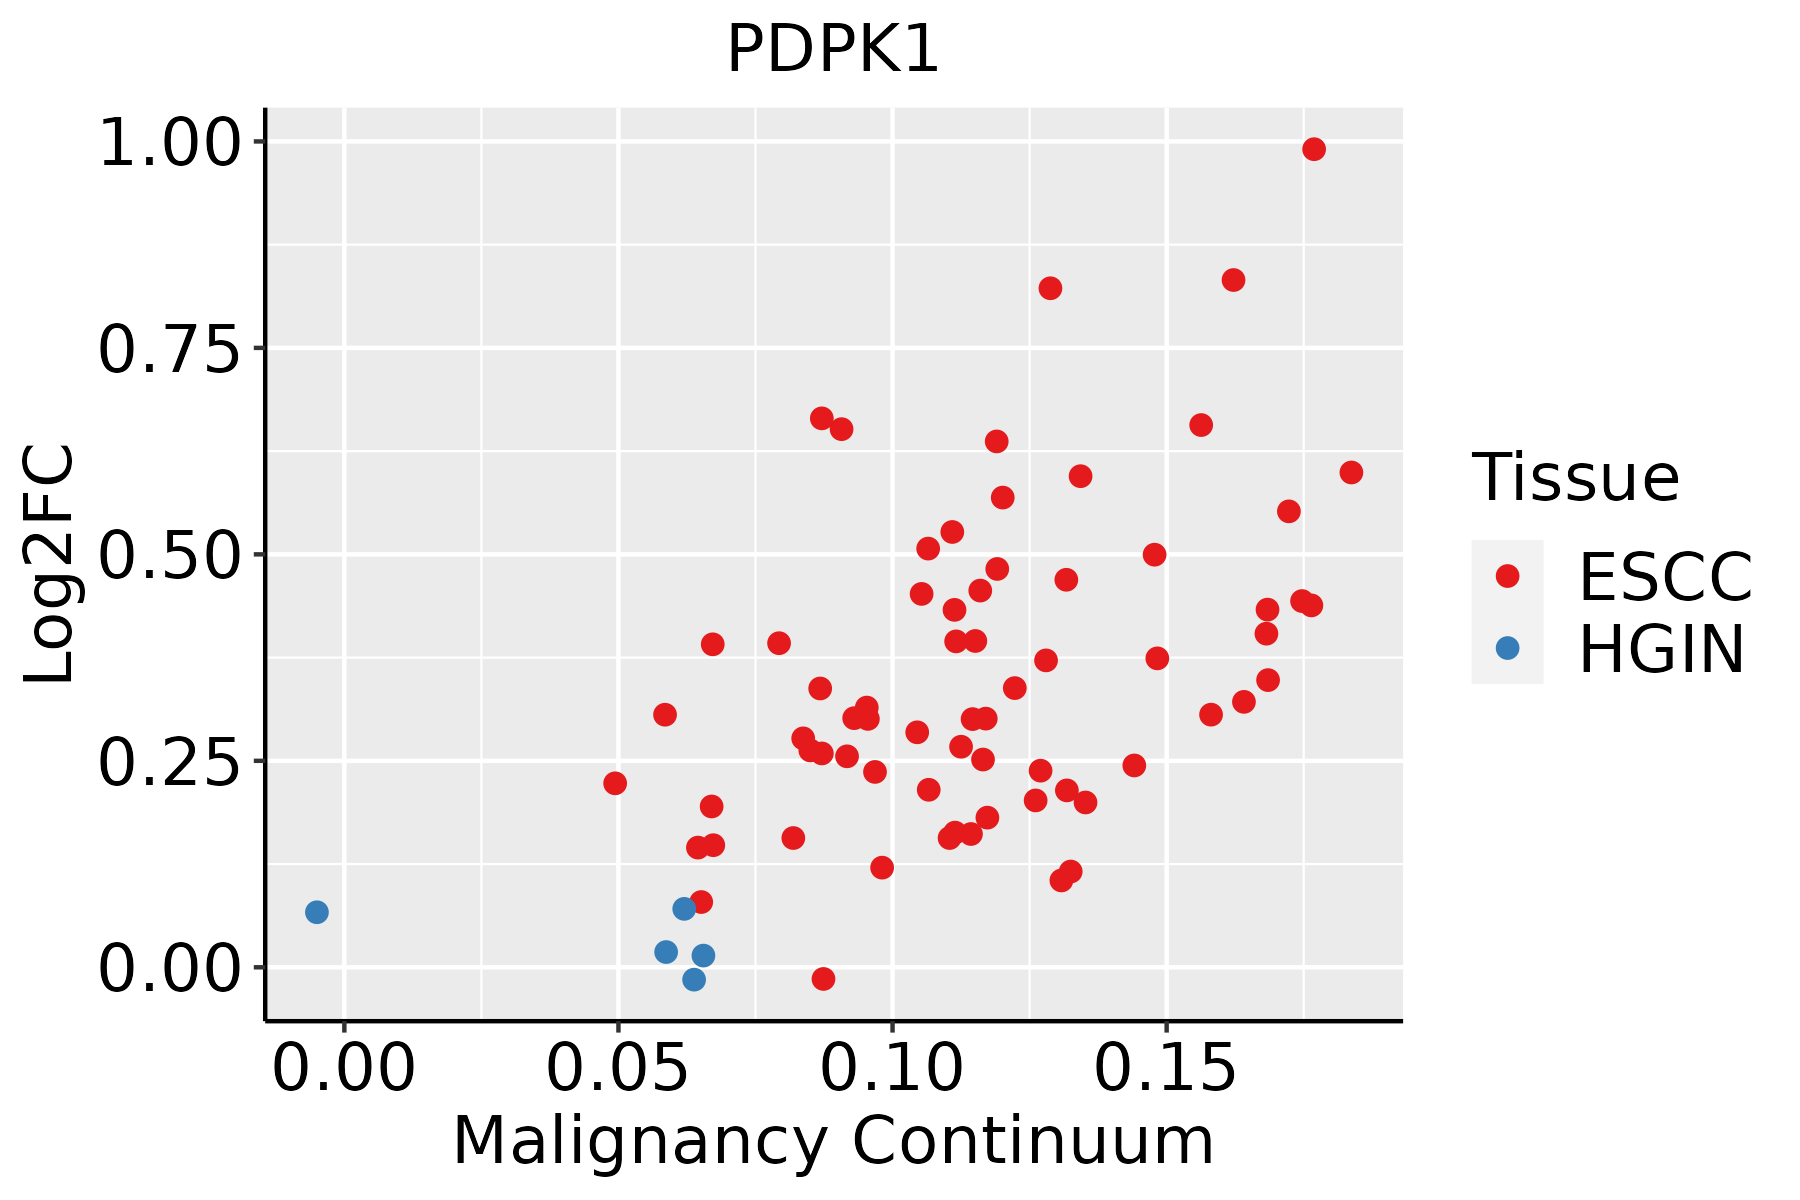 | ESCC: Esophageal squamous cell carcinoma |
| HGIN: High-grade intraepithelial neoplasias | ||
| LGIN: Low-grade intraepithelial neoplasias | ||
| Liver |  | HCC: Hepatocellular carcinoma |
| NAFLD: Non-alcoholic fatty liver disease | ||
| Oral Cavity | 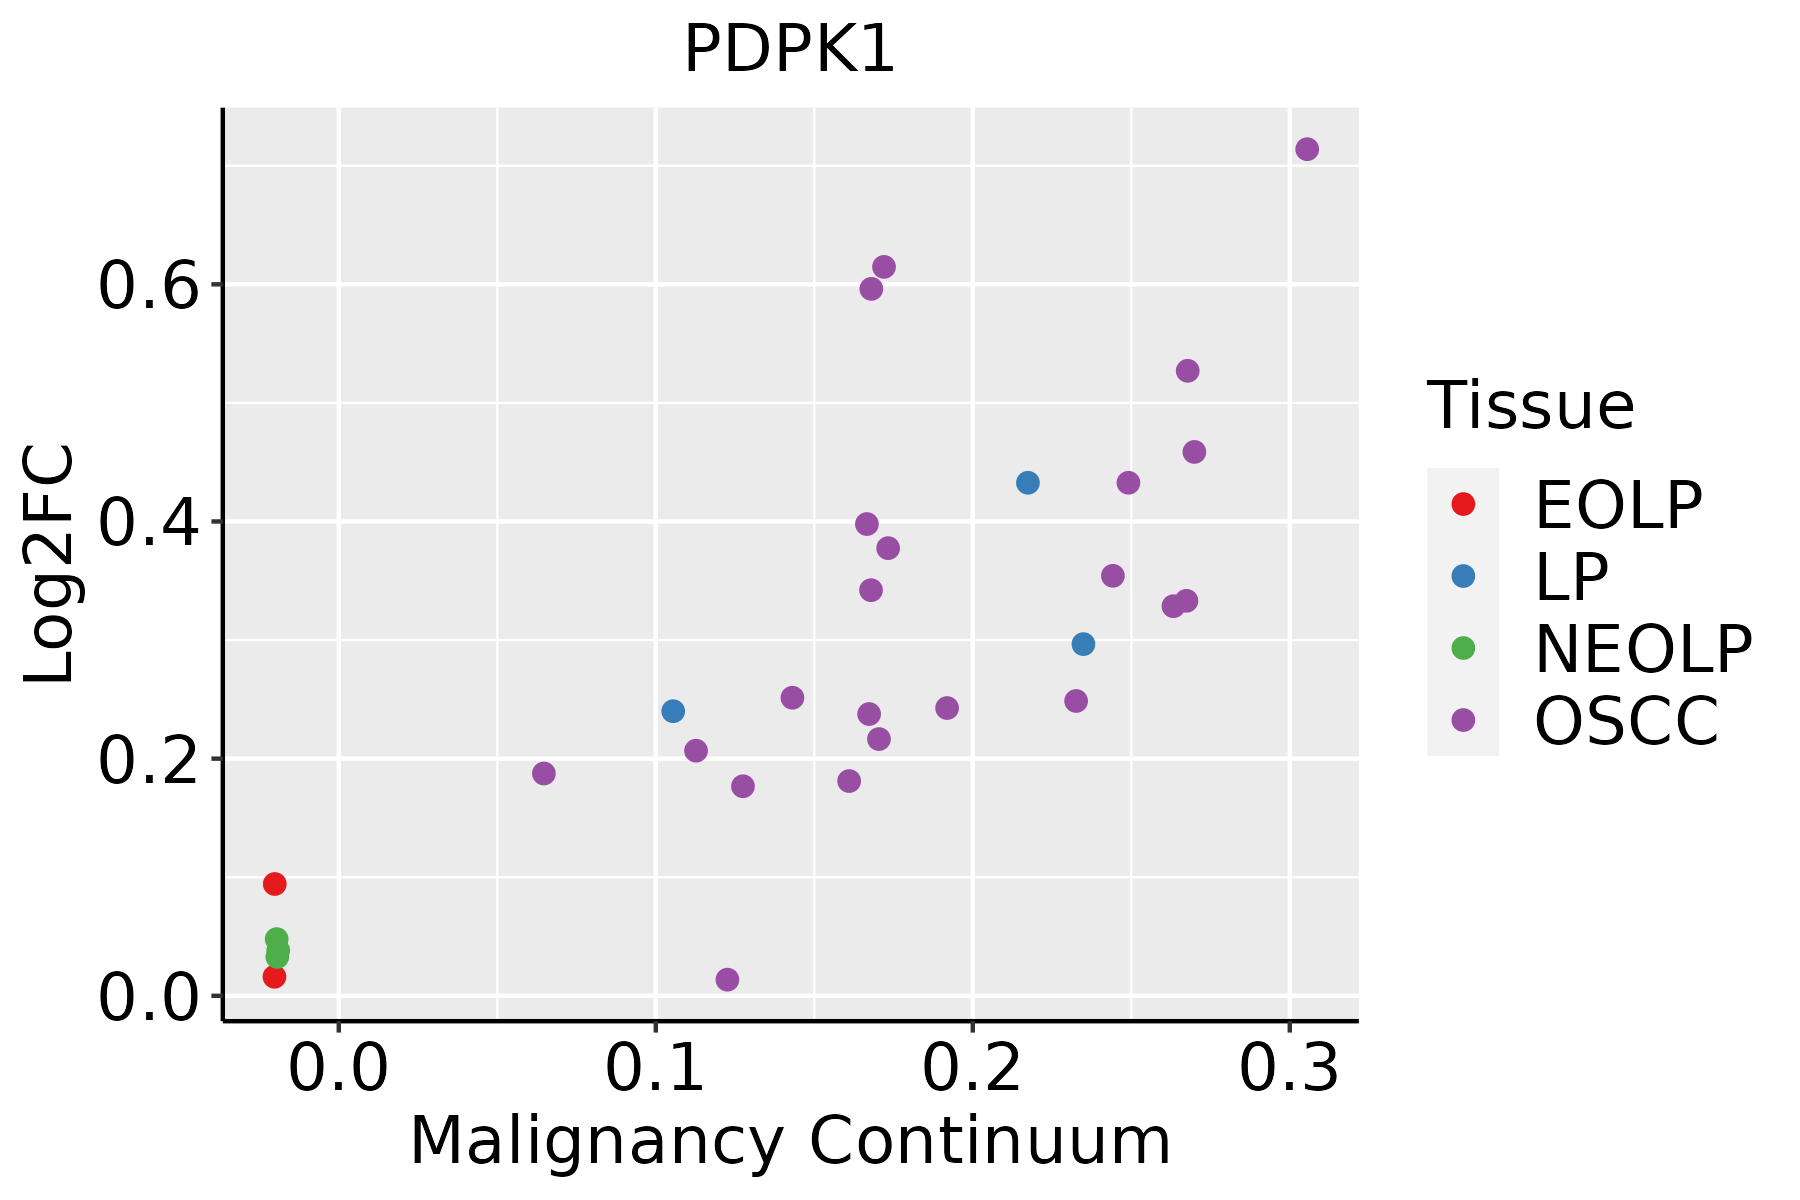 | EOLP: Erosive Oral lichen planus |
| LP: leukoplakia | ||
| NEOLP: Non-erosive oral lichen planus | ||
| OSCC: Oral squamous cell carcinoma | ||
| Thyroid | 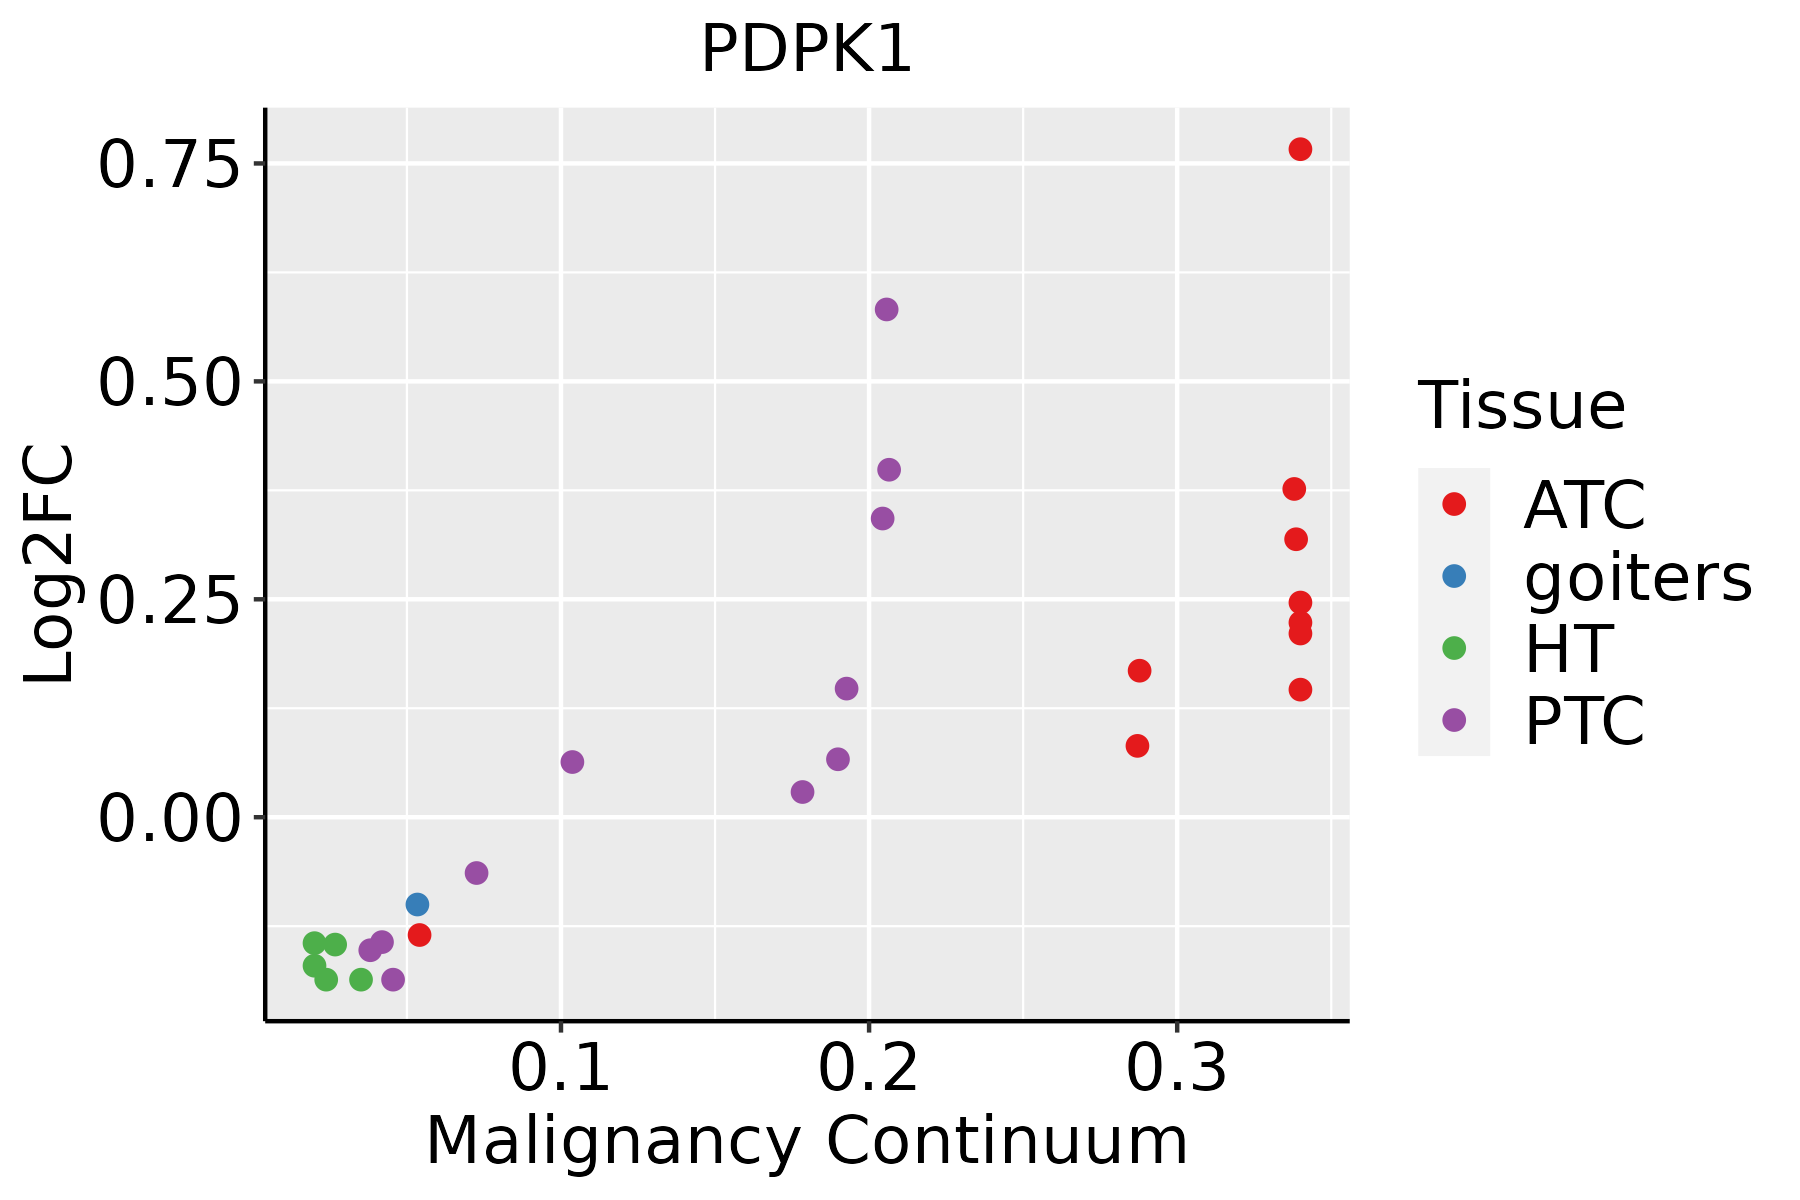 | ATC: Anaplastic thyroid cancer |
| HT: Hashimoto's thyroiditis | ||
| PTC: Papillary thyroid cancer |
| ∗log2FC in expression of this searched gene in stem-like cells from each diseased tissue sample relative to stem-like cells in normal samples in each tissue plotted against the malignancy continuum. Samples are colored based on if they are from different disease stage. |
Top |
Malignant transformation related pathway analysis |
| Find out the enriched GO biological processes and KEGG pathways involved in transition from healthy to precancer to cancer |
| Tissue | Disease Stage | Enriched GO biological Processes |
| Colorectum | AD |  |
| Colorectum | SER |  |
| Colorectum | MSS |  |
| Colorectum | MSI-H |  |
| Colorectum | FAP |  |
| ∗Top 15 enriched GO BP terms are showed in the bar plot of each disease state in each tissue. Each row represents a significant GO biological process which is colored according to the -log10(p.adjust). |
| Page: 1 2 3 4 5 6 7 8 9 |
| GO ID | Tissue | Disease Stage | Description | Gene Ratio | Bg Ratio | pvalue | p.adjust | Count |
| GO:00027644 | Cervix | CC | immune response-regulating signaling pathway | 97/2311 | 468/18723 | 1.49e-07 | 7.07e-06 | 97 |
| GO:00106349 | Cervix | CC | positive regulation of epithelial cell migration | 47/2311 | 176/18723 | 1.73e-07 | 8.01e-06 | 47 |
| GO:00343298 | Cervix | CC | cell junction assembly | 88/2311 | 420/18723 | 3.42e-07 | 1.38e-05 | 88 |
| GO:00480417 | Cervix | CC | focal adhesion assembly | 28/2311 | 87/18723 | 9.86e-07 | 3.45e-05 | 28 |
| GO:19043779 | Cervix | CC | positive regulation of protein localization to cell periphery | 24/2311 | 69/18723 | 1.21e-06 | 4.15e-05 | 24 |
| GO:009719110 | Cervix | CC | extrinsic apoptotic signaling pathway | 52/2311 | 219/18723 | 2.06e-06 | 6.34e-05 | 52 |
| GO:005134810 | Cervix | CC | negative regulation of transferase activity | 60/2311 | 268/18723 | 2.77e-06 | 8.02e-05 | 60 |
| GO:004593610 | Cervix | CC | negative regulation of phosphate metabolic process | 88/2311 | 441/18723 | 2.92e-06 | 8.27e-05 | 88 |
| GO:001056310 | Cervix | CC | negative regulation of phosphorus metabolic process | 88/2311 | 442/18723 | 3.21e-06 | 8.77e-05 | 88 |
| GO:19030788 | Cervix | CC | positive regulation of protein localization to plasma membrane | 21/2311 | 62/18723 | 8.91e-06 | 2.03e-04 | 21 |
| GO:00435427 | Cervix | CC | endothelial cell migration | 60/2311 | 279/18723 | 1.05e-05 | 2.33e-04 | 60 |
| GO:004232610 | Cervix | CC | negative regulation of phosphorylation | 77/2311 | 385/18723 | 1.09e-05 | 2.38e-04 | 77 |
| GO:00105944 | Cervix | CC | regulation of endothelial cell migration | 52/2311 | 232/18723 | 1.20e-05 | 2.54e-04 | 52 |
| GO:19016538 | Cervix | CC | cellular response to peptide | 72/2311 | 359/18723 | 1.89e-05 | 3.48e-04 | 72 |
| GO:00506794 | Cervix | CC | positive regulation of epithelial cell proliferation | 47/2311 | 207/18723 | 2.18e-05 | 3.90e-04 | 47 |
| GO:19054778 | Cervix | CC | positive regulation of protein localization to membrane | 29/2311 | 106/18723 | 2.29e-05 | 4.01e-04 | 29 |
| GO:000193310 | Cervix | CC | negative regulation of protein phosphorylation | 69/2311 | 342/18723 | 2.29e-05 | 4.01e-04 | 69 |
| GO:00516567 | Cervix | CC | establishment of organelle localization | 76/2311 | 390/18723 | 3.17e-05 | 5.21e-04 | 76 |
| GO:000646910 | Cervix | CC | negative regulation of protein kinase activity | 47/2311 | 212/18723 | 4.13e-05 | 6.36e-04 | 47 |
| GO:00431228 | Cervix | CC | regulation of I-kappaB kinase/NF-kappaB signaling | 53/2311 | 249/18723 | 4.50e-05 | 6.87e-04 | 53 |
| Page: 1 2 3 4 5 6 7 8 9 10 11 12 13 14 15 16 17 18 19 20 21 22 23 24 25 |
| Pathway ID | Tissue | Disease Stage | Description | Gene Ratio | Bg Ratio | pvalue | p.adjust | qvalue | Count |
| hsa0520820 | Cervix | CC | Chemical carcinogenesis - reactive oxygen species | 92/1267 | 223/8465 | 4.71e-22 | 5.09e-20 | 3.01e-20 | 92 |
| hsa0541720 | Cervix | CC | Lipid and atherosclerosis | 65/1267 | 215/8465 | 6.47e-09 | 1.10e-07 | 6.52e-08 | 65 |
| hsa0520516 | Cervix | CC | Proteoglycans in cancer | 60/1267 | 205/8465 | 9.13e-08 | 1.18e-06 | 7.00e-07 | 60 |
| hsa0451010 | Cervix | CC | Focal adhesion | 59/1267 | 203/8465 | 1.53e-07 | 1.84e-06 | 1.09e-06 | 59 |
| hsa0514514 | Cervix | CC | Toxoplasmosis | 34/1267 | 112/8465 | 2.42e-05 | 1.82e-04 | 1.08e-04 | 34 |
| hsa0407110 | Cervix | CC | Sphingolipid signaling pathway | 35/1267 | 121/8465 | 5.70e-05 | 3.93e-04 | 2.32e-04 | 35 |
| hsa043609 | Cervix | CC | Axon guidance | 47/1267 | 182/8465 | 8.13e-05 | 5.38e-04 | 3.18e-04 | 47 |
| hsa04664 | Cervix | CC | Fc epsilon RI signaling pathway | 22/1267 | 68/8465 | 2.35e-04 | 1.31e-03 | 7.77e-04 | 22 |
| hsa0491918 | Cervix | CC | Thyroid hormone signaling pathway | 33/1267 | 121/8465 | 3.11e-04 | 1.65e-03 | 9.78e-04 | 33 |
| hsa042109 | Cervix | CC | Apoptosis | 36/1267 | 136/8465 | 3.21e-04 | 1.68e-03 | 9.91e-04 | 36 |
| hsa0472214 | Cervix | CC | Neurotrophin signaling pathway | 32/1267 | 119/8465 | 5.01e-04 | 2.42e-03 | 1.43e-03 | 32 |
| hsa052157 | Cervix | CC | Prostate cancer | 27/1267 | 97/8465 | 7.54e-04 | 3.39e-03 | 2.01e-03 | 27 |
| hsa0521310 | Cervix | CC | Endometrial cancer | 18/1267 | 58/8465 | 1.46e-03 | 6.30e-03 | 3.73e-03 | 18 |
| hsa052234 | Cervix | CC | Non-small cell lung cancer | 21/1267 | 72/8465 | 1.48e-03 | 6.32e-03 | 3.74e-03 | 21 |
| hsa046604 | Cervix | CC | T cell receptor signaling pathway | 25/1267 | 104/8465 | 9.52e-03 | 2.94e-02 | 1.74e-02 | 25 |
| hsa05208110 | Cervix | CC | Chemical carcinogenesis - reactive oxygen species | 92/1267 | 223/8465 | 4.71e-22 | 5.09e-20 | 3.01e-20 | 92 |
| hsa05417110 | Cervix | CC | Lipid and atherosclerosis | 65/1267 | 215/8465 | 6.47e-09 | 1.10e-07 | 6.52e-08 | 65 |
| hsa0520517 | Cervix | CC | Proteoglycans in cancer | 60/1267 | 205/8465 | 9.13e-08 | 1.18e-06 | 7.00e-07 | 60 |
| hsa0451014 | Cervix | CC | Focal adhesion | 59/1267 | 203/8465 | 1.53e-07 | 1.84e-06 | 1.09e-06 | 59 |
| hsa0514515 | Cervix | CC | Toxoplasmosis | 34/1267 | 112/8465 | 2.42e-05 | 1.82e-04 | 1.08e-04 | 34 |
| Page: 1 2 3 4 5 6 7 8 9 |
Top |
Cell-cell communication analysis |
| Identification of potential cell-cell interactions between two cell types and their ligand-receptor pairs for different disease states |
| Ligand | Receptor | LRpair | Pathway | Tissue | Disease Stage |
| Page: 1 |
Top |
Single-cell gene regulatory network inference analysis |
| Find out the significant the regulons (TFs) and the target genes of each regulon across cell types for different disease states |
| TF | Cell Type | Tissue | Disease Stage | Target Gene | RSS | Regulon Activity |
| ∗The dot plots of a searched regulon are shown for all cell subpopulations in each disease state of each tissue based on the regulon specific score inferred using pySCENIC and by calculating the average expression. |
| Page: 1 |
Top |
Somatic mutation of malignant transformation related genes |
| Annotation of somatic variants for genes involved in malignant transformation |
| Hugo Symbol | Variant Class | Variant Classification | dbSNP RS | HGVSc | HGVSp | HGVSp Short | SWISSPROT | BIOTYPE | SIFT | PolyPhen | Tumor Sample Barcode | Tissue | Histology | Sex | Age | Stage | Therapy Types | Drugs | Outcome |
| PDPK1 | SNV | Missense_Mutation | c.1199N>A | p.Ser400Tyr | p.S400Y | O15530 | protein_coding | deleterious(0.04) | benign(0.044) | TCGA-D8-A27G-01 | Breast | breast invasive carcinoma | Female | >=65 | I/II | Unknown | Unknown | SD | |
| PDPK1 | deletion | Frame_Shift_Del | novel | c.1618delC | p.Gln540ArgfsTer65 | p.Q540Rfs*65 | O15530 | protein_coding | TCGA-D8-A27V-01 | Breast | breast invasive carcinoma | Female | <65 | I/II | Hormone Therapy | tamoxiphen | SD | ||
| PDPK1 | SNV | Missense_Mutation | c.191N>T | p.Ser64Phe | p.S64F | O15530 | protein_coding | deleterious(0.01) | benign(0.172) | TCGA-EK-A2H0-01 | Cervix | cervical & endocervical cancer | Female | <65 | I/II | Chemotherapy | cisplatin | CR | |
| PDPK1 | SNV | Missense_Mutation | c.1542N>A | p.Phe514Leu | p.F514L | O15530 | protein_coding | deleterious(0) | probably_damaging(0.99) | TCGA-FU-A3HZ-01 | Cervix | cervical & endocervical cancer | Female | <65 | I/II | Chemotherapy | cisplatin | CR | |
| PDPK1 | SNV | Missense_Mutation | c.191C>T | p.Ser64Phe | p.S64F | O15530 | protein_coding | deleterious(0.01) | benign(0.172) | TCGA-ZJ-A8QQ-01 | Cervix | cervical & endocervical cancer | Female | <65 | I/II | Chemotherapy | cisplatin | SD | |
| PDPK1 | SNV | Missense_Mutation | rs753919385 | c.169G>A | p.Glu57Lys | p.E57K | O15530 | protein_coding | tolerated_low_confidence(0.6) | benign(0.028) | TCGA-AD-6895-01 | Colorectum | colon adenocarcinoma | Male | >=65 | III/IV | Unknown | Unknown | SD |
| PDPK1 | SNV | Missense_Mutation | novel | c.1565N>T | p.Thr522Met | p.T522M | O15530 | protein_coding | deleterious(0) | probably_damaging(0.97) | TCGA-AZ-4315-01 | Colorectum | colon adenocarcinoma | Male | <65 | I/II | Unknown | Unknown | SD |
| PDPK1 | SNV | Missense_Mutation | rs753410336 | c.1396C>T | p.Arg466Trp | p.R466W | O15530 | protein_coding | deleterious(0) | probably_damaging(0.981) | TCGA-AG-3725-01 | Colorectum | rectum adenocarcinoma | Female | >=65 | III/IV | Unknown | Unknown | SD |
| PDPK1 | SNV | Missense_Mutation | c.1514N>A | p.Arg505Gln | p.R505Q | O15530 | protein_coding | tolerated(0.05) | benign(0.177) | TCGA-A5-A0G2-01 | Endometrium | uterine corpus endometrioid carcinoma | Female | <65 | III/IV | Unknown | Unknown | SD | |
| PDPK1 | SNV | Missense_Mutation | c.742T>C | p.Tyr248His | p.Y248H | O15530 | protein_coding | deleterious(0) | probably_damaging(0.968) | TCGA-AP-A051-01 | Endometrium | uterine corpus endometrioid carcinoma | Female | >=65 | I/II | Unknown | Unknown | SD |
| Page: 1 2 3 |
Top |
Related drugs of malignant transformation related genes |
| Identification of chemicals and drugs interact with genes involved in malignant transfromation |
| (DGIdb 4.0) |
| Entrez ID | Symbol | Category | Interaction Types | Drug Claim Name | Drug Name | PMIDs |
| 5170 | PDPK1 | CLINICALLY ACTIONABLE, KINASE, DRUGGABLE GENOME, SERINE THREONINE KINASE, ENZYME | inhibitor | 249565687 | ||
| 5170 | PDPK1 | CLINICALLY ACTIONABLE, KINASE, DRUGGABLE GENOME, SERINE THREONINE KINASE, ENZYME | AR-12 | AR-12 | ||
| 5170 | PDPK1 | CLINICALLY ACTIONABLE, KINASE, DRUGGABLE GENOME, SERINE THREONINE KINASE, ENZYME | SOTRASTAURIN | SOTRASTAURIN | ||
| 5170 | PDPK1 | CLINICALLY ACTIONABLE, KINASE, DRUGGABLE GENOME, SERINE THREONINE KINASE, ENZYME | RG-1530 | RG-1530 | ||
| 5170 | PDPK1 | CLINICALLY ACTIONABLE, KINASE, DRUGGABLE GENOME, SERINE THREONINE KINASE, ENZYME | TOZASERTIB | TOZASERTIB | ||
| 5170 | PDPK1 | CLINICALLY ACTIONABLE, KINASE, DRUGGABLE GENOME, SERINE THREONINE KINASE, ENZYME | inhibitor | 249565590 | CHEMBL1236539 | |
| 5170 | PDPK1 | CLINICALLY ACTIONABLE, KINASE, DRUGGABLE GENOME, SERINE THREONINE KINASE, ENZYME | CYC-116 | CYC-116 | ||
| 5170 | PDPK1 | CLINICALLY ACTIONABLE, KINASE, DRUGGABLE GENOME, SERINE THREONINE KINASE, ENZYME | inhibitor | 249565685 | AR-12 | |
| 5170 | PDPK1 | CLINICALLY ACTIONABLE, KINASE, DRUGGABLE GENOME, SERINE THREONINE KINASE, ENZYME | PF-562271 | PF-00562271 | ||
| 5170 | PDPK1 | CLINICALLY ACTIONABLE, KINASE, DRUGGABLE GENOME, SERINE THREONINE KINASE, ENZYME | TAE-684 | TAE-684 |
| Page: 1 2 3 |

Copyright 2023-Present -The University of Texas Health Science Center at Houston |