
|
|||||
|
 | |
| |
| |
| |
| |
| |
|
Gene: PDE8B |
Gene summary for PDE8B |
| Gene information | Species | Human | Gene symbol | PDE8B | Gene ID | 8622 |
| Gene name | phosphodiesterase 8B | |
| Gene Alias | ADSD | |
| Cytomap | 5q13.3 | |
| Gene Type | protein-coding | GO ID | GO:0006139 | UniProtAcc | B3KN77 |
Top |
Malignant transformation analysis |
| Identification of the aberrant gene expression in precancerous and cancerous lesions by comparing the gene expression of stem-like cells in diseased tissues with normal stem cells |
| Entrez ID | Symbol | Replicates | Species | Organ | Tissue | Adj P-value | Log2FC | Malignancy |
| 8622 | PDE8B | RNA-P25T1-P25T1-1 | Human | Lung | AIS | 1.23e-12 | 6.94e-01 | -0.2116 |
| 8622 | PDE8B | RNA-P25T1-P25T1-3 | Human | Lung | AIS | 1.40e-04 | 6.24e-01 | -0.2107 |
| 8622 | PDE8B | RNA-P25T1-P25T1-4 | Human | Lung | AIS | 2.64e-13 | 7.44e-01 | -0.2119 |
| 8622 | PDE8B | HTA12-26-1 | Human | Pancreas | PDAC | 1.41e-09 | 6.11e-01 | 0.3728 |
| 8622 | PDE8B | HTA12-29-1 | Human | Pancreas | PDAC | 1.34e-25 | 7.43e-01 | 0.3722 |
| 8622 | PDE8B | Adj_PTCwithHT_6 | Human | Thyroid | HT | 7.43e-16 | -5.12e-01 | 0.02 |
| 8622 | PDE8B | Adj_PTCwithHT_8 | Human | Thyroid | HT | 4.36e-03 | -4.36e-01 | 0.0267 |
| 8622 | PDE8B | PTCwithHT_1 | Human | Thyroid | HT | 3.12e-02 | -5.12e-01 | 0.0238 |
| 8622 | PDE8B | PTCwithHT_6 | Human | Thyroid | HT | 1.58e-09 | -5.01e-01 | 0.02 |
| 8622 | PDE8B | PTCwithHT_8 | Human | Thyroid | HT | 1.36e-05 | -4.23e-01 | 0.0351 |
| 8622 | PDE8B | PTCwithoutHT_2 | Human | Thyroid | PTC | 6.21e-12 | -4.84e-01 | 0.0419 |
| 8622 | PDE8B | male-WTA | Human | Thyroid | PTC | 3.65e-37 | -4.23e-02 | 0.1037 |
| 8622 | PDE8B | PTC01 | Human | Thyroid | PTC | 7.63e-03 | 2.25e-01 | 0.1899 |
| 8622 | PDE8B | PTC04 | Human | Thyroid | PTC | 5.80e-20 | 8.74e-01 | 0.1927 |
| 8622 | PDE8B | PTC05 | Human | Thyroid | PTC | 3.11e-11 | 1.11e+00 | 0.2065 |
| 8622 | PDE8B | PTC06 | Human | Thyroid | PTC | 4.68e-11 | 5.93e-01 | 0.2057 |
| 8622 | PDE8B | PTC07 | Human | Thyroid | PTC | 1.57e-45 | 1.15e+00 | 0.2044 |
| 8622 | PDE8B | ATC09 | Human | Thyroid | ATC | 2.42e-02 | -4.97e-01 | 0.2871 |
| 8622 | PDE8B | ATC12 | Human | Thyroid | ATC | 6.38e-17 | -5.12e-01 | 0.34 |
| 8622 | PDE8B | ATC13 | Human | Thyroid | ATC | 1.97e-17 | -1.22e-01 | 0.34 |
| Page: 1 2 |
| Tissue | Expression Dynamics | Abbreviation |
| Lung |  | AAH: Atypical adenomatous hyperplasia |
| AIS: Adenocarcinoma in situ | ||
| IAC: Invasive lung adenocarcinoma | ||
| MIA: Minimally invasive adenocarcinoma | ||
| Thyroid | 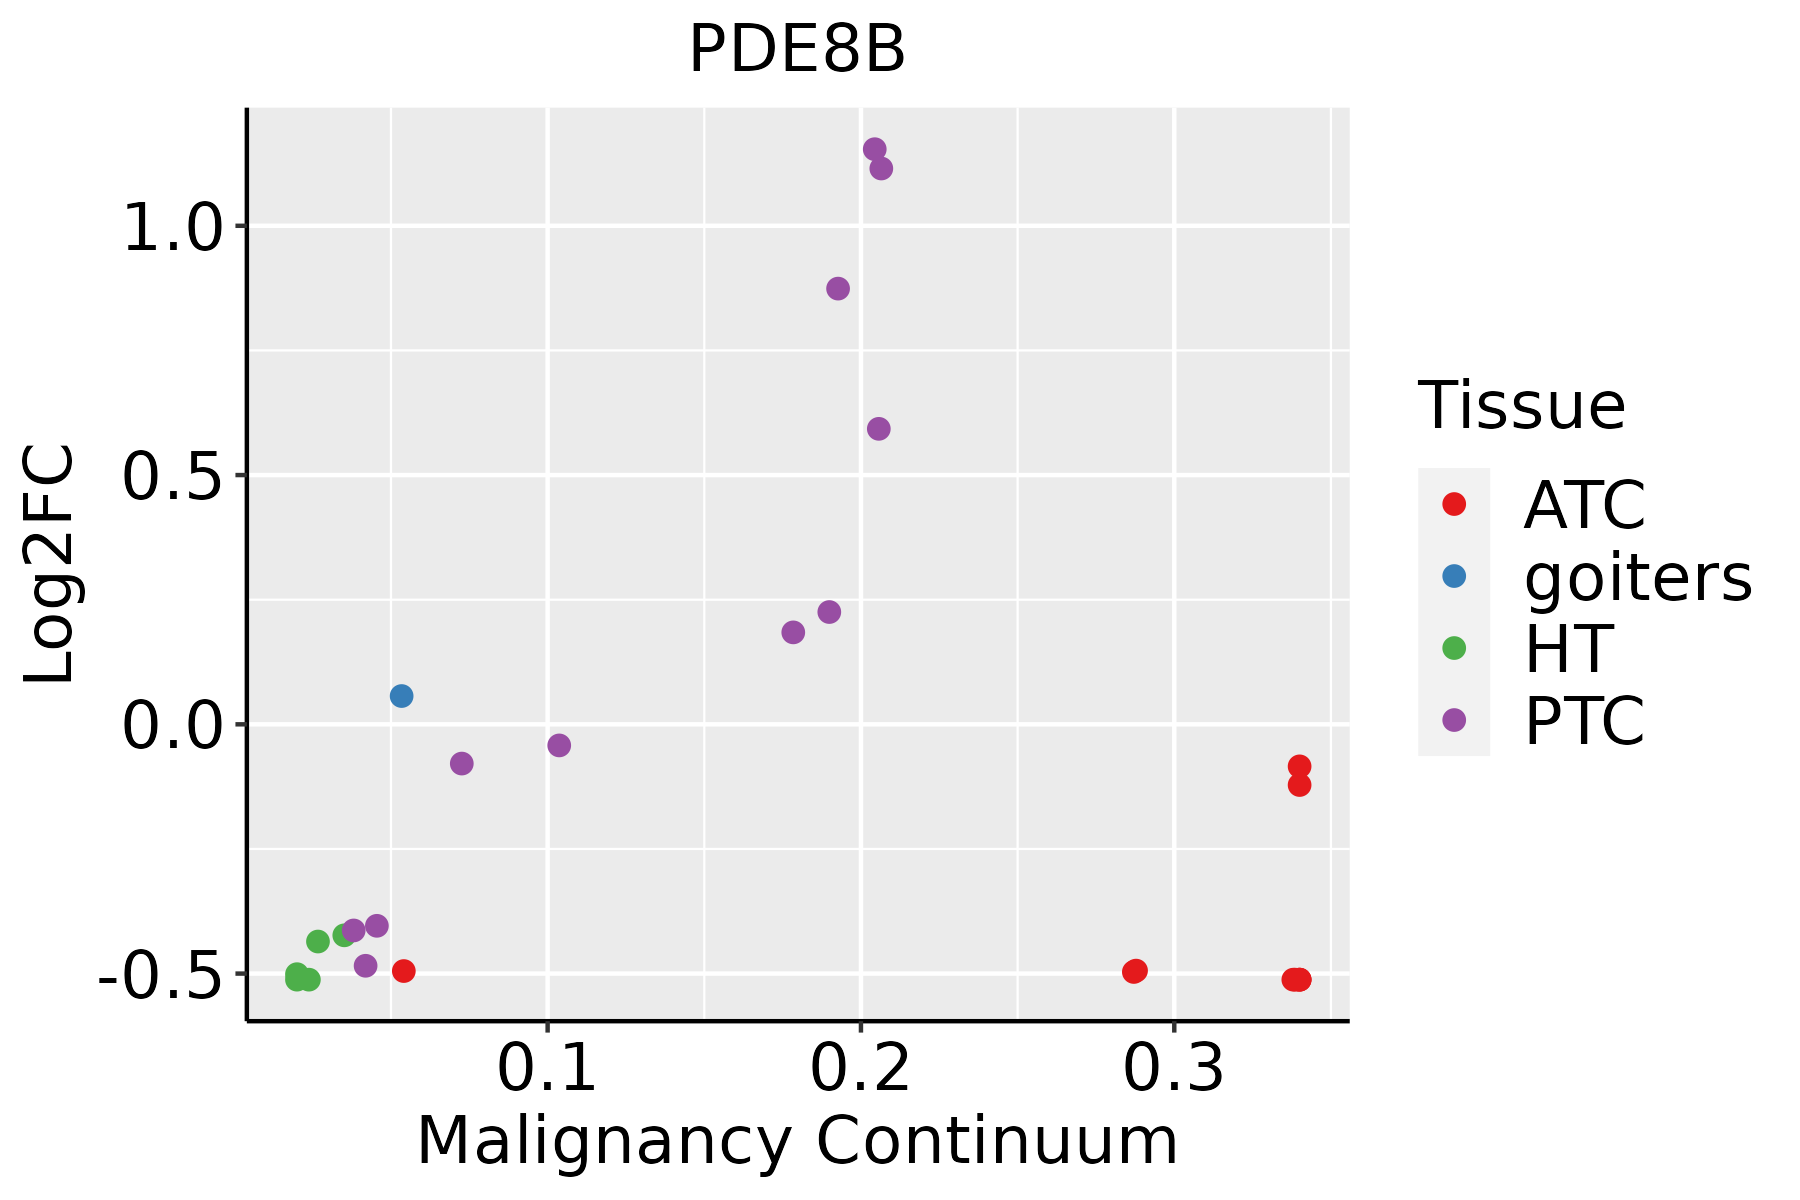 | ATC: Anaplastic thyroid cancer |
| HT: Hashimoto's thyroiditis | ||
| PTC: Papillary thyroid cancer |
| ∗log2FC in expression of this searched gene in stem-like cells from each diseased tissue sample relative to stem-like cells in normal samples in each tissue plotted against the malignancy continuum. Samples are colored based on if they are from different disease stage. |
Top |
Malignant transformation related pathway analysis |
| Find out the enriched GO biological processes and KEGG pathways involved in transition from healthy to precancer to cancer |
| Tissue | Disease Stage | Enriched GO biological Processes |
| Colorectum | AD |  |
| Colorectum | SER |  |
| Colorectum | MSS |  |
| Colorectum | MSI-H |  |
| Colorectum | FAP |  |
| ∗Top 15 enriched GO BP terms are showed in the bar plot of each disease state in each tissue. Each row represents a significant GO biological process which is colored according to the -log10(p.adjust). |
| Page: 1 2 3 4 5 6 7 8 9 |
| GO ID | Tissue | Disease Stage | Description | Gene Ratio | Bg Ratio | pvalue | p.adjust | Count |
| GO:000675325 | Thyroid | PTC | nucleoside phosphate metabolic process | 205/5968 | 497/18723 | 5.24e-06 | 6.35e-05 | 205 |
| GO:000911725 | Thyroid | PTC | nucleotide metabolic process | 202/5968 | 489/18723 | 5.46e-06 | 6.60e-05 | 202 |
| GO:003465525 | Thyroid | ATC | nucleobase-containing compound catabolic process | 217/6293 | 407/18723 | 1.20e-16 | 1.04e-14 | 217 |
| GO:004670024 | Thyroid | ATC | heterocycle catabolic process | 228/6293 | 445/18723 | 7.26e-15 | 4.50e-13 | 228 |
| GO:004427025 | Thyroid | ATC | cellular nitrogen compound catabolic process | 229/6293 | 451/18723 | 2.25e-14 | 1.27e-12 | 229 |
| GO:001943924 | Thyroid | ATC | aromatic compound catabolic process | 232/6293 | 467/18723 | 3.05e-13 | 1.44e-11 | 232 |
| GO:190136124 | Thyroid | ATC | organic cyclic compound catabolic process | 238/6293 | 495/18723 | 1.12e-11 | 4.12e-10 | 238 |
| GO:001969328 | Thyroid | ATC | ribose phosphate metabolic process | 184/6293 | 396/18723 | 5.87e-08 | 1.05e-06 | 184 |
| GO:000915029 | Thyroid | ATC | purine ribonucleotide metabolic process | 172/6293 | 368/18723 | 9.58e-08 | 1.64e-06 | 172 |
| GO:000925928 | Thyroid | ATC | ribonucleotide metabolic process | 178/6293 | 385/18723 | 1.47e-07 | 2.39e-06 | 178 |
| GO:007252128 | Thyroid | ATC | purine-containing compound metabolic process | 189/6293 | 416/18723 | 2.83e-07 | 4.29e-06 | 189 |
| GO:0006753111 | Thyroid | ATC | nucleoside phosphate metabolic process | 219/6293 | 497/18723 | 5.92e-07 | 8.29e-06 | 219 |
| GO:0009117112 | Thyroid | ATC | nucleotide metabolic process | 215/6293 | 489/18723 | 9.09e-07 | 1.20e-05 | 215 |
| GO:000616328 | Thyroid | ATC | purine nucleotide metabolic process | 177/6293 | 396/18723 | 2.39e-06 | 2.82e-05 | 177 |
| GO:19011363 | Thyroid | ATC | carbohydrate derivative catabolic process | 73/6293 | 172/18723 | 9.43e-03 | 3.47e-02 | 73 |
| GO:00725232 | Thyroid | ATC | purine-containing compound catabolic process | 26/6293 | 52/18723 | 1.05e-02 | 3.82e-02 | 26 |
| Page: 1 2 |
| Pathway ID | Tissue | Disease Stage | Description | Gene Ratio | Bg Ratio | pvalue | p.adjust | qvalue | Count |
| Page: 1 |
Top |
Cell-cell communication analysis |
| Identification of potential cell-cell interactions between two cell types and their ligand-receptor pairs for different disease states |
| Ligand | Receptor | LRpair | Pathway | Tissue | Disease Stage |
| Page: 1 |
Top |
Single-cell gene regulatory network inference analysis |
| Find out the significant the regulons (TFs) and the target genes of each regulon across cell types for different disease states |
| TF | Cell Type | Tissue | Disease Stage | Target Gene | RSS | Regulon Activity |
| ∗The dot plots of a searched regulon are shown for all cell subpopulations in each disease state of each tissue based on the regulon specific score inferred using pySCENIC and by calculating the average expression. |
| Page: 1 |
Top |
Somatic mutation of malignant transformation related genes |
| Annotation of somatic variants for genes involved in malignant transformation |
| Hugo Symbol | Variant Class | Variant Classification | dbSNP RS | HGVSc | HGVSp | HGVSp Short | SWISSPROT | BIOTYPE | SIFT | PolyPhen | Tumor Sample Barcode | Tissue | Histology | Sex | Age | Stage | Therapy Types | Drugs | Outcome |
| PDE8B | SNV | Missense_Mutation | rs760622866 | c.457N>A | p.Asp153Asn | p.D153N | O95263 | protein_coding | tolerated(0.06) | probably_damaging(0.928) | TCGA-AN-A046-01 | Breast | breast invasive carcinoma | Female | >=65 | I/II | Unknown | Unknown | SD |
| PDE8B | SNV | Missense_Mutation | rs539447103 | c.1921N>A | p.Asp641Asn | p.D641N | O95263 | protein_coding | deleterious(0) | benign(0.315) | TCGA-AN-A046-01 | Breast | breast invasive carcinoma | Female | >=65 | I/II | Unknown | Unknown | SD |
| PDE8B | SNV | Missense_Mutation | rs774186250 | c.1534N>A | p.Gly512Ser | p.G512S | O95263 | protein_coding | tolerated(0.06) | possibly_damaging(0.754) | TCGA-AR-A24S-01 | Breast | breast invasive carcinoma | Female | <65 | I/II | Hormone Therapy | anastrozole | SD |
| PDE8B | insertion | In_Frame_Ins | novel | c.2525_2526insGACCCATTTTCACAGGGTTGTTCTGAGAAACAGGAT | p.Thr842_Asp843insThrHisPheHisArgValValLeuArgAsnArgIle | p.T842_D843insTHFHRVVLRNRI | O95263 | protein_coding | TCGA-A8-A08F-01 | Breast | breast invasive carcinoma | Female | <65 | III/IV | Chemotherapy | 5-fluorouracil | CR | ||
| PDE8B | SNV | Missense_Mutation | c.722N>C | p.Asn241Thr | p.N241T | O95263 | protein_coding | tolerated(0.23) | possibly_damaging(0.838) | TCGA-Q1-A73P-01 | Cervix | cervical & endocervical cancer | Female | <65 | I/II | Unknown | Unknown | SD | |
| PDE8B | SNV | Missense_Mutation | rs769655505 | c.2344N>A | p.Val782Met | p.V782M | O95263 | protein_coding | deleterious(0) | probably_damaging(0.982) | TCGA-VS-A9UV-01 | Cervix | cervical & endocervical cancer | Female | >=65 | I/II | Unknown | Unknown | PD |
| PDE8B | SNV | Missense_Mutation | rs750904456 | c.644N>T | p.Ser215Leu | p.S215L | O95263 | protein_coding | tolerated(0.07) | benign(0.22) | TCGA-4T-AA8H-01 | Colorectum | colon adenocarcinoma | Female | <65 | I/II | Unknown | Unknown | SD |
| PDE8B | SNV | Missense_Mutation | c.831N>G | p.His277Gln | p.H277Q | O95263 | protein_coding | tolerated(0.22) | benign(0.006) | TCGA-AA-3844-01 | Colorectum | colon adenocarcinoma | Female | >=65 | III/IV | Chemotherapy | capecitabine | PD | |
| PDE8B | SNV | Missense_Mutation | rs750904456 | c.644N>T | p.Ser215Leu | p.S215L | O95263 | protein_coding | tolerated(0.07) | benign(0.22) | TCGA-AA-3984-01 | Colorectum | colon adenocarcinoma | Female | <65 | I/II | Unknown | Unknown | SD |
| PDE8B | SNV | Missense_Mutation | novel | c.2294N>C | p.Phe765Ser | p.F765S | O95263 | protein_coding | tolerated(0.36) | benign(0.006) | TCGA-AA-3984-01 | Colorectum | colon adenocarcinoma | Female | <65 | I/II | Unknown | Unknown | SD |
| Page: 1 2 3 4 5 6 7 8 9 10 11 12 |
Top |
Related drugs of malignant transformation related genes |
| Identification of chemicals and drugs interact with genes involved in malignant transfromation |
| (DGIdb 4.0) |
| Entrez ID | Symbol | Category | Interaction Types | Drug Claim Name | Drug Name | PMIDs |
| 8622 | PDE8B | DRUGGABLE GENOME, ENZYME | inhibitor | CHEMBL628 | PENTOXIFYLLINE | |
| 8622 | PDE8B | DRUGGABLE GENOME, ENZYME | inhibitor | CHEMBL932 | DIPYRIDAMOLE | |
| 8622 | PDE8B | DRUGGABLE GENOME, ENZYME | inhibitor | 178101509 | DIPYRIDAMOLE | |
| 8622 | PDE8B | DRUGGABLE GENOME, ENZYME | inhibitor | CHEMBL1200875 | FLAVOXATE HYDROCHLORIDE |
| Page: 1 |

Copyright 2023-Present -The University of Texas Health Science Center at Houston |