
|
|||||
|
 | |
| |
| |
| |
| |
| |
|
Gene: PCSK7 |
Gene summary for PCSK7 |
| Gene information | Species | Human | Gene symbol | PCSK7 | Gene ID | 9159 |
| Gene name | proprotein convertase subtilisin/kexin type 7 | |
| Gene Alias | LPC | |
| Cytomap | 11q23.3 | |
| Gene Type | protein-coding | GO ID | GO:0006508 | UniProtAcc | Q16549 |
Top |
Malignant transformation analysis |
| Identification of the aberrant gene expression in precancerous and cancerous lesions by comparing the gene expression of stem-like cells in diseased tissues with normal stem cells |
| Entrez ID | Symbol | Replicates | Species | Organ | Tissue | Adj P-value | Log2FC | Malignancy |
| 9159 | PCSK7 | HTA11_347_2000001011 | Human | Colorectum | AD | 3.22e-12 | 6.48e-01 | -0.1954 |
| 9159 | PCSK7 | HTA11_83_2000001011 | Human | Colorectum | SER | 3.63e-04 | 5.39e-01 | -0.1526 |
| 9159 | PCSK7 | HTA11_696_2000001011 | Human | Colorectum | AD | 1.84e-10 | 6.39e-01 | -0.1464 |
| 9159 | PCSK7 | HTA11_866_2000001011 | Human | Colorectum | AD | 1.17e-03 | 4.68e-01 | -0.1001 |
| 9159 | PCSK7 | HTA11_1391_2000001011 | Human | Colorectum | AD | 5.83e-04 | 5.51e-01 | -0.059 |
| 9159 | PCSK7 | HTA11_99999970781_79442 | Human | Colorectum | MSS | 8.22e-04 | -2.86e-01 | 0.294 |
| 9159 | PCSK7 | A015-C-203 | Human | Colorectum | FAP | 3.19e-27 | -3.28e-01 | -0.1294 |
| 9159 | PCSK7 | A015-C-204 | Human | Colorectum | FAP | 6.98e-03 | -1.78e-01 | -0.0228 |
| 9159 | PCSK7 | A014-C-040 | Human | Colorectum | FAP | 5.45e-04 | -4.73e-01 | -0.1184 |
| 9159 | PCSK7 | A002-C-201 | Human | Colorectum | FAP | 2.75e-09 | -2.99e-01 | 0.0324 |
| 9159 | PCSK7 | A002-C-203 | Human | Colorectum | FAP | 1.29e-04 | -8.00e-02 | 0.2786 |
| 9159 | PCSK7 | A001-C-119 | Human | Colorectum | FAP | 1.42e-08 | -4.54e-01 | -0.1557 |
| 9159 | PCSK7 | A001-C-108 | Human | Colorectum | FAP | 4.54e-15 | -3.00e-01 | -0.0272 |
| 9159 | PCSK7 | A002-C-205 | Human | Colorectum | FAP | 2.00e-18 | -4.36e-01 | -0.1236 |
| 9159 | PCSK7 | A001-C-104 | Human | Colorectum | FAP | 3.85e-03 | -1.97e-01 | 0.0184 |
| 9159 | PCSK7 | A015-C-006 | Human | Colorectum | FAP | 6.88e-13 | -4.91e-01 | -0.0994 |
| 9159 | PCSK7 | A015-C-106 | Human | Colorectum | FAP | 1.19e-09 | -1.91e-01 | -0.0511 |
| 9159 | PCSK7 | A002-C-114 | Human | Colorectum | FAP | 2.88e-14 | -4.37e-01 | -0.1561 |
| 9159 | PCSK7 | A015-C-104 | Human | Colorectum | FAP | 2.37e-31 | -3.90e-01 | -0.1899 |
| 9159 | PCSK7 | A001-C-014 | Human | Colorectum | FAP | 1.03e-17 | -3.60e-01 | 0.0135 |
| Page: 1 2 3 4 5 6 7 8 9 |
| Tissue | Expression Dynamics | Abbreviation |
| Colorectum (GSE201348) |  | FAP: Familial adenomatous polyposis |
| CRC: Colorectal cancer | ||
| Colorectum (HTA11) |  | AD: Adenomas |
| SER: Sessile serrated lesions | ||
| MSI-H: Microsatellite-high colorectal cancer | ||
| MSS: Microsatellite stable colorectal cancer | ||
| Esophagus |  | ESCC: Esophageal squamous cell carcinoma |
| HGIN: High-grade intraepithelial neoplasias | ||
| LGIN: Low-grade intraepithelial neoplasias | ||
| GC | 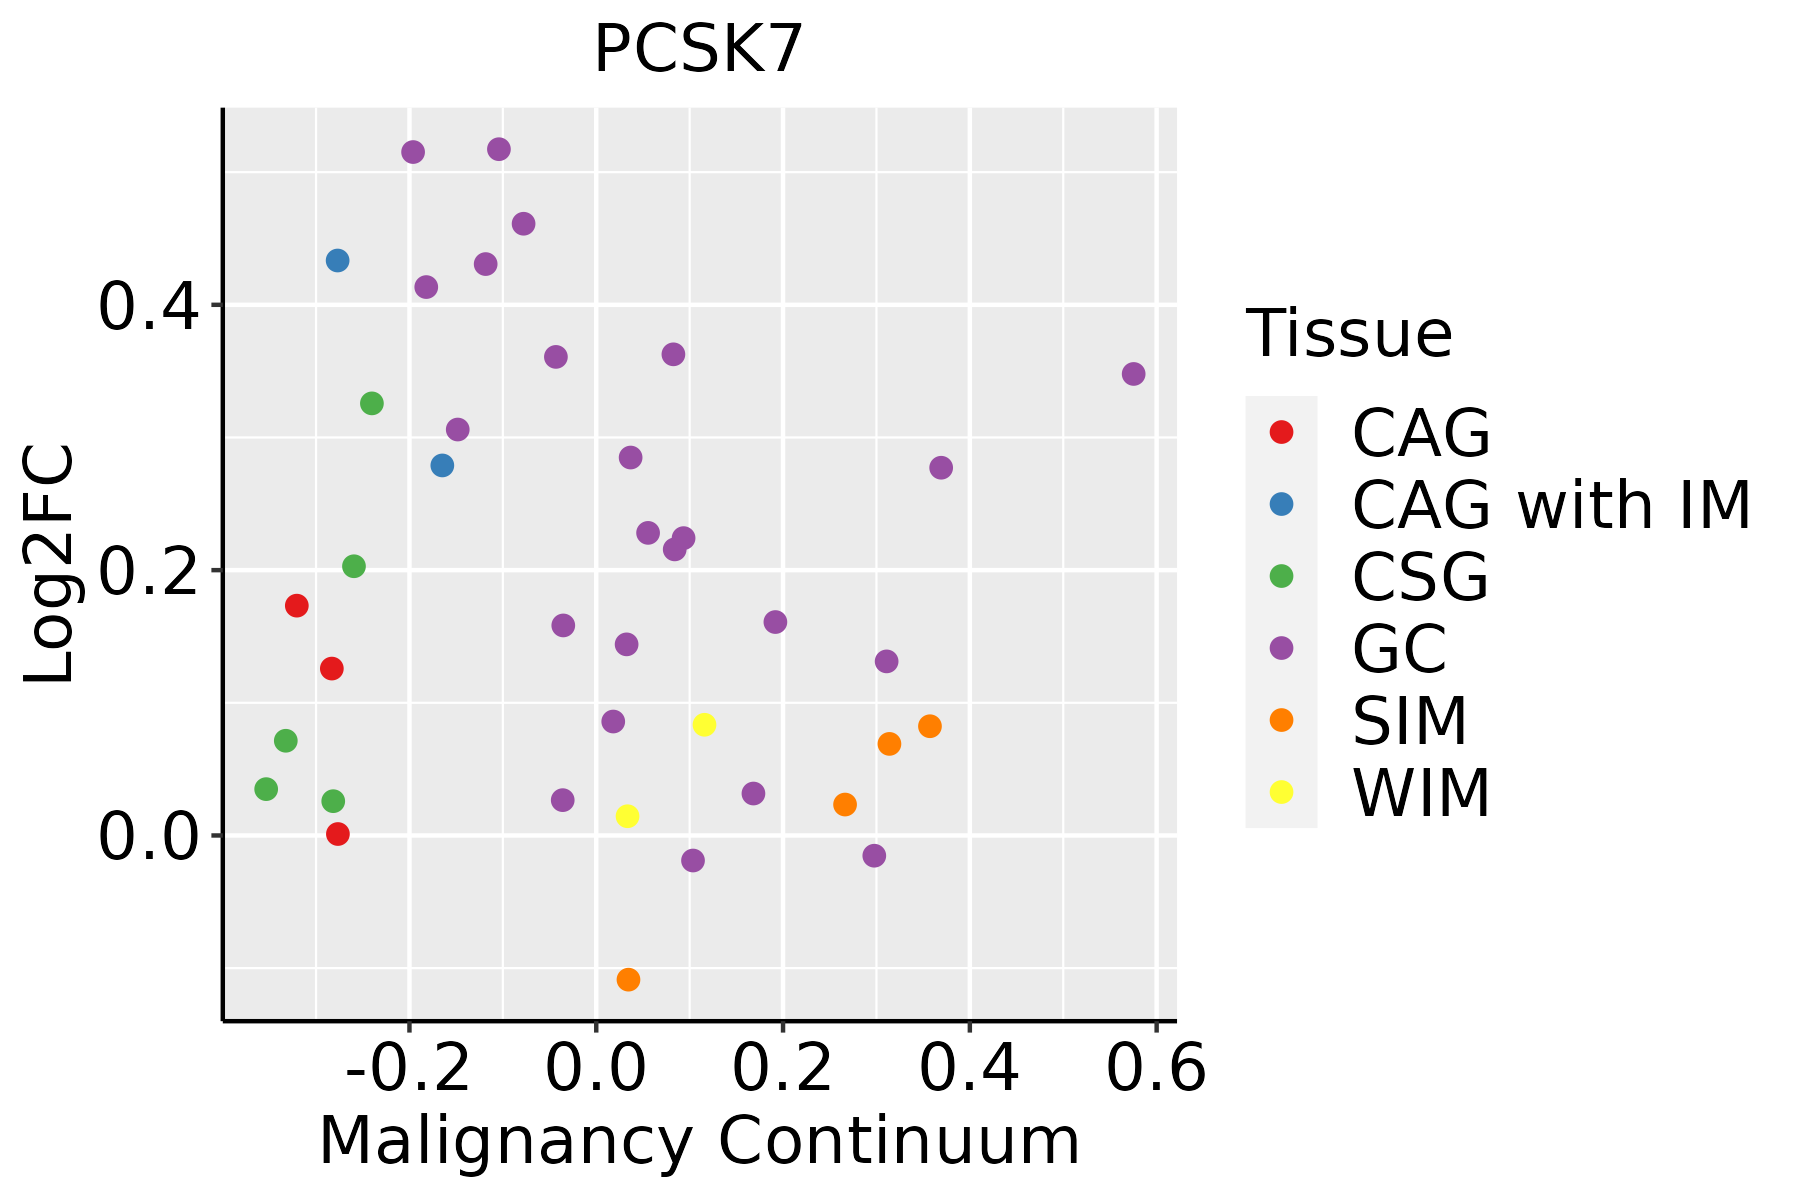 | CAG: Chronic atrophic gastritis |
| CAG with IM: Chronic atrophic gastritis with intestinal metaplasia | ||
| CSG: Chronic superficial gastritis | ||
| GC: Gastric cancer | ||
| SIM: Severe intestinal metaplasia | ||
| WIM: Wild intestinal metaplasia | ||
| Liver | 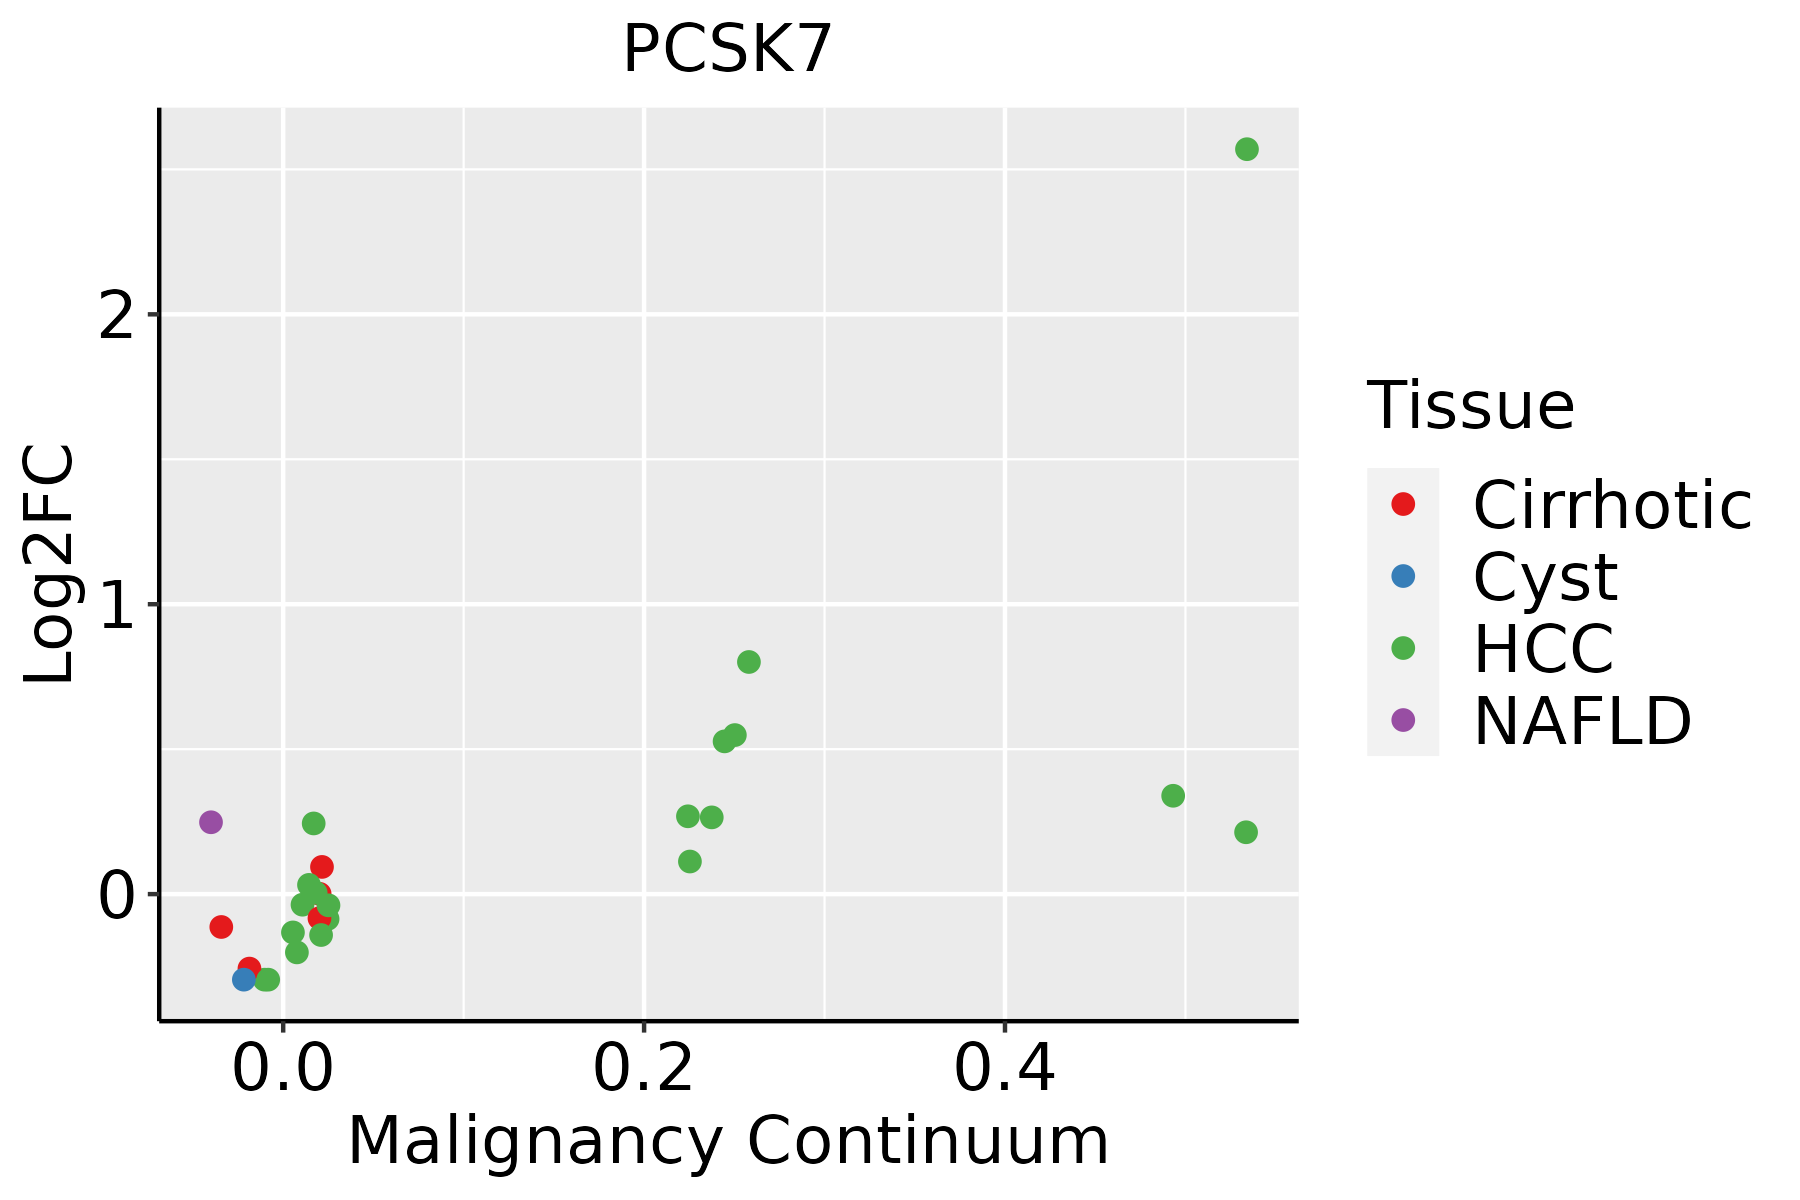 | HCC: Hepatocellular carcinoma |
| NAFLD: Non-alcoholic fatty liver disease | ||
| Oral Cavity |  | EOLP: Erosive Oral lichen planus |
| LP: leukoplakia | ||
| NEOLP: Non-erosive oral lichen planus | ||
| OSCC: Oral squamous cell carcinoma | ||
| Skin | 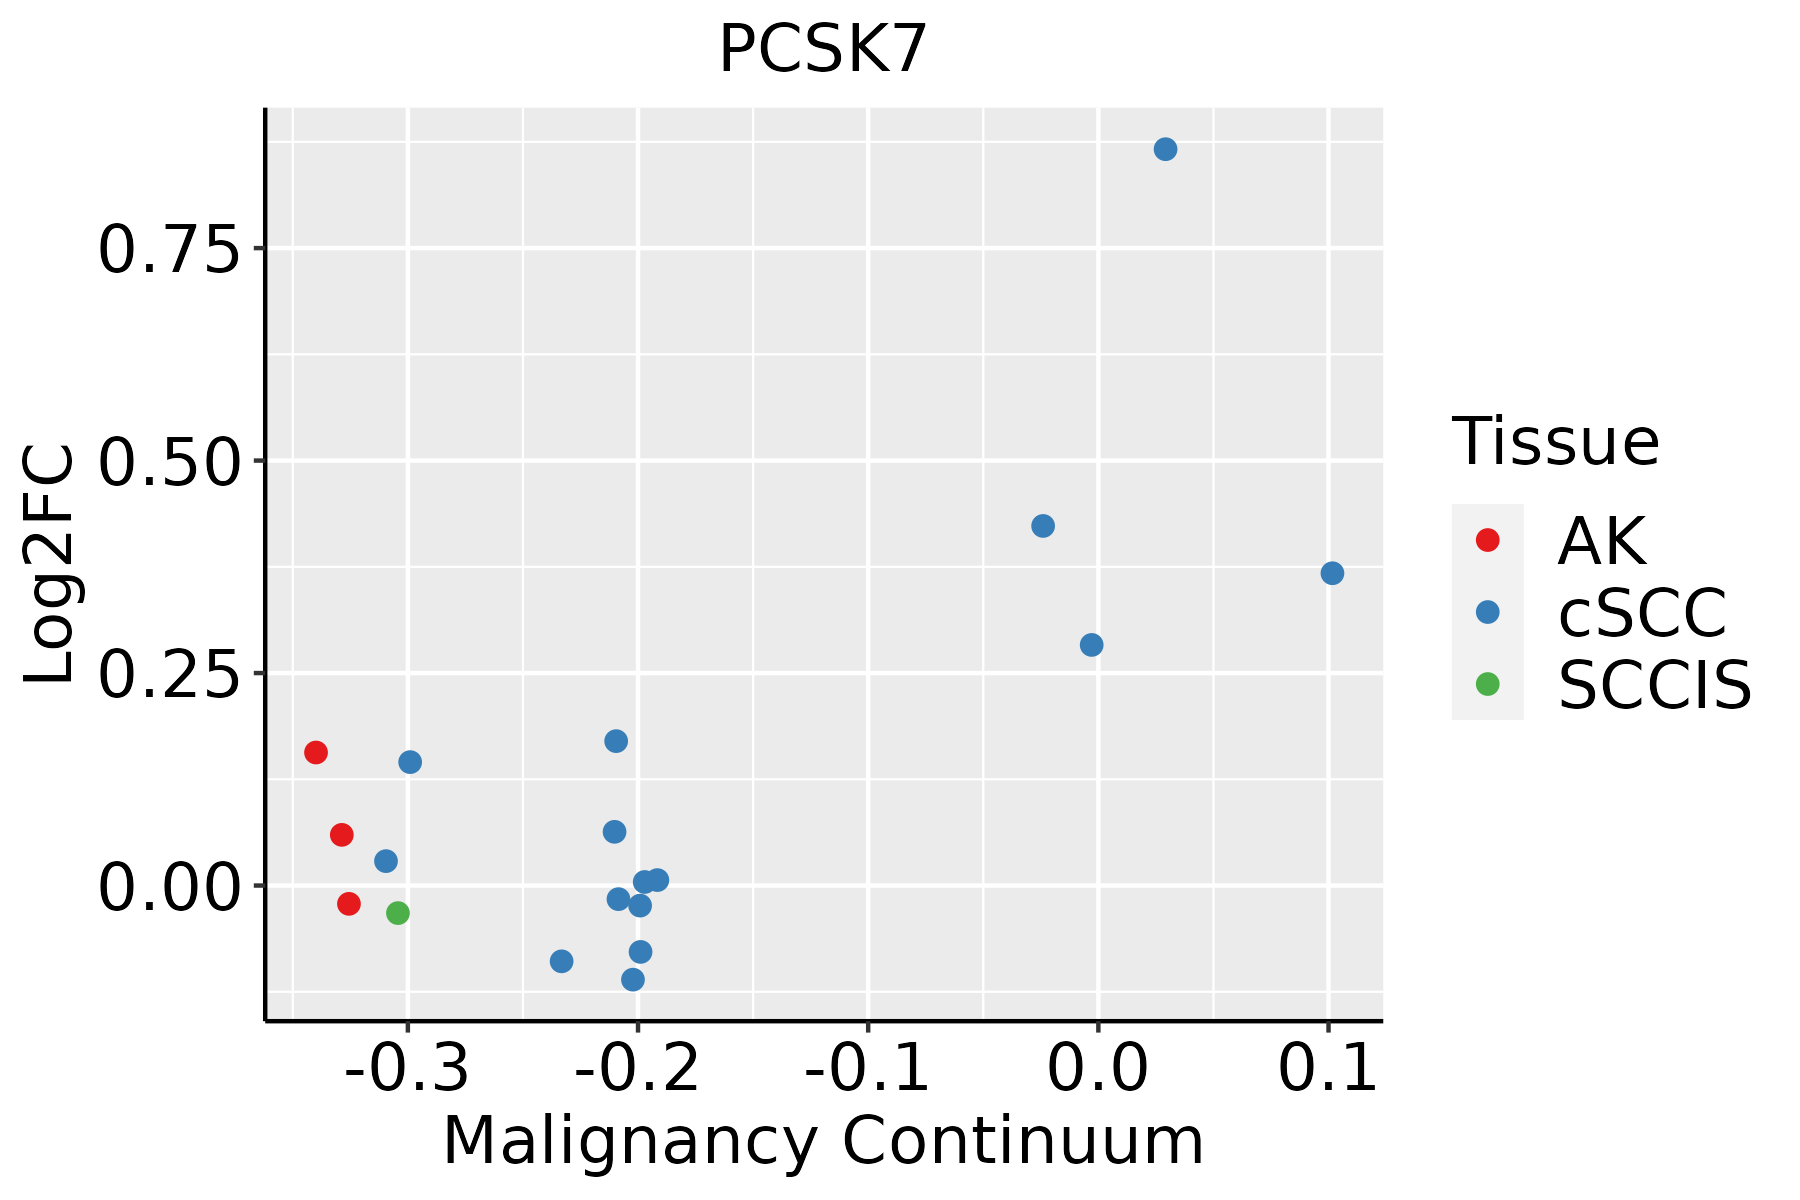 | AK: Actinic keratosis |
| cSCC: Cutaneous squamous cell carcinoma | ||
| SCCIS:squamous cell carcinoma in situ | ||
| Thyroid | 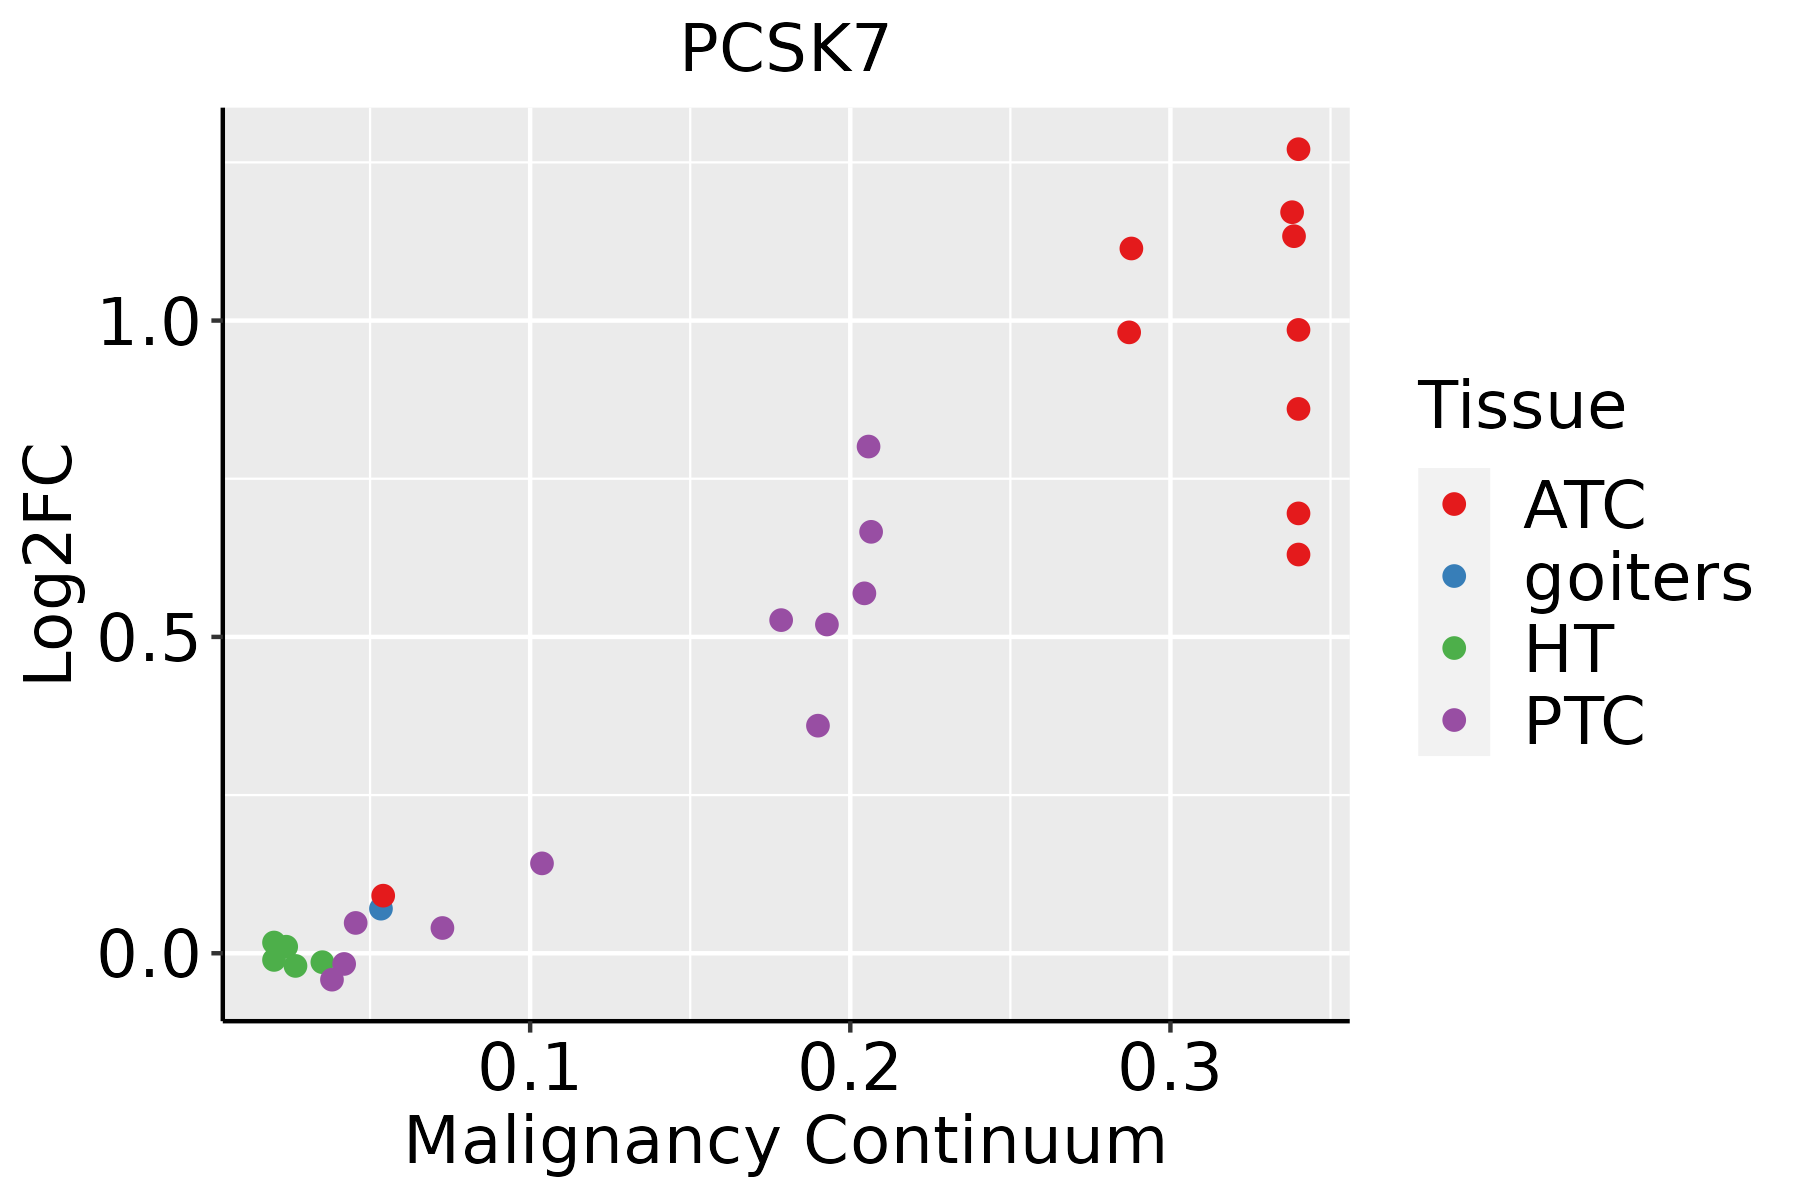 | ATC: Anaplastic thyroid cancer |
| HT: Hashimoto's thyroiditis | ||
| PTC: Papillary thyroid cancer |
| ∗log2FC in expression of this searched gene in stem-like cells from each diseased tissue sample relative to stem-like cells in normal samples in each tissue plotted against the malignancy continuum. Samples are colored based on if they are from different disease stage. |
Top |
Malignant transformation related pathway analysis |
| Find out the enriched GO biological processes and KEGG pathways involved in transition from healthy to precancer to cancer |
| Tissue | Disease Stage | Enriched GO biological Processes |
| Colorectum | AD |  |
| Colorectum | SER |  |
| Colorectum | MSS |  |
| Colorectum | MSI-H |  |
| Colorectum | FAP |  |
| ∗Top 15 enriched GO BP terms are showed in the bar plot of each disease state in each tissue. Each row represents a significant GO biological process which is colored according to the -log10(p.adjust). |
| Page: 1 2 3 4 5 6 7 8 9 |
| GO ID | Tissue | Disease Stage | Description | Gene Ratio | Bg Ratio | pvalue | p.adjust | Count |
| GO:0016486 | Oral cavity | NEOLP | peptide hormone processing | 8/2005 | 24/18723 | 2.59e-03 | 1.63e-02 | 8 |
| GO:0140448 | Oral cavity | NEOLP | signaling receptor ligand precursor processing | 8/2005 | 25/18723 | 3.46e-03 | 2.05e-02 | 8 |
| GO:005160419 | Skin | cSCC | protein maturation | 117/4864 | 294/18723 | 1.27e-07 | 2.93e-06 | 117 |
| GO:00164858 | Skin | cSCC | protein processing | 79/4864 | 225/18723 | 1.43e-03 | 9.02e-03 | 79 |
| GO:0042445 | Stomach | GC | hormone metabolic process | 29/1159 | 218/18723 | 8.22e-05 | 1.75e-03 | 29 |
| GO:00516045 | Stomach | GC | protein maturation | 34/1159 | 294/18723 | 3.35e-04 | 5.33e-03 | 34 |
| GO:005160411 | Stomach | CAG with IM | protein maturation | 31/1050 | 294/18723 | 5.57e-04 | 8.22e-03 | 31 |
| GO:00424451 | Stomach | CAG with IM | hormone metabolic process | 22/1050 | 218/18723 | 5.61e-03 | 4.40e-02 | 22 |
| GO:005160421 | Stomach | CSG | protein maturation | 30/1034 | 294/18723 | 9.05e-04 | 1.20e-02 | 30 |
| GO:005160420 | Thyroid | PTC | protein maturation | 132/5968 | 294/18723 | 1.71e-06 | 2.39e-05 | 132 |
| GO:00164859 | Thyroid | PTC | protein processing | 95/5968 | 225/18723 | 6.60e-04 | 4.15e-03 | 95 |
| GO:0051604110 | Thyroid | ATC | protein maturation | 136/6293 | 294/18723 | 4.00e-06 | 4.42e-05 | 136 |
| GO:001648515 | Thyroid | ATC | protein processing | 100/6293 | 225/18723 | 4.39e-04 | 2.62e-03 | 100 |
| Page: 1 2 |
| Pathway ID | Tissue | Disease Stage | Description | Gene Ratio | Bg Ratio | pvalue | p.adjust | qvalue | Count |
| Page: 1 |
Top |
Cell-cell communication analysis |
| Identification of potential cell-cell interactions between two cell types and their ligand-receptor pairs for different disease states |
| Ligand | Receptor | LRpair | Pathway | Tissue | Disease Stage |
| Page: 1 |
Top |
Single-cell gene regulatory network inference analysis |
| Find out the significant the regulons (TFs) and the target genes of each regulon across cell types for different disease states |
| TF | Cell Type | Tissue | Disease Stage | Target Gene | RSS | Regulon Activity |
| ∗The dot plots of a searched regulon are shown for all cell subpopulations in each disease state of each tissue based on the regulon specific score inferred using pySCENIC and by calculating the average expression. |
| Page: 1 |
Top |
Somatic mutation of malignant transformation related genes |
| Annotation of somatic variants for genes involved in malignant transformation |
| Hugo Symbol | Variant Class | Variant Classification | dbSNP RS | HGVSc | HGVSp | HGVSp Short | SWISSPROT | BIOTYPE | SIFT | PolyPhen | Tumor Sample Barcode | Tissue | Histology | Sex | Age | Stage | Therapy Types | Drugs | Outcome |
| PCSK7 | SNV | Missense_Mutation | rs775499699 | c.1679N>A | p.Arg560His | p.R560H | Q16549 | protein_coding | deleterious(0) | probably_damaging(0.999) | TCGA-AN-A0AK-01 | Breast | breast invasive carcinoma | Female | >=65 | I/II | Unknown | Unknown | SD |
| PCSK7 | SNV | Missense_Mutation | c.1337N>T | p.Arg446Leu | p.R446L | Q16549 | protein_coding | tolerated(0.31) | benign(0.059) | TCGA-C8-A131-01 | Breast | breast invasive carcinoma | Female | >=65 | III/IV | Chemotherapy | 5-fluorouracil | CR | |
| PCSK7 | SNV | Missense_Mutation | c.133N>C | p.Asp45His | p.D45H | Q16549 | protein_coding | tolerated_low_confidence(0.11) | benign(0.037) | TCGA-DG-A2KH-01 | Cervix | cervical & endocervical cancer | Female | <65 | I/II | Unknown | Unknown | SD | |
| PCSK7 | SNV | Missense_Mutation | c.2114N>G | p.His705Arg | p.H705R | Q16549 | protein_coding | tolerated_low_confidence(1) | benign(0) | TCGA-EA-A4BA-01 | Cervix | cervical & endocervical cancer | Female | <65 | I/II | Chemotherapy | carboplatin | CR | |
| PCSK7 | SNV | Missense_Mutation | c.1342N>C | p.Glu448Gln | p.E448Q | Q16549 | protein_coding | deleterious(0.02) | benign(0.045) | TCGA-EK-A2PG-01 | Cervix | cervical & endocervical cancer | Female | >=65 | I/II | Unknown | Unknown | SD | |
| PCSK7 | SNV | Missense_Mutation | c.1058N>T | p.Ala353Val | p.A353V | Q16549 | protein_coding | deleterious(0) | probably_damaging(0.997) | TCGA-FU-A3TX-01 | Cervix | cervical & endocervical cancer | Female | >=65 | I/II | Unknown | Unknown | SD | |
| PCSK7 | SNV | Missense_Mutation | novel | c.283N>G | p.His95Asp | p.H95D | Q16549 | protein_coding | tolerated(0.09) | possibly_damaging(0.649) | TCGA-A6-5659-01 | Colorectum | colon adenocarcinoma | Male | >=65 | I/II | Unknown | Unknown | SD |
| PCSK7 | SNV | Missense_Mutation | rs199777458 | c.692N>A | p.Arg231Gln | p.R231Q | Q16549 | protein_coding | deleterious(0) | probably_damaging(0.938) | TCGA-A6-5665-01 | Colorectum | colon adenocarcinoma | Female | >=65 | I/II | Unknown | Unknown | PD |
| PCSK7 | SNV | Missense_Mutation | c.356N>T | p.Ala119Val | p.A119V | Q16549 | protein_coding | tolerated(0.23) | benign(0.013) | TCGA-AA-3672-01 | Colorectum | colon adenocarcinoma | Female | >=65 | III/IV | Unknown | Unknown | SD | |
| PCSK7 | SNV | Missense_Mutation | c.1535N>C | p.Val512Ala | p.V512A | Q16549 | protein_coding | tolerated(0.06) | possibly_damaging(0.604) | TCGA-AD-6964-01 | Colorectum | colon adenocarcinoma | Male | <65 | III/IV | Chemotherapy | folfox | PD |
| Page: 1 2 3 4 5 6 7 8 9 |
Top |
Related drugs of malignant transformation related genes |
| Identification of chemicals and drugs interact with genes involved in malignant transfromation |
| (DGIdb 4.0) |
| Entrez ID | Symbol | Category | Interaction Types | Drug Claim Name | Drug Name | PMIDs |
| 9159 | PCSK7 | ENZYME, PROTEASE, CLINICALLY ACTIONABLE, DRUGGABLE GENOME | inhibitor | 252166868 | ||
| 9159 | PCSK7 | ENZYME, PROTEASE, CLINICALLY ACTIONABLE, DRUGGABLE GENOME | inhibitor | 252166858 |
| Page: 1 |

Copyright 2023-Present -The University of Texas Health Science Center at Houston |