
|
|||||
|
 | |
| |
| |
| |
| |
| |
|
Gene: NXF1 |
Gene summary for NXF1 |
| Gene information | Species | Human | Gene symbol | NXF1 | Gene ID | 10482 |
| Gene name | nuclear RNA export factor 1 | |
| Gene Alias | MEX67 | |
| Cytomap | 11q12.3 | |
| Gene Type | protein-coding | GO ID | GO:0006403 | UniProtAcc | Q59E96 |
Top |
Malignant transformation analysis |
| Identification of the aberrant gene expression in precancerous and cancerous lesions by comparing the gene expression of stem-like cells in diseased tissues with normal stem cells |
| Entrez ID | Symbol | Replicates | Species | Organ | Tissue | Adj P-value | Log2FC | Malignancy |
| 10482 | NXF1 | HTA11_3410_2000001011 | Human | Colorectum | AD | 3.32e-04 | 1.46e-01 | 0.0155 |
| 10482 | NXF1 | HTA11_2487_2000001011 | Human | Colorectum | SER | 4.19e-08 | 2.87e-01 | -0.1808 |
| 10482 | NXF1 | HTA11_1938_2000001011 | Human | Colorectum | AD | 9.61e-08 | 3.14e-01 | -0.0811 |
| 10482 | NXF1 | HTA11_78_2000001011 | Human | Colorectum | AD | 7.02e-06 | 2.40e-01 | -0.1088 |
| 10482 | NXF1 | HTA11_347_2000001011 | Human | Colorectum | AD | 1.07e-06 | 2.37e-01 | -0.1954 |
| 10482 | NXF1 | HTA11_3361_2000001011 | Human | Colorectum | AD | 1.76e-05 | 2.30e-01 | -0.1207 |
| 10482 | NXF1 | HTA11_83_2000001011 | Human | Colorectum | SER | 1.26e-04 | 2.85e-01 | -0.1526 |
| 10482 | NXF1 | HTA11_696_2000001011 | Human | Colorectum | AD | 7.72e-04 | 2.13e-01 | -0.1464 |
| 10482 | NXF1 | HTA11_866_2000001011 | Human | Colorectum | AD | 7.58e-03 | 1.71e-01 | -0.1001 |
| 10482 | NXF1 | HTA11_1391_2000001011 | Human | Colorectum | AD | 5.99e-12 | 3.62e-01 | -0.059 |
| 10482 | NXF1 | HTA11_866_3004761011 | Human | Colorectum | AD | 2.23e-12 | 3.13e-01 | 0.096 |
| 10482 | NXF1 | HTA11_10711_2000001011 | Human | Colorectum | AD | 2.81e-03 | 1.74e-01 | 0.0338 |
| 10482 | NXF1 | HTA11_7696_3000711011 | Human | Colorectum | AD | 1.10e-07 | 2.75e-01 | 0.0674 |
| 10482 | NXF1 | HTA11_99999970781_79442 | Human | Colorectum | MSS | 3.21e-07 | 2.81e-01 | 0.294 |
| 10482 | NXF1 | HTA11_99999965062_69753 | Human | Colorectum | MSI-H | 2.47e-06 | 8.11e-01 | 0.3487 |
| 10482 | NXF1 | HTA11_99999965104_69814 | Human | Colorectum | MSS | 1.19e-11 | 4.00e-01 | 0.281 |
| 10482 | NXF1 | HTA11_99999971662_82457 | Human | Colorectum | MSS | 5.15e-12 | 3.79e-01 | 0.3859 |
| 10482 | NXF1 | HTA11_99999973899_84307 | Human | Colorectum | MSS | 7.23e-05 | 3.36e-01 | 0.2585 |
| 10482 | NXF1 | HTA11_99999974143_84620 | Human | Colorectum | MSS | 2.06e-02 | 2.33e-01 | 0.3005 |
| 10482 | NXF1 | LZE4T | Human | Esophagus | ESCC | 1.68e-09 | 1.03e-01 | 0.0811 |
| Page: 1 2 3 4 5 6 |
| Tissue | Expression Dynamics | Abbreviation |
| Colorectum (GSE201348) |  | FAP: Familial adenomatous polyposis |
| CRC: Colorectal cancer | ||
| Colorectum (HTA11) |  | AD: Adenomas |
| SER: Sessile serrated lesions | ||
| MSI-H: Microsatellite-high colorectal cancer | ||
| MSS: Microsatellite stable colorectal cancer | ||
| Esophagus | 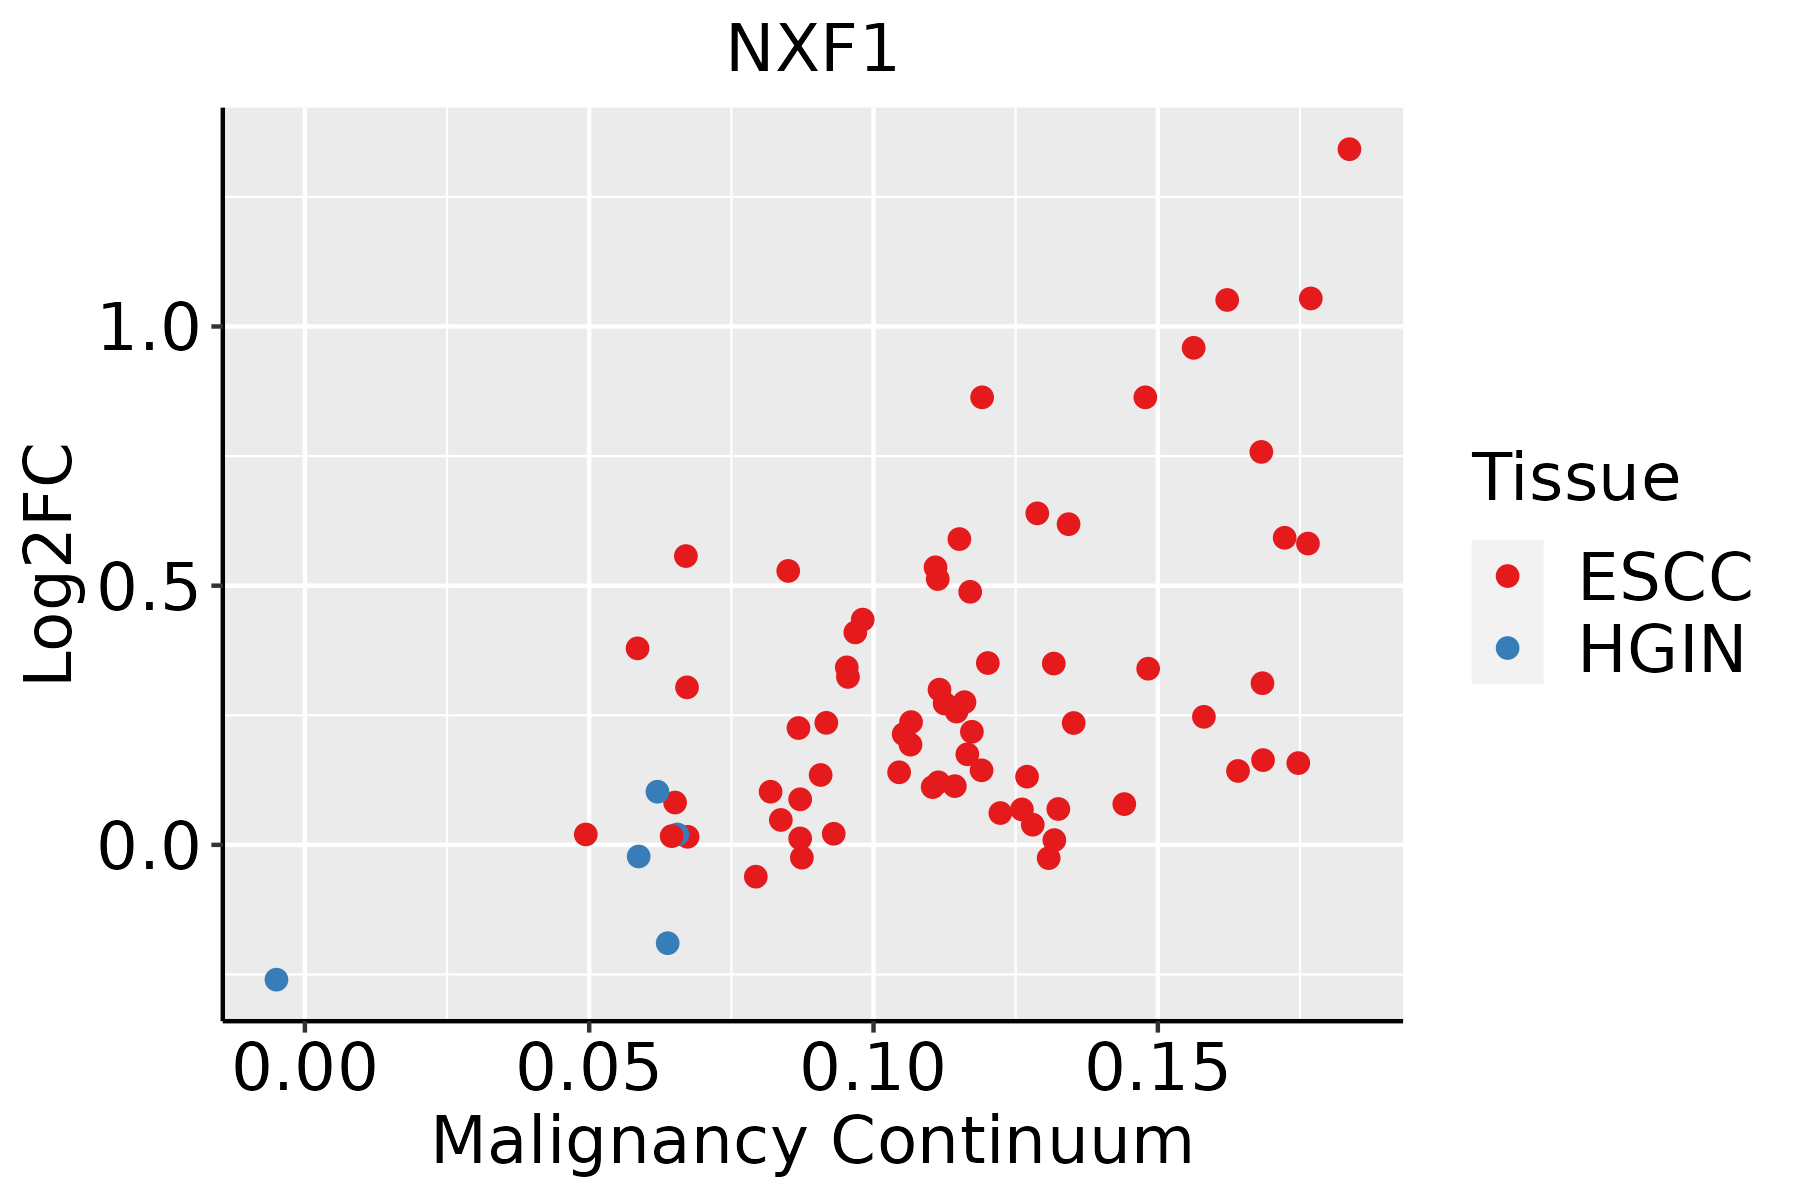 | ESCC: Esophageal squamous cell carcinoma |
| HGIN: High-grade intraepithelial neoplasias | ||
| LGIN: Low-grade intraepithelial neoplasias | ||
| Liver | 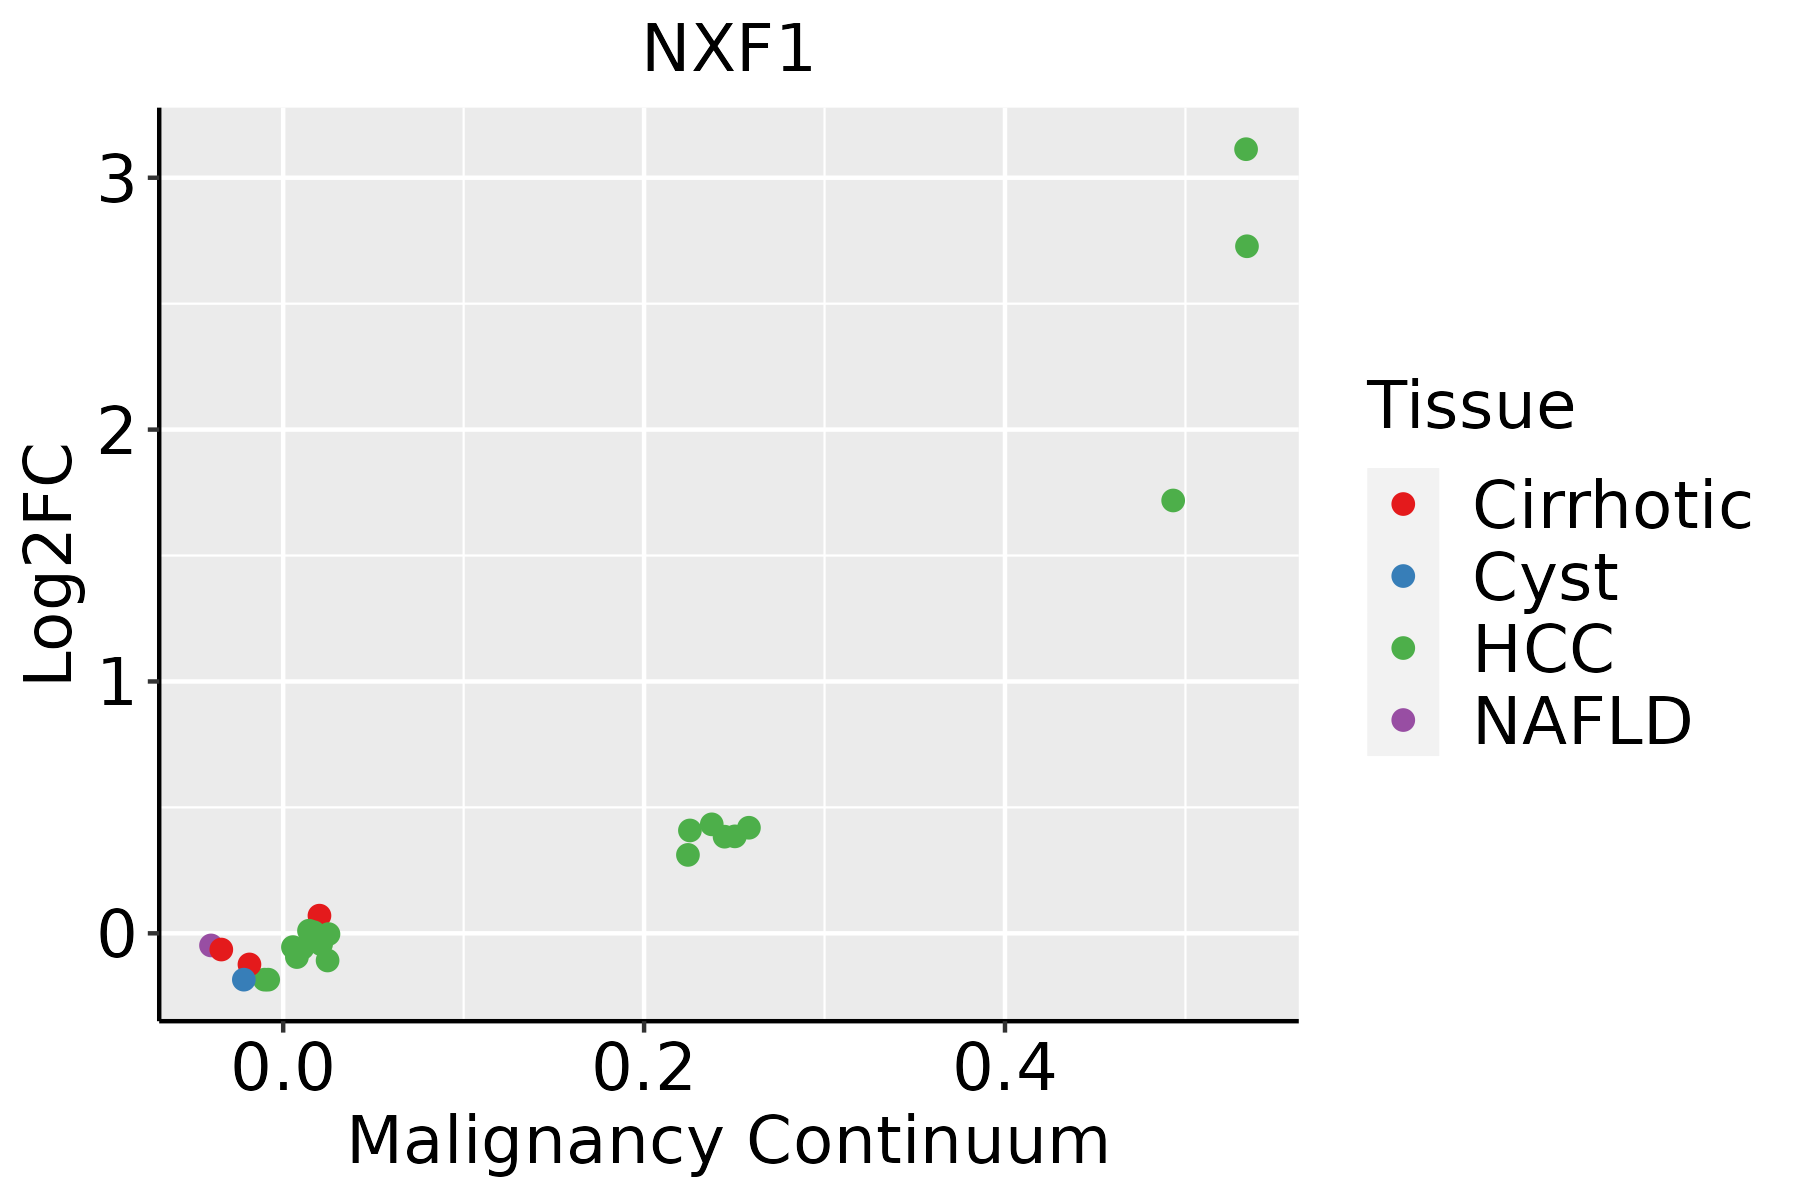 | HCC: Hepatocellular carcinoma |
| NAFLD: Non-alcoholic fatty liver disease | ||
| Oral Cavity |  | EOLP: Erosive Oral lichen planus |
| LP: leukoplakia | ||
| NEOLP: Non-erosive oral lichen planus | ||
| OSCC: Oral squamous cell carcinoma | ||
| Skin |  | AK: Actinic keratosis |
| cSCC: Cutaneous squamous cell carcinoma | ||
| SCCIS:squamous cell carcinoma in situ |
| ∗log2FC in expression of this searched gene in stem-like cells from each diseased tissue sample relative to stem-like cells in normal samples in each tissue plotted against the malignancy continuum. Samples are colored based on if they are from different disease stage. |
Top |
Malignant transformation related pathway analysis |
| Find out the enriched GO biological processes and KEGG pathways involved in transition from healthy to precancer to cancer |
| Tissue | Disease Stage | Enriched GO biological Processes |
| Colorectum | AD |  |
| Colorectum | SER |  |
| Colorectum | MSS |  |
| Colorectum | MSI-H |  |
| Colorectum | FAP |  |
| ∗Top 15 enriched GO BP terms are showed in the bar plot of each disease state in each tissue. Each row represents a significant GO biological process which is colored according to the -log10(p.adjust). |
| Page: 1 2 3 4 5 6 7 8 9 |
| GO ID | Tissue | Disease Stage | Description | Gene Ratio | Bg Ratio | pvalue | p.adjust | Count |
| GO:00159312 | Colorectum | MSS | nucleobase-containing compound transport | 70/3467 | 222/18723 | 1.92e-06 | 6.01e-05 | 70 |
| GO:00512362 | Colorectum | MSS | establishment of RNA localization | 55/3467 | 166/18723 | 4.54e-06 | 1.27e-04 | 55 |
| GO:00506572 | Colorectum | MSS | nucleic acid transport | 54/3467 | 163/18723 | 5.54e-06 | 1.49e-04 | 54 |
| GO:00506582 | Colorectum | MSS | RNA transport | 54/3467 | 163/18723 | 5.54e-06 | 1.49e-04 | 54 |
| GO:00511682 | Colorectum | MSS | nuclear export | 51/3467 | 154/18723 | 1.01e-05 | 2.43e-04 | 51 |
| GO:00510281 | Colorectum | MSS | mRNA transport | 40/3467 | 130/18723 | 4.94e-04 | 5.75e-03 | 40 |
| GO:0006405 | Colorectum | MSS | RNA export from nucleus | 27/3467 | 84/18723 | 1.89e-03 | 1.66e-02 | 27 |
| GO:0006406 | Colorectum | MSS | mRNA export from nucleus | 19/3467 | 59/18723 | 8.19e-03 | 4.97e-02 | 19 |
| GO:0071427 | Colorectum | MSS | mRNA-containing ribonucleoprotein complex export from nucleus | 19/3467 | 59/18723 | 8.19e-03 | 4.97e-02 | 19 |
| GO:00069133 | Colorectum | MSI-H | nucleocytoplasmic transport | 45/1319 | 301/18723 | 1.31e-06 | 8.75e-05 | 45 |
| GO:00511693 | Colorectum | MSI-H | nuclear transport | 45/1319 | 301/18723 | 1.31e-06 | 8.75e-05 | 45 |
| GO:00064033 | Colorectum | MSI-H | RNA localization | 31/1319 | 201/18723 | 3.04e-05 | 1.20e-03 | 31 |
| GO:00511683 | Colorectum | MSI-H | nuclear export | 24/1319 | 154/18723 | 1.95e-04 | 5.30e-03 | 24 |
| GO:00159313 | Colorectum | MSI-H | nucleobase-containing compound transport | 30/1319 | 222/18723 | 4.45e-04 | 9.50e-03 | 30 |
| GO:00506573 | Colorectum | MSI-H | nucleic acid transport | 23/1319 | 163/18723 | 1.09e-03 | 1.84e-02 | 23 |
| GO:00506583 | Colorectum | MSI-H | RNA transport | 23/1319 | 163/18723 | 1.09e-03 | 1.84e-02 | 23 |
| GO:00512363 | Colorectum | MSI-H | establishment of RNA localization | 23/1319 | 166/18723 | 1.40e-03 | 2.19e-02 | 23 |
| GO:0006913110 | Esophagus | ESCC | nucleocytoplasmic transport | 230/8552 | 301/18723 | 6.04e-28 | 2.02e-25 | 230 |
| GO:0051169110 | Esophagus | ESCC | nuclear transport | 230/8552 | 301/18723 | 6.04e-28 | 2.02e-25 | 230 |
| GO:0006403110 | Esophagus | ESCC | RNA localization | 166/8552 | 201/18723 | 1.95e-27 | 6.18e-25 | 166 |
| Page: 1 2 3 4 5 6 7 8 |
| Pathway ID | Tissue | Disease Stage | Description | Gene Ratio | Bg Ratio | pvalue | p.adjust | qvalue | Count |
| hsa05014 | Colorectum | AD | Amyotrophic lateral sclerosis | 164/2092 | 364/8465 | 4.28e-18 | 1.27e-16 | 8.09e-17 | 164 |
| hsa03015 | Colorectum | AD | mRNA surveillance pathway | 35/2092 | 97/8465 | 7.95e-03 | 3.13e-02 | 2.00e-02 | 35 |
| hsa050141 | Colorectum | AD | Amyotrophic lateral sclerosis | 164/2092 | 364/8465 | 4.28e-18 | 1.27e-16 | 8.09e-17 | 164 |
| hsa030151 | Colorectum | AD | mRNA surveillance pathway | 35/2092 | 97/8465 | 7.95e-03 | 3.13e-02 | 2.00e-02 | 35 |
| hsa050142 | Colorectum | SER | Amyotrophic lateral sclerosis | 138/1580 | 364/8465 | 9.89e-19 | 2.99e-17 | 2.17e-17 | 138 |
| hsa050143 | Colorectum | SER | Amyotrophic lateral sclerosis | 138/1580 | 364/8465 | 9.89e-19 | 2.99e-17 | 2.17e-17 | 138 |
| hsa050144 | Colorectum | MSS | Amyotrophic lateral sclerosis | 156/1875 | 364/8465 | 1.43e-19 | 4.62e-18 | 2.83e-18 | 156 |
| hsa050145 | Colorectum | MSS | Amyotrophic lateral sclerosis | 156/1875 | 364/8465 | 1.43e-19 | 4.62e-18 | 2.83e-18 | 156 |
| hsa050146 | Colorectum | MSI-H | Amyotrophic lateral sclerosis | 95/797 | 364/8465 | 2.31e-21 | 1.50e-19 | 1.26e-19 | 95 |
| hsa050147 | Colorectum | MSI-H | Amyotrophic lateral sclerosis | 95/797 | 364/8465 | 2.31e-21 | 1.50e-19 | 1.26e-19 | 95 |
| hsa05014210 | Esophagus | ESCC | Amyotrophic lateral sclerosis | 266/4205 | 364/8465 | 1.31e-20 | 2.20e-18 | 1.13e-18 | 266 |
| hsa0301321 | Esophagus | ESCC | Nucleocytoplasmic transport | 89/4205 | 108/8465 | 1.20e-12 | 2.37e-11 | 1.21e-11 | 89 |
| hsa0516425 | Esophagus | ESCC | Influenza A | 122/4205 | 171/8465 | 5.01e-09 | 4.79e-08 | 2.45e-08 | 122 |
| hsa0301524 | Esophagus | ESCC | mRNA surveillance pathway | 72/4205 | 97/8465 | 6.12e-07 | 4.10e-06 | 2.10e-06 | 72 |
| hsa0501438 | Esophagus | ESCC | Amyotrophic lateral sclerosis | 266/4205 | 364/8465 | 1.31e-20 | 2.20e-18 | 1.13e-18 | 266 |
| hsa0301331 | Esophagus | ESCC | Nucleocytoplasmic transport | 89/4205 | 108/8465 | 1.20e-12 | 2.37e-11 | 1.21e-11 | 89 |
| hsa0516435 | Esophagus | ESCC | Influenza A | 122/4205 | 171/8465 | 5.01e-09 | 4.79e-08 | 2.45e-08 | 122 |
| hsa0301534 | Esophagus | ESCC | mRNA surveillance pathway | 72/4205 | 97/8465 | 6.12e-07 | 4.10e-06 | 2.10e-06 | 72 |
| hsa0501414 | Liver | Cirrhotic | Amyotrophic lateral sclerosis | 187/2530 | 364/8465 | 1.56e-18 | 6.50e-17 | 4.01e-17 | 187 |
| hsa030154 | Liver | Cirrhotic | mRNA surveillance pathway | 46/2530 | 97/8465 | 1.92e-04 | 1.30e-03 | 8.03e-04 | 46 |
| Page: 1 2 3 |
Top |
Cell-cell communication analysis |
| Identification of potential cell-cell interactions between two cell types and their ligand-receptor pairs for different disease states |
| Ligand | Receptor | LRpair | Pathway | Tissue | Disease Stage |
| Page: 1 |
Top |
Single-cell gene regulatory network inference analysis |
| Find out the significant the regulons (TFs) and the target genes of each regulon across cell types for different disease states |
| TF | Cell Type | Tissue | Disease Stage | Target Gene | RSS | Regulon Activity |
| ∗The dot plots of a searched regulon are shown for all cell subpopulations in each disease state of each tissue based on the regulon specific score inferred using pySCENIC and by calculating the average expression. |
| Page: 1 |
Top |
Somatic mutation of malignant transformation related genes |
| Annotation of somatic variants for genes involved in malignant transformation |
| Hugo Symbol | Variant Class | Variant Classification | dbSNP RS | HGVSc | HGVSp | HGVSp Short | SWISSPROT | BIOTYPE | SIFT | PolyPhen | Tumor Sample Barcode | Tissue | Histology | Sex | Age | Stage | Therapy Types | Drugs | Outcome |
| NXF1 | SNV | Missense_Mutation | rs376614748 | c.245N>A | p.Arg82Gln | p.R82Q | Q9UBU9 | protein_coding | deleterious(0.04) | benign(0.161) | TCGA-3C-AALK-01 | Breast | breast invasive carcinoma | Female | <65 | I/II | Chemotherapy | docetaxel | SD |
| NXF1 | SNV | Missense_Mutation | c.1152G>C | p.Lys384Asn | p.K384N | Q9UBU9 | protein_coding | deleterious(0) | probably_damaging(0.932) | TCGA-A1-A0SI-01 | Breast | breast invasive carcinoma | Female | <65 | I/II | Unknown | Unknown | SD | |
| NXF1 | SNV | Missense_Mutation | rs775505140 | c.1571A>G | p.Asn524Ser | p.N524S | Q9UBU9 | protein_coding | tolerated(0.38) | benign(0.003) | TCGA-A8-A08P-01 | Breast | breast invasive carcinoma | Female | >=65 | III/IV | Chemotherapy | 5-fluorouracil | CR |
| NXF1 | SNV | Missense_Mutation | rs369101376 | c.1112C>T | p.Pro371Leu | p.P371L | Q9UBU9 | protein_coding | tolerated(0.11) | probably_damaging(0.993) | TCGA-A8-A09C-01 | Breast | breast invasive carcinoma | Female | >=65 | I/II | Unknown | Unknown | SD |
| NXF1 | SNV | Missense_Mutation | c.668C>G | p.Ser223Cys | p.S223C | Q9UBU9 | protein_coding | deleterious(0.03) | benign(0.306) | TCGA-AC-A23H-01 | Breast | breast invasive carcinoma | Female | >=65 | I/II | Unknown | Unknown | PD | |
| NXF1 | SNV | Missense_Mutation | novel | c.986N>C | p.Asp329Ala | p.D329A | Q9UBU9 | protein_coding | tolerated(0.14) | benign(0.007) | TCGA-AO-A128-01 | Breast | breast invasive carcinoma | Female | <65 | I/II | Chemotherapy | doxorubicin | SD |
| NXF1 | SNV | Missense_Mutation | c.172N>A | p.Asp58Asn | p.D58N | Q9UBU9 | protein_coding | tolerated(0.75) | probably_damaging(0.914) | TCGA-BH-A0HF-01 | Breast | breast invasive carcinoma | Female | >=65 | I/II | Hormone Therapy | arimidex | SD | |
| NXF1 | SNV | Missense_Mutation | novel | c.1768N>G | p.Gln590Glu | p.Q590E | Q9UBU9 | protein_coding | tolerated(0.49) | benign(0.02) | TCGA-C5-A1BI-01 | Cervix | cervical & endocervical cancer | Female | <65 | III/IV | Chemotherapy | cisplatin | SD |
| NXF1 | SNV | Missense_Mutation | novel | c.1756N>G | p.Gln586Glu | p.Q586E | Q9UBU9 | protein_coding | deleterious(0.03) | benign(0.179) | TCGA-C5-A8XH-01 | Cervix | cervical & endocervical cancer | Female | <65 | I/II | Unknown | Unknown | SD |
| NXF1 | SNV | Missense_Mutation | c.250N>A | p.Asp84Asn | p.D84N | Q9UBU9 | protein_coding | tolerated(0.49) | benign(0.014) | TCGA-EK-A3GK-01 | Cervix | cervical & endocervical cancer | Female | <65 | I/II | Unknown | Unknown | SD |
| Page: 1 2 3 4 5 6 7 8 9 |
Top |
Related drugs of malignant transformation related genes |
| Identification of chemicals and drugs interact with genes involved in malignant transfromation |
| (DGIdb 4.0) |
| Entrez ID | Symbol | Category | Interaction Types | Drug Claim Name | Drug Name | PMIDs |
| Page: 1 |

Copyright 2023-Present -The University of Texas Health Science Center at Houston |