
|
|||||
|
 | |
| |
| |
| |
| |
| |
|
Gene: NUP54 |
Gene summary for NUP54 |
| Gene information | Species | Human | Gene symbol | NUP54 | Gene ID | 53371 |
| Gene name | nucleoporin 54 | |
| Gene Alias | NUP54 | |
| Cytomap | 4q21.1 | |
| Gene Type | protein-coding | GO ID | GO:0006403 | UniProtAcc | Q7Z3B4 |
Top |
Malignant transformation analysis |
| Identification of the aberrant gene expression in precancerous and cancerous lesions by comparing the gene expression of stem-like cells in diseased tissues with normal stem cells |
| Entrez ID | Symbol | Replicates | Species | Organ | Tissue | Adj P-value | Log2FC | Malignancy |
| 53371 | NUP54 | LZE4T | Human | Esophagus | ESCC | 4.43e-11 | 2.04e-01 | 0.0811 |
| 53371 | NUP54 | LZE7T | Human | Esophagus | ESCC | 8.94e-08 | 4.66e-01 | 0.0667 |
| 53371 | NUP54 | LZE8T | Human | Esophagus | ESCC | 5.20e-05 | 2.07e-01 | 0.067 |
| 53371 | NUP54 | LZE20T | Human | Esophagus | ESCC | 2.82e-04 | 2.42e-02 | 0.0662 |
| 53371 | NUP54 | LZE24T | Human | Esophagus | ESCC | 3.09e-15 | 2.81e-01 | 0.0596 |
| 53371 | NUP54 | LZE21T | Human | Esophagus | ESCC | 1.18e-07 | 2.47e-01 | 0.0655 |
| 53371 | NUP54 | LZE6T | Human | Esophagus | ESCC | 1.85e-07 | 2.70e-01 | 0.0845 |
| 53371 | NUP54 | P1T-E | Human | Esophagus | ESCC | 5.23e-07 | 2.42e-01 | 0.0875 |
| 53371 | NUP54 | P2T-E | Human | Esophagus | ESCC | 2.25e-37 | 7.67e-01 | 0.1177 |
| 53371 | NUP54 | P4T-E | Human | Esophagus | ESCC | 4.44e-30 | 6.46e-01 | 0.1323 |
| 53371 | NUP54 | P5T-E | Human | Esophagus | ESCC | 5.42e-08 | 1.68e-01 | 0.1327 |
| 53371 | NUP54 | P8T-E | Human | Esophagus | ESCC | 1.33e-15 | 2.63e-01 | 0.0889 |
| 53371 | NUP54 | P9T-E | Human | Esophagus | ESCC | 4.47e-13 | 1.74e-01 | 0.1131 |
| 53371 | NUP54 | P10T-E | Human | Esophagus | ESCC | 2.75e-20 | 3.83e-01 | 0.116 |
| 53371 | NUP54 | P11T-E | Human | Esophagus | ESCC | 1.15e-19 | 5.76e-01 | 0.1426 |
| 53371 | NUP54 | P12T-E | Human | Esophagus | ESCC | 3.51e-31 | 4.11e-01 | 0.1122 |
| 53371 | NUP54 | P15T-E | Human | Esophagus | ESCC | 1.55e-27 | 4.51e-01 | 0.1149 |
| 53371 | NUP54 | P16T-E | Human | Esophagus | ESCC | 1.68e-35 | 6.41e-01 | 0.1153 |
| 53371 | NUP54 | P17T-E | Human | Esophagus | ESCC | 7.65e-07 | 2.89e-01 | 0.1278 |
| 53371 | NUP54 | P19T-E | Human | Esophagus | ESCC | 1.38e-06 | 4.83e-01 | 0.1662 |
| Page: 1 2 3 4 5 6 |
| Tissue | Expression Dynamics | Abbreviation |
| Esophagus | 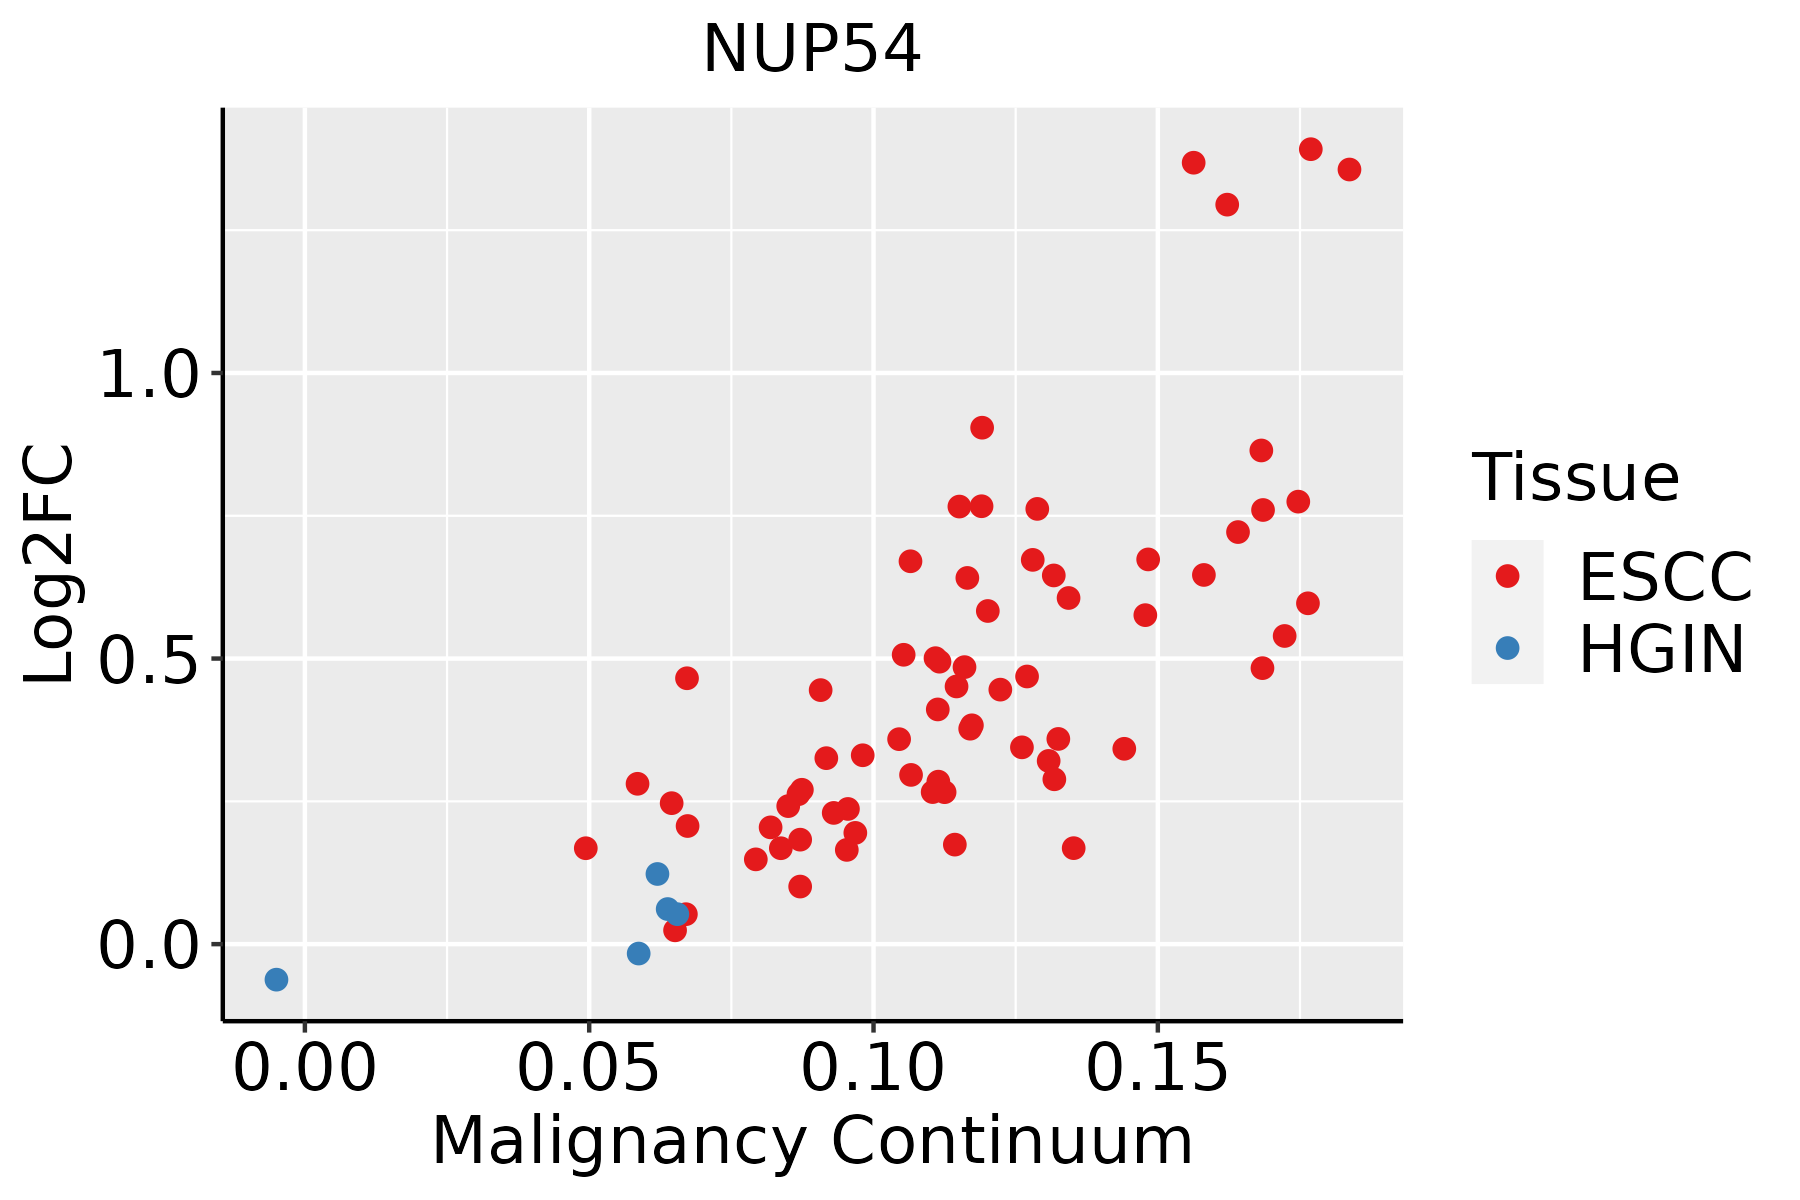 | ESCC: Esophageal squamous cell carcinoma |
| HGIN: High-grade intraepithelial neoplasias | ||
| LGIN: Low-grade intraepithelial neoplasias | ||
| Liver | 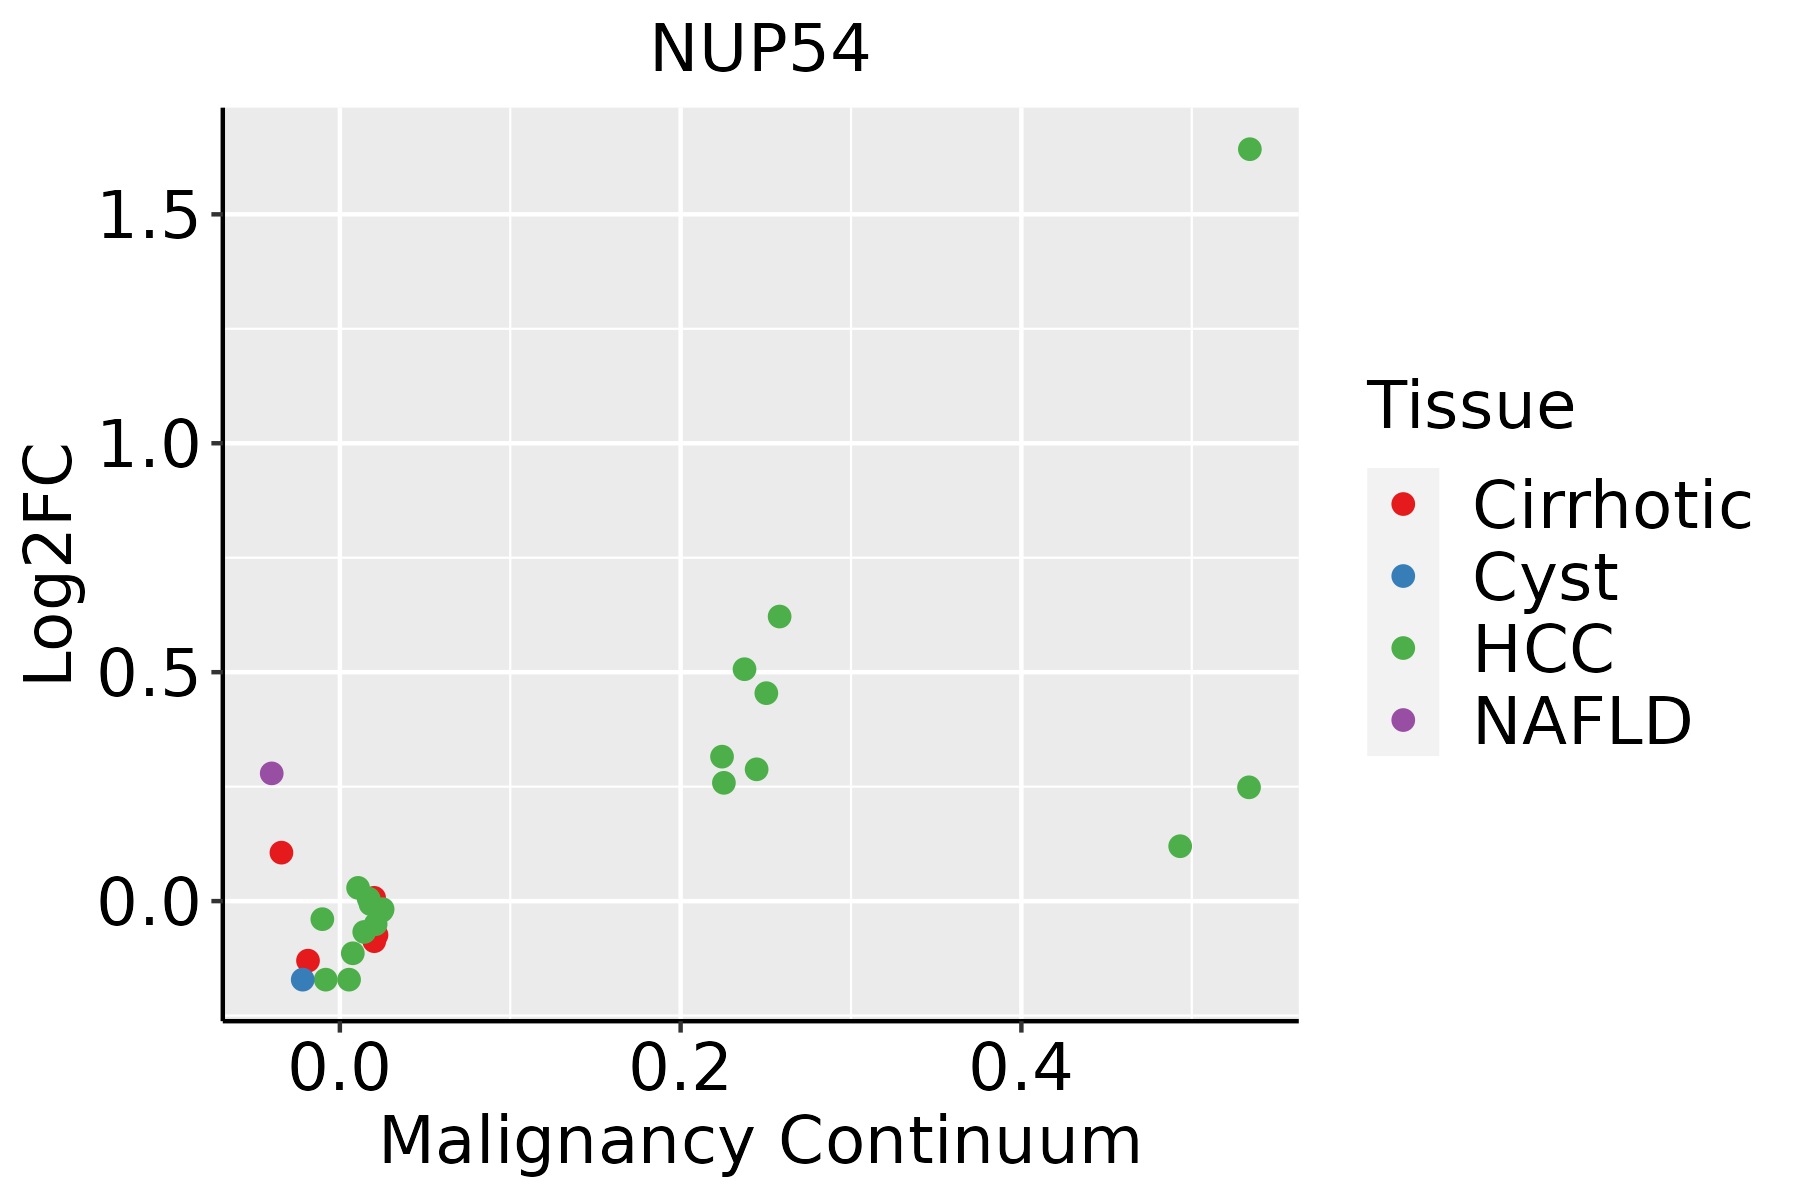 | HCC: Hepatocellular carcinoma |
| NAFLD: Non-alcoholic fatty liver disease | ||
| Lung | 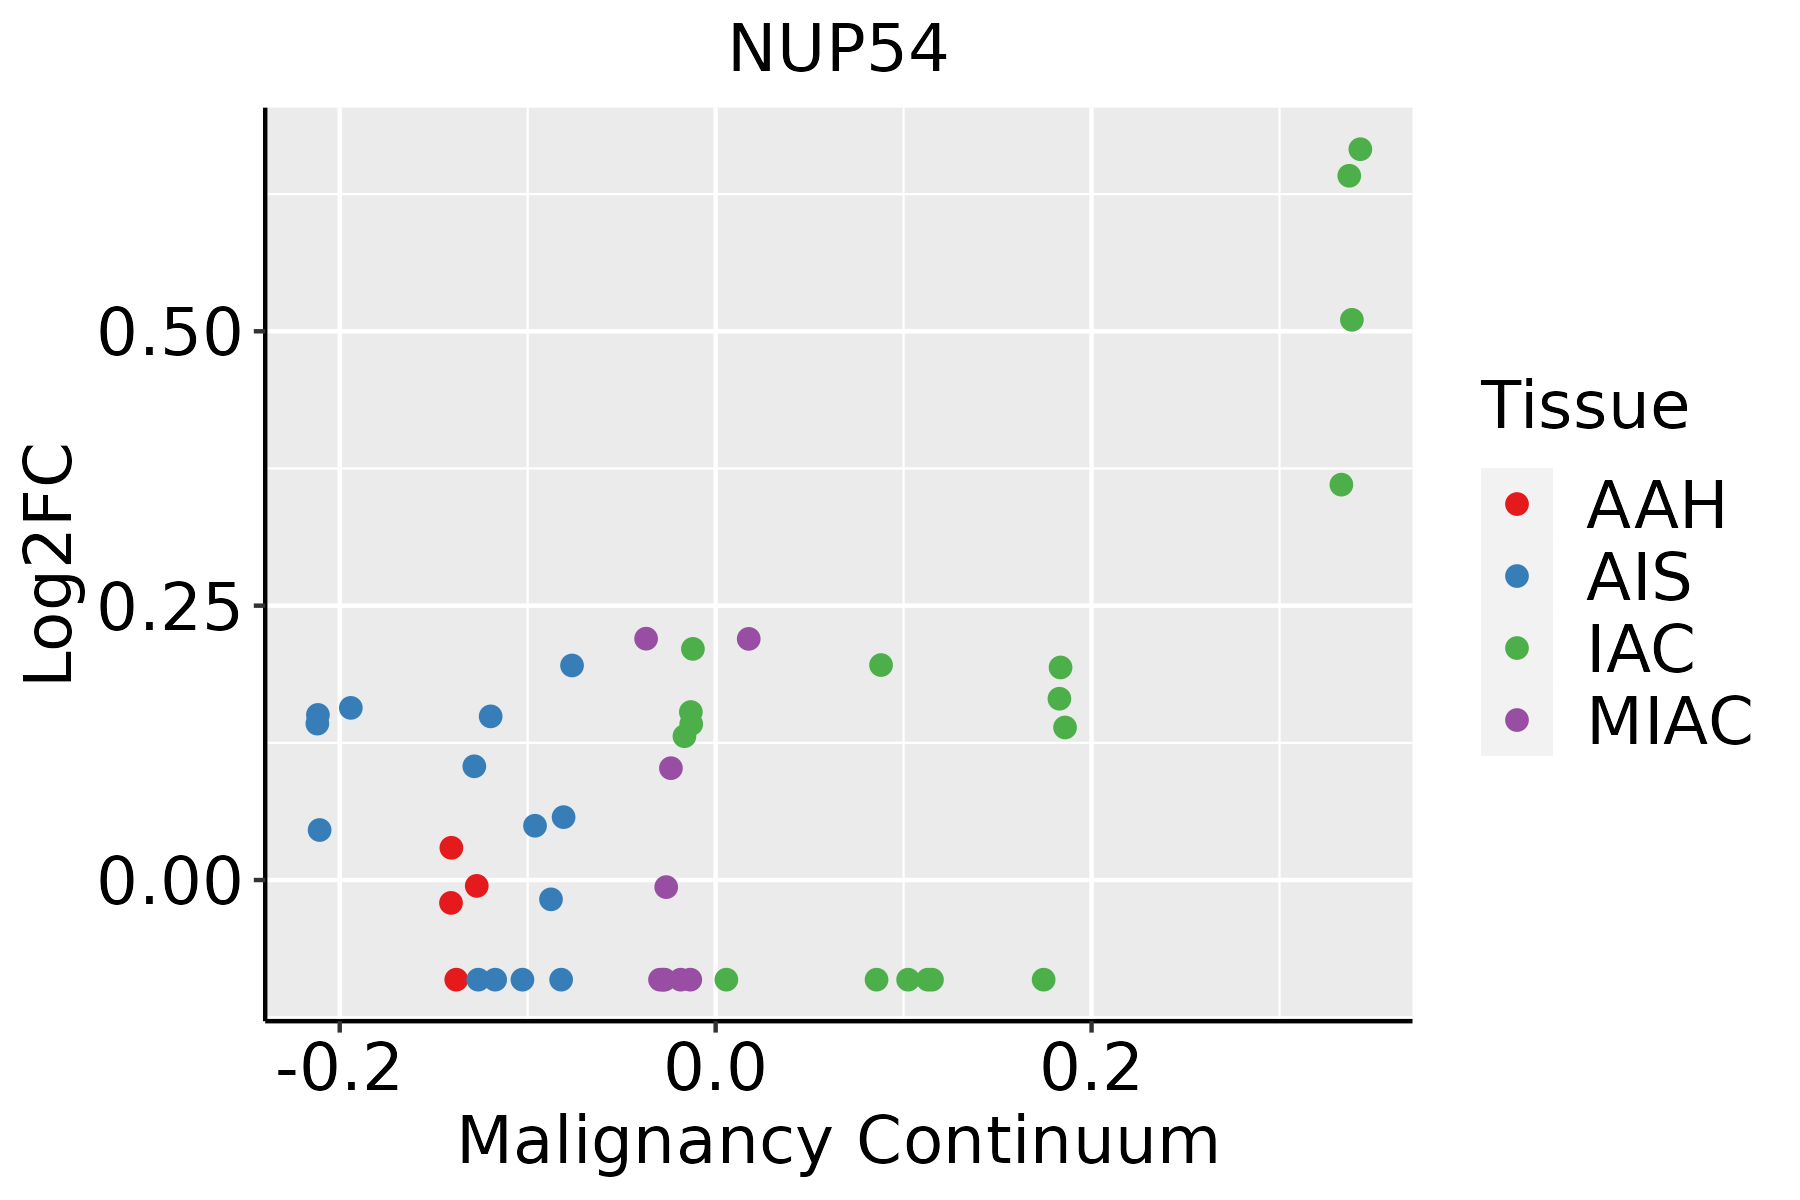 | AAH: Atypical adenomatous hyperplasia |
| AIS: Adenocarcinoma in situ | ||
| IAC: Invasive lung adenocarcinoma | ||
| MIA: Minimally invasive adenocarcinoma | ||
| Oral Cavity | 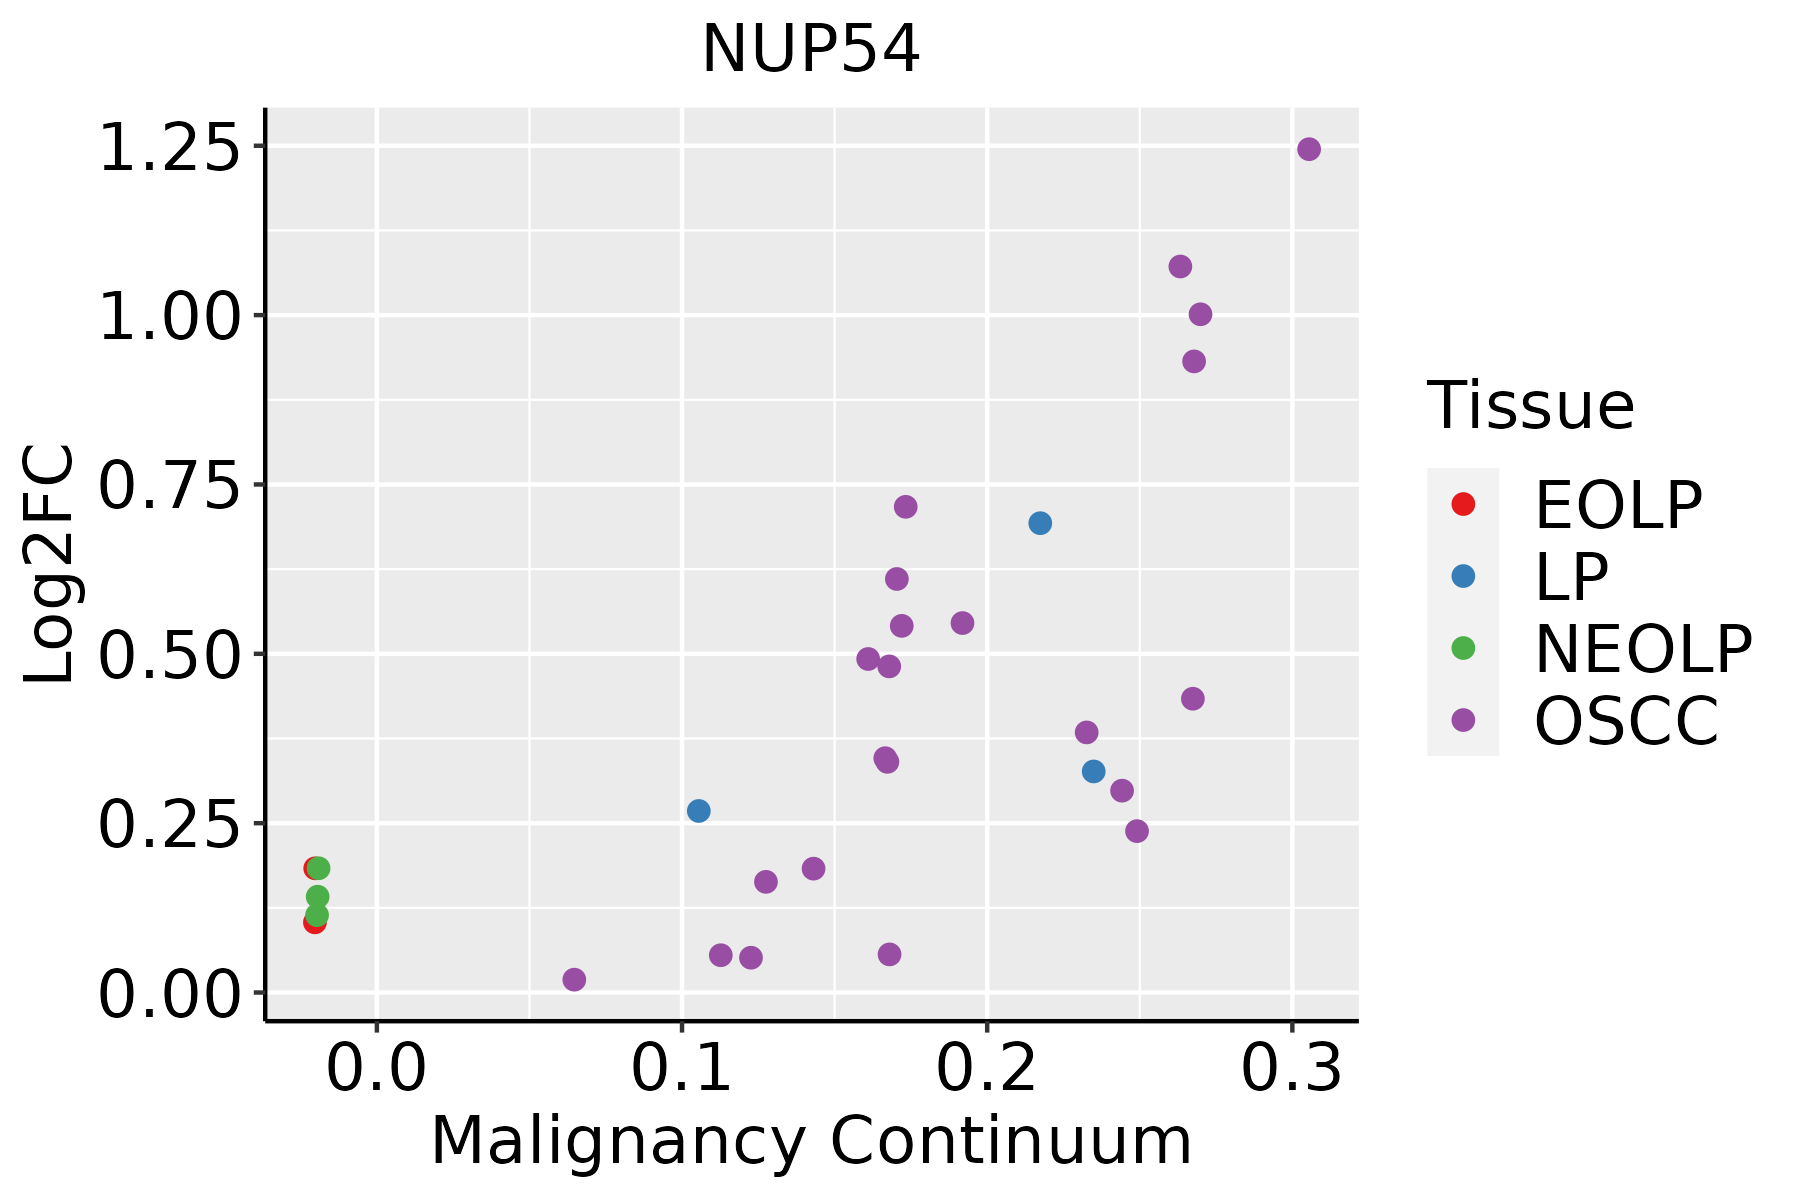 | EOLP: Erosive Oral lichen planus |
| LP: leukoplakia | ||
| NEOLP: Non-erosive oral lichen planus | ||
| OSCC: Oral squamous cell carcinoma | ||
| Skin | 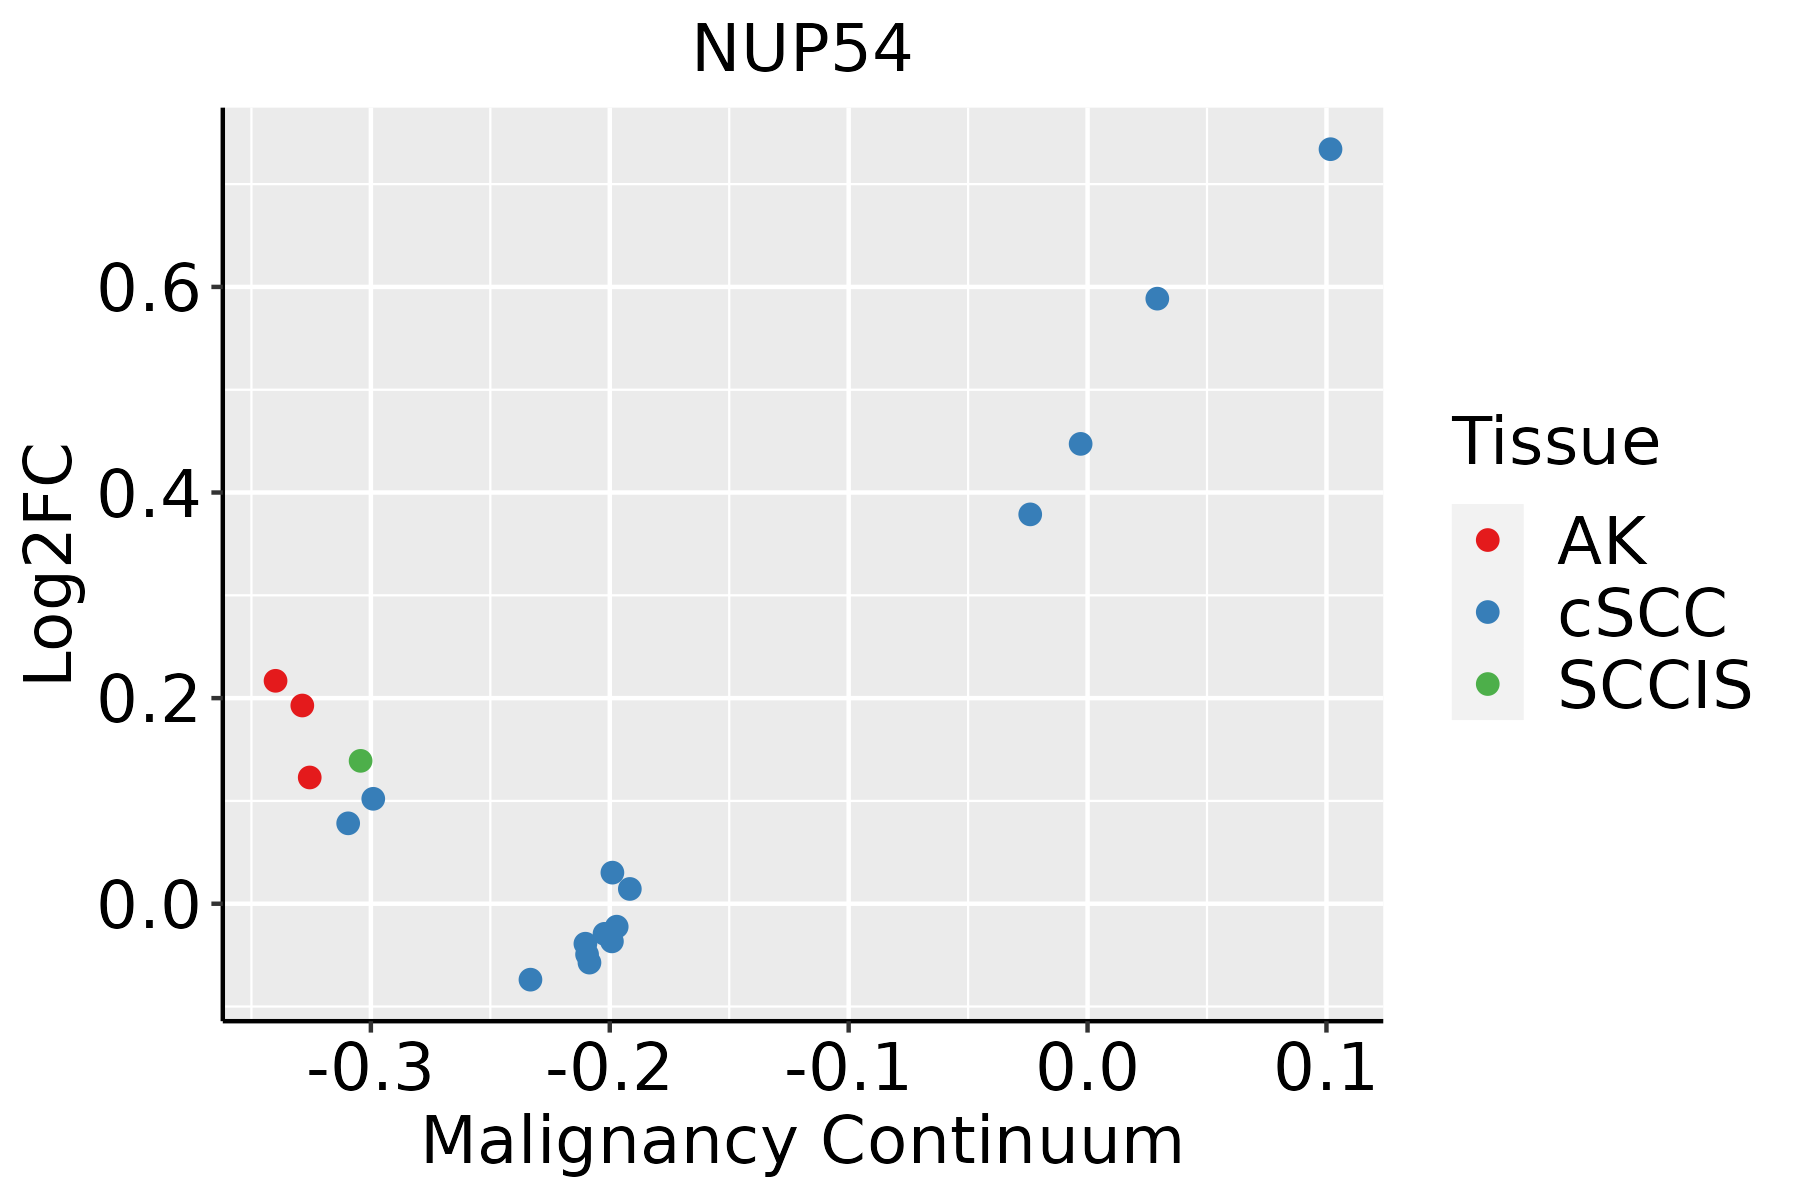 | AK: Actinic keratosis |
| cSCC: Cutaneous squamous cell carcinoma | ||
| SCCIS:squamous cell carcinoma in situ | ||
| Thyroid |  | ATC: Anaplastic thyroid cancer |
| HT: Hashimoto's thyroiditis | ||
| PTC: Papillary thyroid cancer |
| ∗log2FC in expression of this searched gene in stem-like cells from each diseased tissue sample relative to stem-like cells in normal samples in each tissue plotted against the malignancy continuum. Samples are colored based on if they are from different disease stage. |
Top |
Malignant transformation related pathway analysis |
| Find out the enriched GO biological processes and KEGG pathways involved in transition from healthy to precancer to cancer |
| Tissue | Disease Stage | Enriched GO biological Processes |
| Colorectum | AD |  |
| Colorectum | SER |  |
| Colorectum | MSS |  |
| Colorectum | MSI-H |  |
| Colorectum | FAP |  |
| ∗Top 15 enriched GO BP terms are showed in the bar plot of each disease state in each tissue. Each row represents a significant GO biological process which is colored according to the -log10(p.adjust). |
| Page: 1 2 3 4 5 6 7 8 9 |
| GO ID | Tissue | Disease Stage | Description | Gene Ratio | Bg Ratio | pvalue | p.adjust | Count |
| GO:004230614 | Esophagus | ESCC | regulation of protein import into nucleus | 46/8552 | 60/18723 | 9.55e-07 | 1.21e-05 | 46 |
| GO:00069994 | Esophagus | ESCC | nuclear pore organization | 14/8552 | 14/18723 | 1.71e-05 | 1.52e-04 | 14 |
| GO:00069137 | Liver | NAFLD | nucleocytoplasmic transport | 51/1882 | 301/18723 | 1.39e-04 | 2.62e-03 | 51 |
| GO:00511697 | Liver | NAFLD | nuclear transport | 51/1882 | 301/18723 | 1.39e-04 | 2.62e-03 | 51 |
| GO:00725947 | Liver | NAFLD | establishment of protein localization to organelle | 62/1882 | 422/18723 | 1.48e-03 | 1.64e-02 | 62 |
| GO:00468227 | Liver | NAFLD | regulation of nucleocytoplasmic transport | 21/1882 | 106/18723 | 1.81e-03 | 1.86e-02 | 21 |
| GO:00345046 | Liver | NAFLD | protein localization to nucleus | 45/1882 | 290/18723 | 2.16e-03 | 2.10e-02 | 45 |
| GO:00331576 | Liver | NAFLD | regulation of intracellular protein transport | 37/1882 | 229/18723 | 2.55e-03 | 2.36e-02 | 37 |
| GO:00512366 | Liver | NAFLD | establishment of RNA localization | 28/1882 | 166/18723 | 4.35e-03 | 3.57e-02 | 28 |
| GO:00323866 | Liver | NAFLD | regulation of intracellular transport | 49/1882 | 337/18723 | 5.34e-03 | 4.11e-02 | 49 |
| GO:00064037 | Liver | NAFLD | RNA localization | 32/1882 | 201/18723 | 5.96e-03 | 4.48e-02 | 32 |
| GO:007259412 | Liver | Cirrhotic | establishment of protein localization to organelle | 189/4634 | 422/18723 | 1.01e-19 | 2.45e-17 | 189 |
| GO:00066057 | Liver | Cirrhotic | protein targeting | 148/4634 | 314/18723 | 3.86e-18 | 6.20e-16 | 148 |
| GO:003238611 | Liver | Cirrhotic | regulation of intracellular transport | 147/4634 | 337/18723 | 1.84e-14 | 1.72e-12 | 147 |
| GO:003315711 | Liver | Cirrhotic | regulation of intracellular protein transport | 108/4634 | 229/18723 | 1.23e-13 | 1.04e-11 | 108 |
| GO:000640312 | Liver | Cirrhotic | RNA localization | 94/4634 | 201/18723 | 8.57e-12 | 5.66e-10 | 94 |
| GO:000691312 | Liver | Cirrhotic | nucleocytoplasmic transport | 118/4634 | 301/18723 | 1.71e-08 | 6.27e-07 | 118 |
| GO:005116912 | Liver | Cirrhotic | nuclear transport | 118/4634 | 301/18723 | 1.71e-08 | 6.27e-07 | 118 |
| GO:003450411 | Liver | Cirrhotic | protein localization to nucleus | 113/4634 | 290/18723 | 5.00e-08 | 1.58e-06 | 113 |
| GO:004682211 | Liver | Cirrhotic | regulation of nucleocytoplasmic transport | 51/4634 | 106/18723 | 1.54e-07 | 4.12e-06 | 51 |
| Page: 1 2 3 4 5 6 7 8 9 10 11 |
| Pathway ID | Tissue | Disease Stage | Description | Gene Ratio | Bg Ratio | pvalue | p.adjust | qvalue | Count |
| hsa05014210 | Esophagus | ESCC | Amyotrophic lateral sclerosis | 266/4205 | 364/8465 | 1.31e-20 | 2.20e-18 | 1.13e-18 | 266 |
| hsa0301321 | Esophagus | ESCC | Nucleocytoplasmic transport | 89/4205 | 108/8465 | 1.20e-12 | 2.37e-11 | 1.21e-11 | 89 |
| hsa0501438 | Esophagus | ESCC | Amyotrophic lateral sclerosis | 266/4205 | 364/8465 | 1.31e-20 | 2.20e-18 | 1.13e-18 | 266 |
| hsa0301331 | Esophagus | ESCC | Nucleocytoplasmic transport | 89/4205 | 108/8465 | 1.20e-12 | 2.37e-11 | 1.21e-11 | 89 |
| hsa0501414 | Liver | Cirrhotic | Amyotrophic lateral sclerosis | 187/2530 | 364/8465 | 1.56e-18 | 6.50e-17 | 4.01e-17 | 187 |
| hsa0501415 | Liver | Cirrhotic | Amyotrophic lateral sclerosis | 187/2530 | 364/8465 | 1.56e-18 | 6.50e-17 | 4.01e-17 | 187 |
| hsa0501422 | Liver | HCC | Amyotrophic lateral sclerosis | 252/4020 | 364/8465 | 8.85e-18 | 7.41e-16 | 4.12e-16 | 252 |
| hsa03013 | Liver | HCC | Nucleocytoplasmic transport | 81/4020 | 108/8465 | 4.28e-09 | 6.83e-08 | 3.80e-08 | 81 |
| hsa0501432 | Liver | HCC | Amyotrophic lateral sclerosis | 252/4020 | 364/8465 | 8.85e-18 | 7.41e-16 | 4.12e-16 | 252 |
| hsa030131 | Liver | HCC | Nucleocytoplasmic transport | 81/4020 | 108/8465 | 4.28e-09 | 6.83e-08 | 3.80e-08 | 81 |
| hsa0501428 | Oral cavity | OSCC | Amyotrophic lateral sclerosis | 246/3704 | 364/8465 | 6.65e-21 | 1.11e-18 | 5.67e-19 | 246 |
| hsa030136 | Oral cavity | OSCC | Nucleocytoplasmic transport | 82/3704 | 108/8465 | 7.93e-12 | 1.33e-10 | 6.77e-11 | 82 |
| hsa05014112 | Oral cavity | OSCC | Amyotrophic lateral sclerosis | 246/3704 | 364/8465 | 6.65e-21 | 1.11e-18 | 5.67e-19 | 246 |
| hsa0301311 | Oral cavity | OSCC | Nucleocytoplasmic transport | 82/3704 | 108/8465 | 7.93e-12 | 1.33e-10 | 6.77e-11 | 82 |
| hsa0501445 | Oral cavity | EOLP | Amyotrophic lateral sclerosis | 93/1218 | 364/8465 | 7.07e-09 | 1.14e-07 | 6.74e-08 | 93 |
| hsa030134 | Oral cavity | EOLP | Nucleocytoplasmic transport | 34/1218 | 108/8465 | 4.24e-06 | 2.91e-05 | 1.72e-05 | 34 |
| hsa0501455 | Oral cavity | EOLP | Amyotrophic lateral sclerosis | 93/1218 | 364/8465 | 7.07e-09 | 1.14e-07 | 6.74e-08 | 93 |
| hsa030135 | Oral cavity | EOLP | Nucleocytoplasmic transport | 34/1218 | 108/8465 | 4.24e-06 | 2.91e-05 | 1.72e-05 | 34 |
| hsa0501462 | Oral cavity | NEOLP | Amyotrophic lateral sclerosis | 95/1112 | 364/8465 | 8.76e-12 | 3.98e-10 | 2.50e-10 | 95 |
| hsa0501472 | Oral cavity | NEOLP | Amyotrophic lateral sclerosis | 95/1112 | 364/8465 | 8.76e-12 | 3.98e-10 | 2.50e-10 | 95 |
| Page: 1 |
Top |
Cell-cell communication analysis |
| Identification of potential cell-cell interactions between two cell types and their ligand-receptor pairs for different disease states |
| Ligand | Receptor | LRpair | Pathway | Tissue | Disease Stage |
| Page: 1 |
Top |
Single-cell gene regulatory network inference analysis |
| Find out the significant the regulons (TFs) and the target genes of each regulon across cell types for different disease states |
| TF | Cell Type | Tissue | Disease Stage | Target Gene | RSS | Regulon Activity |
| ∗The dot plots of a searched regulon are shown for all cell subpopulations in each disease state of each tissue based on the regulon specific score inferred using pySCENIC and by calculating the average expression. |
| Page: 1 |
Top |
Somatic mutation of malignant transformation related genes |
| Annotation of somatic variants for genes involved in malignant transformation |
| Hugo Symbol | Variant Class | Variant Classification | dbSNP RS | HGVSc | HGVSp | HGVSp Short | SWISSPROT | BIOTYPE | SIFT | PolyPhen | Tumor Sample Barcode | Tissue | Histology | Sex | Age | Stage | Therapy Types | Drugs | Outcome |
| NUP54 | SNV | Missense_Mutation | c.1453C>G | p.Leu485Val | p.L485V | Q7Z3B4 | protein_coding | tolerated(0.06) | benign(0.006) | TCGA-A2-A0EQ-01 | Breast | breast invasive carcinoma | Female | <65 | I/II | Chemotherapy | adriamycin | SD | |
| NUP54 | SNV | Missense_Mutation | novel | c.1392N>T | p.Lys464Asn | p.K464N | Q7Z3B4 | protein_coding | deleterious(0) | possibly_damaging(0.567) | TCGA-AC-A5EH-01 | Breast | breast invasive carcinoma | Female | >=65 | I/II | Unknown | Unknown | SD |
| NUP54 | SNV | Missense_Mutation | rs781147108 | c.739C>T | p.Arg247Cys | p.R247C | Q7Z3B4 | protein_coding | deleterious(0.05) | benign(0.033) | TCGA-BH-A18G-01 | Breast | breast invasive carcinoma | Female | >=65 | I/II | Unknown | Unknown | SD |
| NUP54 | SNV | Missense_Mutation | c.562G>A | p.Asp188Asn | p.D188N | Q7Z3B4 | protein_coding | deleterious(0) | probably_damaging(0.984) | TCGA-A6-6141-01 | Colorectum | colon adenocarcinoma | Male | <65 | I/II | Chemotherapy | 5-fu | SD | |
| NUP54 | SNV | Missense_Mutation | c.515G>A | p.Arg172Gln | p.R172Q | Q7Z3B4 | protein_coding | deleterious(0.01) | probably_damaging(0.965) | TCGA-AA-3510-01 | Colorectum | colon adenocarcinoma | Male | >=65 | I/II | Unknown | Unknown | SD | |
| NUP54 | SNV | Missense_Mutation | novel | c.1342N>G | p.Arg448Gly | p.R448G | Q7Z3B4 | protein_coding | deleterious(0.02) | benign(0.106) | TCGA-AA-3950-01 | Colorectum | colon adenocarcinoma | Female | >=65 | I/II | Unknown | Unknown | SD |
| NUP54 | SNV | Missense_Mutation | c.562N>A | p.Asp188Asn | p.D188N | Q7Z3B4 | protein_coding | deleterious(0) | probably_damaging(0.984) | TCGA-AA-A010-01 | Colorectum | colon adenocarcinoma | Female | <65 | I/II | Chemotherapy | folinic | CR | |
| NUP54 | SNV | Missense_Mutation | novel | c.1152N>A | p.His384Gln | p.H384Q | Q7Z3B4 | protein_coding | deleterious(0) | possibly_damaging(0.521) | TCGA-CK-4951-01 | Colorectum | colon adenocarcinoma | Female | >=65 | I/II | Unknown | Unknown | PD |
| NUP54 | SNV | Missense_Mutation | c.530G>T | p.Gly177Val | p.G177V | Q7Z3B4 | protein_coding | deleterious(0) | probably_damaging(0.997) | TCGA-CM-4748-01 | Colorectum | colon adenocarcinoma | Male | <65 | III/IV | Chemotherapy | fluorouracil | SD | |
| NUP54 | SNV | Missense_Mutation | rs749764062 | c.362N>T | p.Ala121Val | p.A121V | Q7Z3B4 | protein_coding | tolerated(0.37) | benign(0.086) | TCGA-DM-A1D4-01 | Colorectum | colon adenocarcinoma | Male | >=65 | I/II | Unknown | Unknown | PD |
| Page: 1 2 3 4 |
Top |
Related drugs of malignant transformation related genes |
| Identification of chemicals and drugs interact with genes involved in malignant transfromation |
| (DGIdb 4.0) |
| Entrez ID | Symbol | Category | Interaction Types | Drug Claim Name | Drug Name | PMIDs |
| Page: 1 |

Copyright 2023-Present -The University of Texas Health Science Center at Houston |