
|
|||||
|
 | |
| |
| |
| |
| |
| |
|
Gene: NUP133 |
Gene summary for NUP133 |
| Gene information | Species | Human | Gene symbol | NUP133 | Gene ID | 55746 |
| Gene name | nucleoporin 133 | |
| Gene Alias | GAMOS8 | |
| Cytomap | 1q42.13 | |
| Gene Type | protein-coding | GO ID | GO:0000972 | UniProtAcc | Q8WUM0 |
Top |
Malignant transformation analysis |
| Identification of the aberrant gene expression in precancerous and cancerous lesions by comparing the gene expression of stem-like cells in diseased tissues with normal stem cells |
| Entrez ID | Symbol | Replicates | Species | Organ | Tissue | Adj P-value | Log2FC | Malignancy |
| 55746 | NUP133 | LZE2T | Human | Esophagus | ESCC | 2.76e-03 | 4.11e-01 | 0.082 |
| 55746 | NUP133 | LZE4T | Human | Esophagus | ESCC | 1.83e-13 | 2.63e-01 | 0.0811 |
| 55746 | NUP133 | LZE7T | Human | Esophagus | ESCC | 4.60e-11 | 4.95e-01 | 0.0667 |
| 55746 | NUP133 | LZE8T | Human | Esophagus | ESCC | 7.62e-03 | 7.81e-02 | 0.067 |
| 55746 | NUP133 | LZE22T | Human | Esophagus | ESCC | 2.23e-02 | 2.25e-01 | 0.068 |
| 55746 | NUP133 | LZE24T | Human | Esophagus | ESCC | 2.32e-10 | 2.17e-01 | 0.0596 |
| 55746 | NUP133 | LZE21T | Human | Esophagus | ESCC | 5.36e-03 | 2.45e-01 | 0.0655 |
| 55746 | NUP133 | P1T-E | Human | Esophagus | ESCC | 6.03e-10 | 5.30e-01 | 0.0875 |
| 55746 | NUP133 | P2T-E | Human | Esophagus | ESCC | 9.09e-25 | 4.75e-01 | 0.1177 |
| 55746 | NUP133 | P4T-E | Human | Esophagus | ESCC | 4.96e-09 | 1.42e-01 | 0.1323 |
| 55746 | NUP133 | P5T-E | Human | Esophagus | ESCC | 8.46e-11 | 2.99e-01 | 0.1327 |
| 55746 | NUP133 | P8T-E | Human | Esophagus | ESCC | 2.75e-08 | 2.16e-01 | 0.0889 |
| 55746 | NUP133 | P9T-E | Human | Esophagus | ESCC | 1.44e-04 | 1.54e-01 | 0.1131 |
| 55746 | NUP133 | P10T-E | Human | Esophagus | ESCC | 4.33e-25 | 4.40e-01 | 0.116 |
| 55746 | NUP133 | P11T-E | Human | Esophagus | ESCC | 5.20e-07 | 3.08e-01 | 0.1426 |
| 55746 | NUP133 | P12T-E | Human | Esophagus | ESCC | 4.72e-10 | 2.71e-01 | 0.1122 |
| 55746 | NUP133 | P15T-E | Human | Esophagus | ESCC | 3.35e-15 | 3.65e-01 | 0.1149 |
| 55746 | NUP133 | P16T-E | Human | Esophagus | ESCC | 2.61e-32 | 5.03e-01 | 0.1153 |
| 55746 | NUP133 | P17T-E | Human | Esophagus | ESCC | 2.12e-08 | 2.74e-01 | 0.1278 |
| 55746 | NUP133 | P19T-E | Human | Esophagus | ESCC | 6.03e-03 | 2.59e-01 | 0.1662 |
| Page: 1 2 3 4 |
| Tissue | Expression Dynamics | Abbreviation |
| Esophagus | 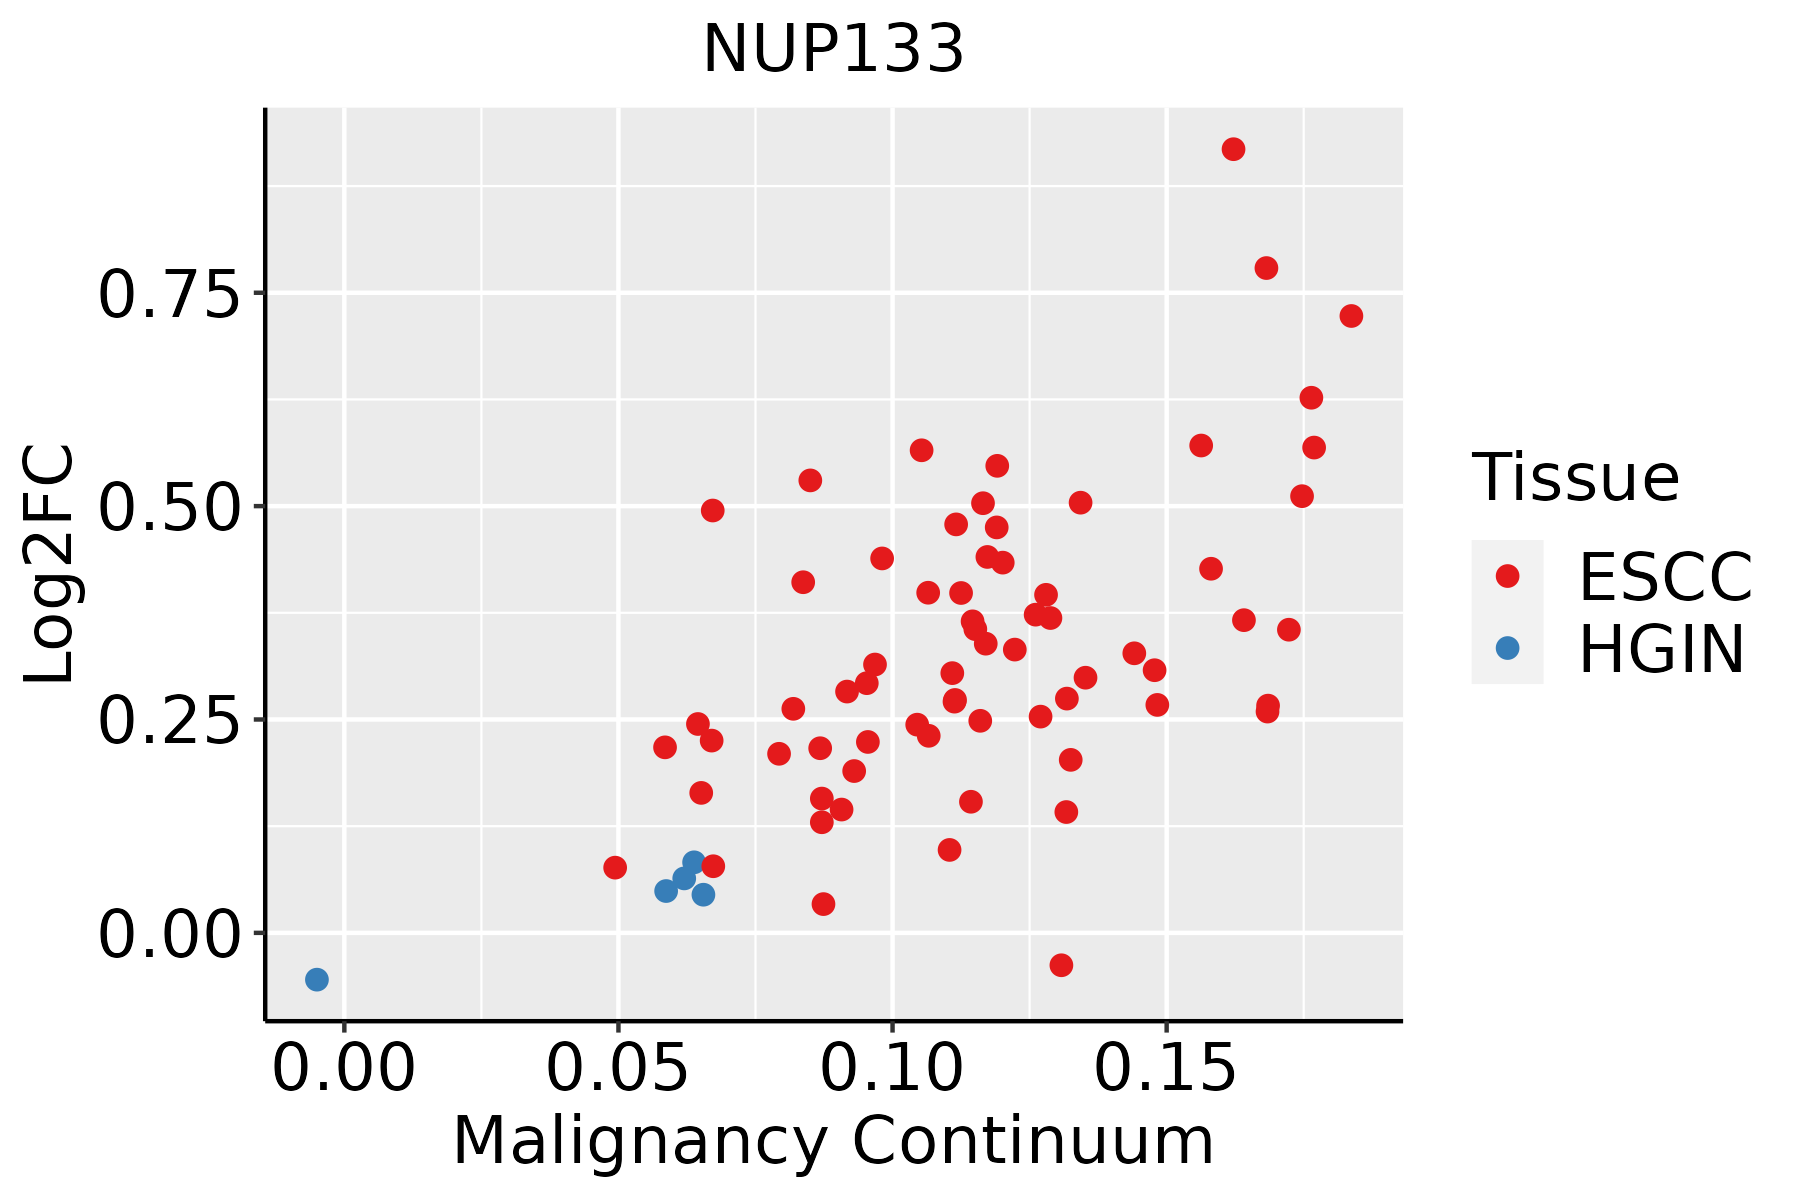 | ESCC: Esophageal squamous cell carcinoma |
| HGIN: High-grade intraepithelial neoplasias | ||
| LGIN: Low-grade intraepithelial neoplasias | ||
| Liver | 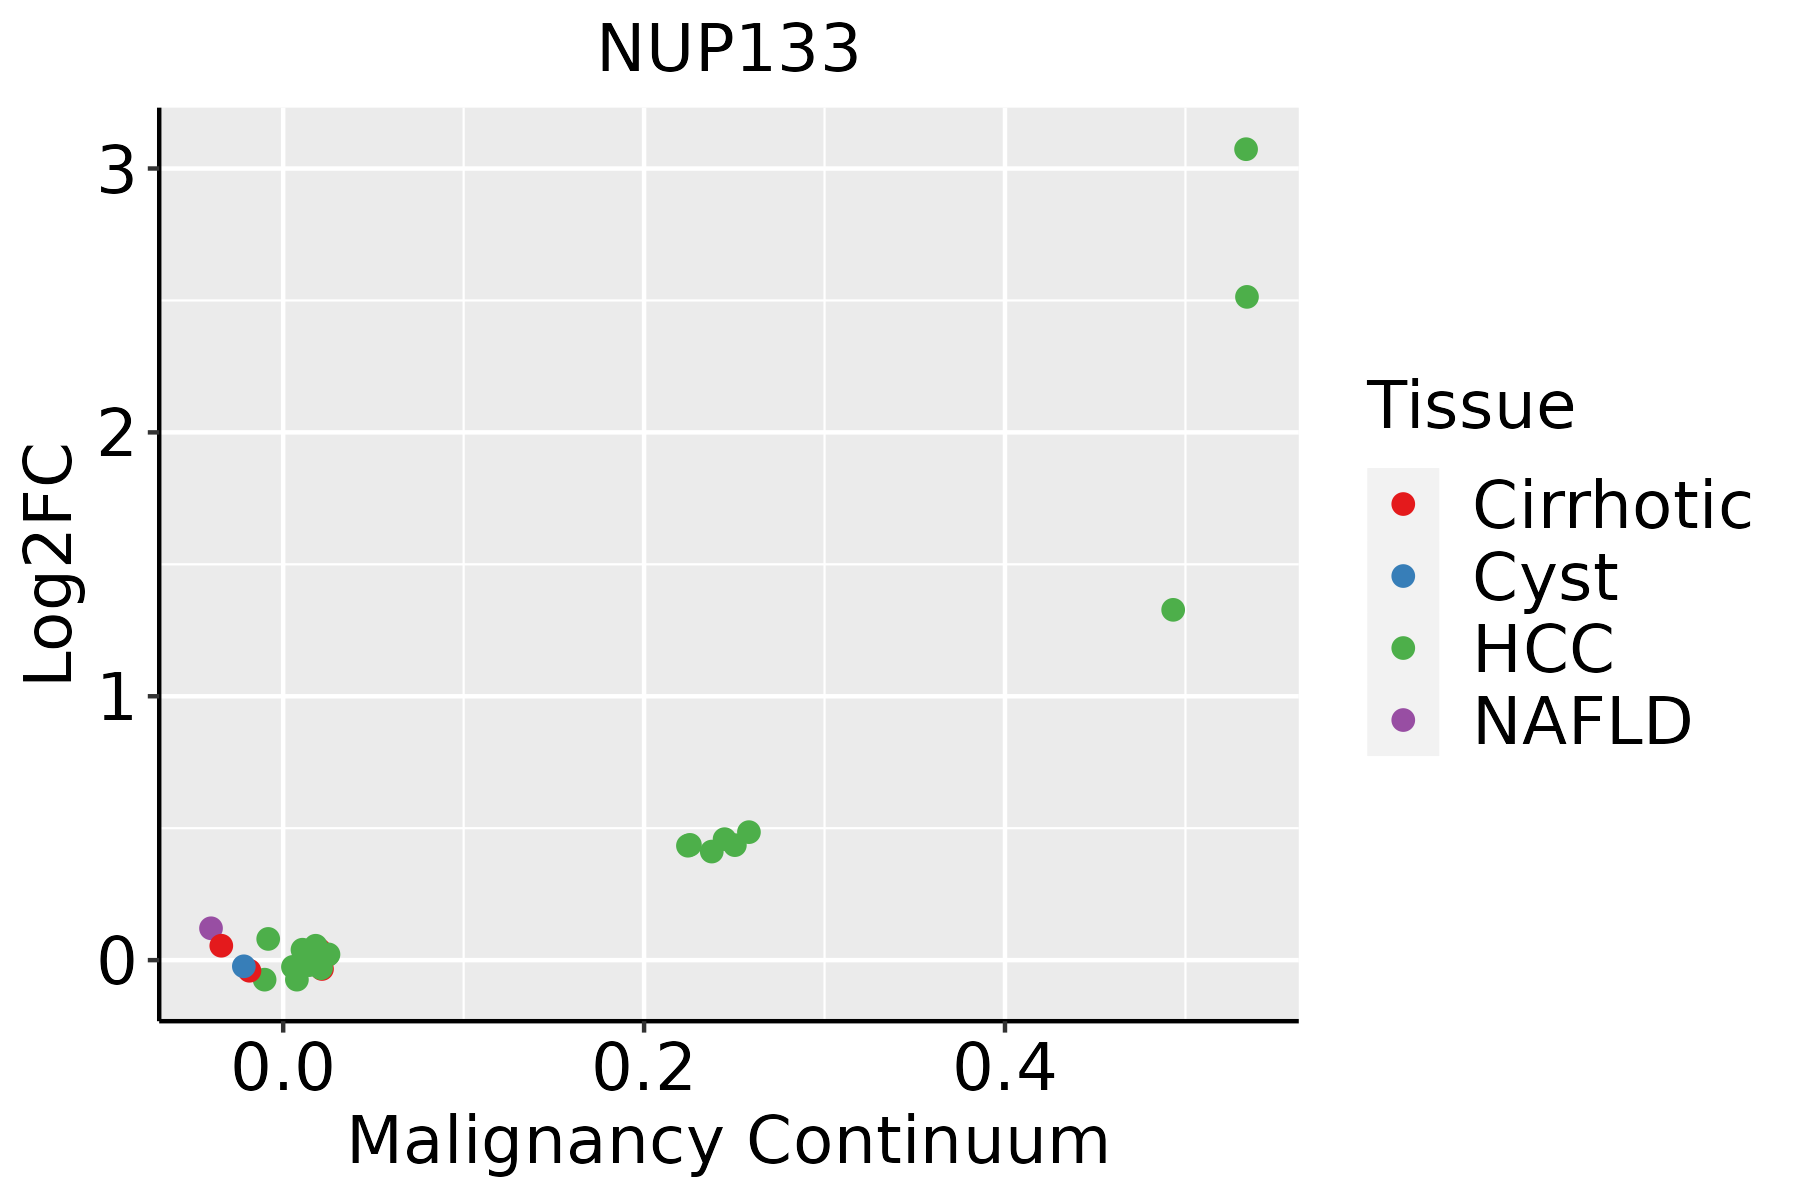 | HCC: Hepatocellular carcinoma |
| NAFLD: Non-alcoholic fatty liver disease |
| ∗log2FC in expression of this searched gene in stem-like cells from each diseased tissue sample relative to stem-like cells in normal samples in each tissue plotted against the malignancy continuum. Samples are colored based on if they are from different disease stage. |
Top |
Malignant transformation related pathway analysis |
| Find out the enriched GO biological processes and KEGG pathways involved in transition from healthy to precancer to cancer |
| Tissue | Disease Stage | Enriched GO biological Processes |
| Colorectum | AD |  |
| Colorectum | SER |  |
| Colorectum | MSS |  |
| Colorectum | MSI-H |  |
| Colorectum | FAP |  |
| ∗Top 15 enriched GO BP terms are showed in the bar plot of each disease state in each tissue. Each row represents a significant GO biological process which is colored according to the -log10(p.adjust). |
| Page: 1 2 3 4 5 6 7 8 9 |
| GO ID | Tissue | Disease Stage | Description | Gene Ratio | Bg Ratio | pvalue | p.adjust | Count |
| GO:003150314 | Esophagus | ESCC | protein-containing complex localization | 139/8552 | 220/18723 | 1.14e-07 | 1.85e-06 | 139 |
| GO:00219159 | Esophagus | ESCC | neural tube development | 101/8552 | 152/18723 | 1.78e-07 | 2.79e-06 | 101 |
| GO:00069994 | Esophagus | ESCC | nuclear pore organization | 14/8552 | 14/18723 | 1.71e-05 | 1.52e-04 | 14 |
| GO:00604856 | Esophagus | ESCC | mesenchyme development | 156/8552 | 291/18723 | 3.76e-03 | 1.53e-02 | 156 |
| GO:00016559 | Esophagus | ESCC | urogenital system development | 177/8552 | 338/18723 | 7.51e-03 | 2.69e-02 | 177 |
| GO:0048339 | Esophagus | ESCC | paraxial mesoderm development | 13/8552 | 17/18723 | 1.00e-02 | 3.42e-02 | 13 |
| GO:007259422 | Liver | HCC | establishment of protein localization to organelle | 299/7958 | 422/18723 | 1.06e-32 | 6.10e-30 | 299 |
| GO:000640321 | Liver | HCC | RNA localization | 151/7958 | 201/18723 | 3.72e-21 | 5.89e-19 | 151 |
| GO:000691322 | Liver | HCC | nucleocytoplasmic transport | 208/7958 | 301/18723 | 5.51e-21 | 8.12e-19 | 208 |
| GO:005116922 | Liver | HCC | nuclear transport | 208/7958 | 301/18723 | 5.51e-21 | 8.12e-19 | 208 |
| GO:003450421 | Liver | HCC | protein localization to nucleus | 194/7958 | 290/18723 | 2.84e-17 | 2.85e-15 | 194 |
| GO:005123621 | Liver | HCC | establishment of RNA localization | 121/7958 | 166/18723 | 1.61e-15 | 1.19e-13 | 121 |
| GO:005116822 | Liver | HCC | nuclear export | 113/7958 | 154/18723 | 6.30e-15 | 4.39e-13 | 113 |
| GO:005065711 | Liver | HCC | nucleic acid transport | 118/7958 | 163/18723 | 8.30e-15 | 5.60e-13 | 118 |
| GO:005065811 | Liver | HCC | RNA transport | 118/7958 | 163/18723 | 8.30e-15 | 5.60e-13 | 118 |
| GO:001593111 | Liver | HCC | nucleobase-containing compound transport | 150/7958 | 222/18723 | 3.17e-14 | 2.03e-12 | 150 |
| GO:005102811 | Liver | HCC | mRNA transport | 97/7958 | 130/18723 | 9.00e-14 | 5.23e-12 | 97 |
| GO:001703811 | Liver | HCC | protein import | 140/7958 | 206/18723 | 1.12e-13 | 6.46e-12 | 140 |
| GO:00711661 | Liver | HCC | ribonucleoprotein complex localization | 59/7958 | 77/18723 | 1.09e-09 | 3.30e-08 | 59 |
| GO:00714261 | Liver | HCC | ribonucleoprotein complex export from nucleus | 58/7958 | 76/18723 | 1.98e-09 | 5.63e-08 | 58 |
| Page: 1 2 3 |
| Pathway ID | Tissue | Disease Stage | Description | Gene Ratio | Bg Ratio | pvalue | p.adjust | qvalue | Count |
| hsa05014210 | Esophagus | ESCC | Amyotrophic lateral sclerosis | 266/4205 | 364/8465 | 1.31e-20 | 2.20e-18 | 1.13e-18 | 266 |
| hsa0301321 | Esophagus | ESCC | Nucleocytoplasmic transport | 89/4205 | 108/8465 | 1.20e-12 | 2.37e-11 | 1.21e-11 | 89 |
| hsa0501438 | Esophagus | ESCC | Amyotrophic lateral sclerosis | 266/4205 | 364/8465 | 1.31e-20 | 2.20e-18 | 1.13e-18 | 266 |
| hsa0301331 | Esophagus | ESCC | Nucleocytoplasmic transport | 89/4205 | 108/8465 | 1.20e-12 | 2.37e-11 | 1.21e-11 | 89 |
| hsa0501422 | Liver | HCC | Amyotrophic lateral sclerosis | 252/4020 | 364/8465 | 8.85e-18 | 7.41e-16 | 4.12e-16 | 252 |
| hsa03013 | Liver | HCC | Nucleocytoplasmic transport | 81/4020 | 108/8465 | 4.28e-09 | 6.83e-08 | 3.80e-08 | 81 |
| hsa0501432 | Liver | HCC | Amyotrophic lateral sclerosis | 252/4020 | 364/8465 | 8.85e-18 | 7.41e-16 | 4.12e-16 | 252 |
| hsa030131 | Liver | HCC | Nucleocytoplasmic transport | 81/4020 | 108/8465 | 4.28e-09 | 6.83e-08 | 3.80e-08 | 81 |
| Page: 1 |
Top |
Cell-cell communication analysis |
| Identification of potential cell-cell interactions between two cell types and their ligand-receptor pairs for different disease states |
| Ligand | Receptor | LRpair | Pathway | Tissue | Disease Stage |
| Page: 1 |
Top |
Single-cell gene regulatory network inference analysis |
| Find out the significant the regulons (TFs) and the target genes of each regulon across cell types for different disease states |
| TF | Cell Type | Tissue | Disease Stage | Target Gene | RSS | Regulon Activity |
| NUP133 | SMC | Breast | ADJ | APOA1BP,RAD50,CLK2, etc. | 1.28e-02 |  |
| NUP133 | ICAF | Breast | DCIS | APOA1BP,RAD50,CLK2, etc. | 0.00e+00 |  |
| NUP133 | MEN | Skin | Healthy | PRKCH,SMAD4,SPIN1, etc. | 1.18e-02 |  |
| NUP133 | MESC | Stomach | ADJ | ZCWPW2,DUOX2,BTD, etc. | 9.64e-02 |  |
| NUP133 | A.X | Stomach | ADJ | ZCWPW2,DUOX2,BTD, etc. | 5.84e-02 | |
| NUP133 | MESC | Stomach | CAG | ZCWPW2,DUOX2,BTD, etc. | 3.63e-02 |  |
| NUP133 | MESC | Stomach | CAG with IM | ZCWPW2,DUOX2,BTD, etc. | 5.16e-02 |  |
| NUP133 | A.X | Stomach | SIM | ZCWPW2,DUOX2,BTD, etc. | 4.76e-02 |  |
| NUP133 | MESC | Stomach | WIM | ZCWPW2,DUOX2,BTD, etc. | 4.76e-02 |  |
| ∗The dot plots of a searched regulon are shown for all cell subpopulations in each disease state of each tissue based on the regulon specific score inferred using pySCENIC and by calculating the average expression. |
| Page: 1 |
Top |
Somatic mutation of malignant transformation related genes |
| Annotation of somatic variants for genes involved in malignant transformation |
| Hugo Symbol | Variant Class | Variant Classification | dbSNP RS | HGVSc | HGVSp | HGVSp Short | SWISSPROT | BIOTYPE | SIFT | PolyPhen | Tumor Sample Barcode | Tissue | Histology | Sex | Age | Stage | Therapy Types | Drugs | Outcome |
| NUP133 | SNV | Missense_Mutation | novel | c.2338N>A | p.Arg780Ser | p.R780S | Q8WUM0 | protein_coding | deleterious(0) | possibly_damaging(0.779) | TCGA-A2-A0D1-01 | Breast | breast invasive carcinoma | Female | >=65 | I/II | Chemotherapy | taxotere | SD |
| NUP133 | SNV | Missense_Mutation | c.1022G>A | p.Arg341Gln | p.R341Q | Q8WUM0 | protein_coding | tolerated(0.61) | benign(0.001) | TCGA-AN-A046-01 | Breast | breast invasive carcinoma | Female | >=65 | I/II | Unknown | Unknown | SD | |
| NUP133 | SNV | Missense_Mutation | c.1025N>G | p.Tyr342Cys | p.Y342C | Q8WUM0 | protein_coding | deleterious(0) | probably_damaging(0.956) | TCGA-D8-A1XK-01 | Breast | breast invasive carcinoma | Female | <65 | I/II | Chemotherapy | doxorubicine+cyclophosphamide | SD | |
| NUP133 | SNV | Missense_Mutation | c.787N>C | p.Phe263Leu | p.F263L | Q8WUM0 | protein_coding | tolerated(0.45) | benign(0.01) | TCGA-E9-A1NE-01 | Breast | breast invasive carcinoma | Female | <65 | I/II | Chemotherapy | doxorubicin | CR | |
| NUP133 | SNV | Missense_Mutation | c.1376N>C | p.Gly459Ala | p.G459A | Q8WUM0 | protein_coding | deleterious(0.01) | benign(0.109) | TCGA-E9-A1NF-01 | Breast | breast invasive carcinoma | Female | <65 | I/II | Chemotherapy | doxorubicin | PD | |
| NUP133 | SNV | Missense_Mutation | novel | c.2003T>G | p.Ile668Arg | p.I668R | Q8WUM0 | protein_coding | deleterious(0) | probably_damaging(0.966) | TCGA-OL-A66P-01 | Breast | breast invasive carcinoma | Female | >=65 | I/II | Chemotherapy | cytoxan | CR |
| NUP133 | insertion | In_Frame_Ins | novel | c.2231_2232insCATCTTCCCAAATGAAAGGTTTATTATTCTACC | p.Gln744delinsHisIlePheProAsnGluArgPheIleIleLeuPro | p.Q744delinsHIFPNERFIILP | Q8WUM0 | protein_coding | TCGA-A2-A0CP-01 | Breast | breast invasive carcinoma | Female | <65 | I/II | Chemotherapy | cytoxan | SD | ||
| NUP133 | deletion | Frame_Shift_Del | novel | c.2389delC | p.Leu797SerfsTer5 | p.L797Sfs*5 | Q8WUM0 | protein_coding | TCGA-EW-A2FV-01 | Breast | breast invasive carcinoma | Female | <65 | III/IV | Chemotherapy | docetaxel | SD | ||
| NUP133 | SNV | Missense_Mutation | rs751402996 | c.3065C>T | p.Ala1022Val | p.A1022V | Q8WUM0 | protein_coding | tolerated(0.3) | benign(0.102) | TCGA-2W-A8YY-01 | Cervix | cervical & endocervical cancer | Female | <65 | I/II | Chemotherapy | cisplatin | CR |
| NUP133 | SNV | Missense_Mutation | c.2801A>T | p.His934Leu | p.H934L | Q8WUM0 | protein_coding | deleterious(0.01) | probably_damaging(0.971) | TCGA-C5-A7UE-01 | Cervix | cervical & endocervical cancer | Female | <65 | I/II | Chemotherapy | cisplatin | SD |
| Page: 1 2 3 4 5 6 7 8 9 10 11 12 |
Top |
Related drugs of malignant transformation related genes |
| Identification of chemicals and drugs interact with genes involved in malignant transfromation |
| (DGIdb 4.0) |
| Entrez ID | Symbol | Category | Interaction Types | Drug Claim Name | Drug Name | PMIDs |
| Page: 1 |

Copyright 2023-Present -The University of Texas Health Science Center at Houston |