Schematic overview of the cellular and molecular mechanisms involved in the cancer progression, including the proposed cellular and molecular mechanisms in cancer cells trajectory. AT1: alveolar type 1 cells; AT2: alveolar type 2 cells; AAH: atypical adenomatous hyperplasia; AIS: adenocarcinoma in situ; MIA: minimally invasive adenocarcinoma; IA: invasive adenocarcinoma; EMT: epithelial-mesenchymal transition

Home

Download

Statistics

Help

Contact

Center for Computational Systems Medicine
leaf

Gene summary

leaf

Malignant transformation analysis

leaf

Malignant transformation related pathway analysis

leaf

Cell-cell communication analysis

leaf

Single-cell gene regulatory network inference analysis

leaf

Somatic mutation of malignant transformation related genes

leaf

Related drugs of malignant transformation related genes

Gene: NUDC

Gene summary for NUDC

check button Gene summary.

Gene informationSpeciesHuman
Gene symbol

NUDC

Gene ID

10726

Gene namenuclear distribution C, dynein complex regulator
Gene AliasHNUDC
Cytomap1p36.11
Gene Typeprotein-coding
GO ID

GO:0000070

UniProtAcc

Q9Y266


Top

Malignant transformation analysis

check button Identification of the aberrant gene expression in precancerous and cancerous lesions by comparing the gene expression of stem-like cells in diseased tissues with normal stem cells
check button Malignant transformation involving gene list.
Entrez IDSymbolReplicatesSpeciesOrganTissueAdj P-valueLog2FCMalignancy
10726NUDCGSM4909282HumanBreastIDC1.52e-103.89e-01-0.0288
10726NUDCGSM4909296HumanBreastIDC8.44e-06-9.34e-020.1524
10726NUDCGSM4909297HumanBreastIDC1.88e-11-2.62e-020.1517
10726NUDCGSM4909311HumanBreastIDC1.98e-27-3.98e-010.1534
10726NUDCGSM4909312HumanBreastIDC6.43e-11-2.79e-010.1552
10726NUDCGSM4909318HumanBreastIDC2.85e-021.66e-010.2031
10726NUDCGSM4909319HumanBreastIDC4.13e-39-1.78e-010.1563
10726NUDCGSM4909320HumanBreastIDC3.51e-06-1.28e-010.1575
10726NUDCGSM4909321HumanBreastIDC1.76e-115.69e-020.1559
10726NUDCbrca1HumanBreastPrecancer9.31e-185.35e-01-0.0338
10726NUDCbrca2HumanBreastPrecancer1.72e-174.43e-01-0.024
10726NUDCbrca3HumanBreastPrecancer8.92e-103.89e-01-0.0263
10726NUDCM2HumanBreastIDC8.04e-038.61e-020.21
10726NUDCNCCBC11HumanBreastDCIS2.15e-021.75e-010.1232
10726NUDCNCCBC14HumanBreastDCIS1.52e-11-7.65e-030.2021
10726NUDCNCCBC2HumanBreastDCIS5.86e-03-2.00e-010.1554
10726NUDCNCCBC5HumanBreastDCIS4.01e-14-2.16e-040.2046
10726NUDCP1HumanBreastIDC2.89e-25-2.72e-010.1527
10726NUDCP2HumanBreastIDC3.28e-145.17e-010.21
10726NUDCDCIS2HumanBreastDCIS2.23e-611.95e-010.0085
Page: 1 2 3 4 5 6 7 8 9 10 11 

check button Transcriptomic changes along malignancy continuum.
TissueExpression DynamicsAbbreviation
BreastThe image shows the transcriptomic changes along malignancy continuum.log2FC in expression of this searched gene in stem-like cells from each diseased tissue sample relative to stem-like cells in normal samples in each tissue plotted against the malignancy continuum. Samples are colored based on if they are from different disease stage.IDC: Invasive ductal carcinoma
DCIS: Ductal carcinoma in situ
Precancer(BRCA1-mut): Precancerous lesion from BRCA1 mutation carriers
Colorectum (GSE201348)The image shows the transcriptomic changes along malignancy continuum.log2FC in expression of this searched gene in stem-like cells from each diseased tissue sample relative to stem-like cells in normal samples in each tissue plotted against the malignancy continuum. Samples are colored based on if they are from different disease stage.FAP: Familial adenomatous polyposis
CRC: Colorectal cancer
Colorectum (HTA11)The image shows the transcriptomic changes along malignancy continuum.log2FC in expression of this searched gene in stem-like cells from each diseased tissue sample relative to stem-like cells in normal samples in each tissue plotted against the malignancy continuum. Samples are colored based on if they are from different disease stage.AD: Adenomas
SER: Sessile serrated lesions
MSI-H: Microsatellite-high colorectal cancer
MSS: Microsatellite stable colorectal cancer
EndometriumThe image shows the transcriptomic changes along malignancy continuum.log2FC in expression of this searched gene in stem-like cells from each diseased tissue sample relative to stem-like cells in normal samples in each tissue plotted against the malignancy continuum. Samples are colored based on if they are from different disease stage.AEH: Atypical endometrial hyperplasia
EEC: Endometrioid Cancer
EsophagusThe image shows the transcriptomic changes along malignancy continuum.log2FC in expression of this searched gene in stem-like cells from each diseased tissue sample relative to stem-like cells in normal samples in each tissue plotted against the malignancy continuum. Samples are colored based on if they are from different disease stage.
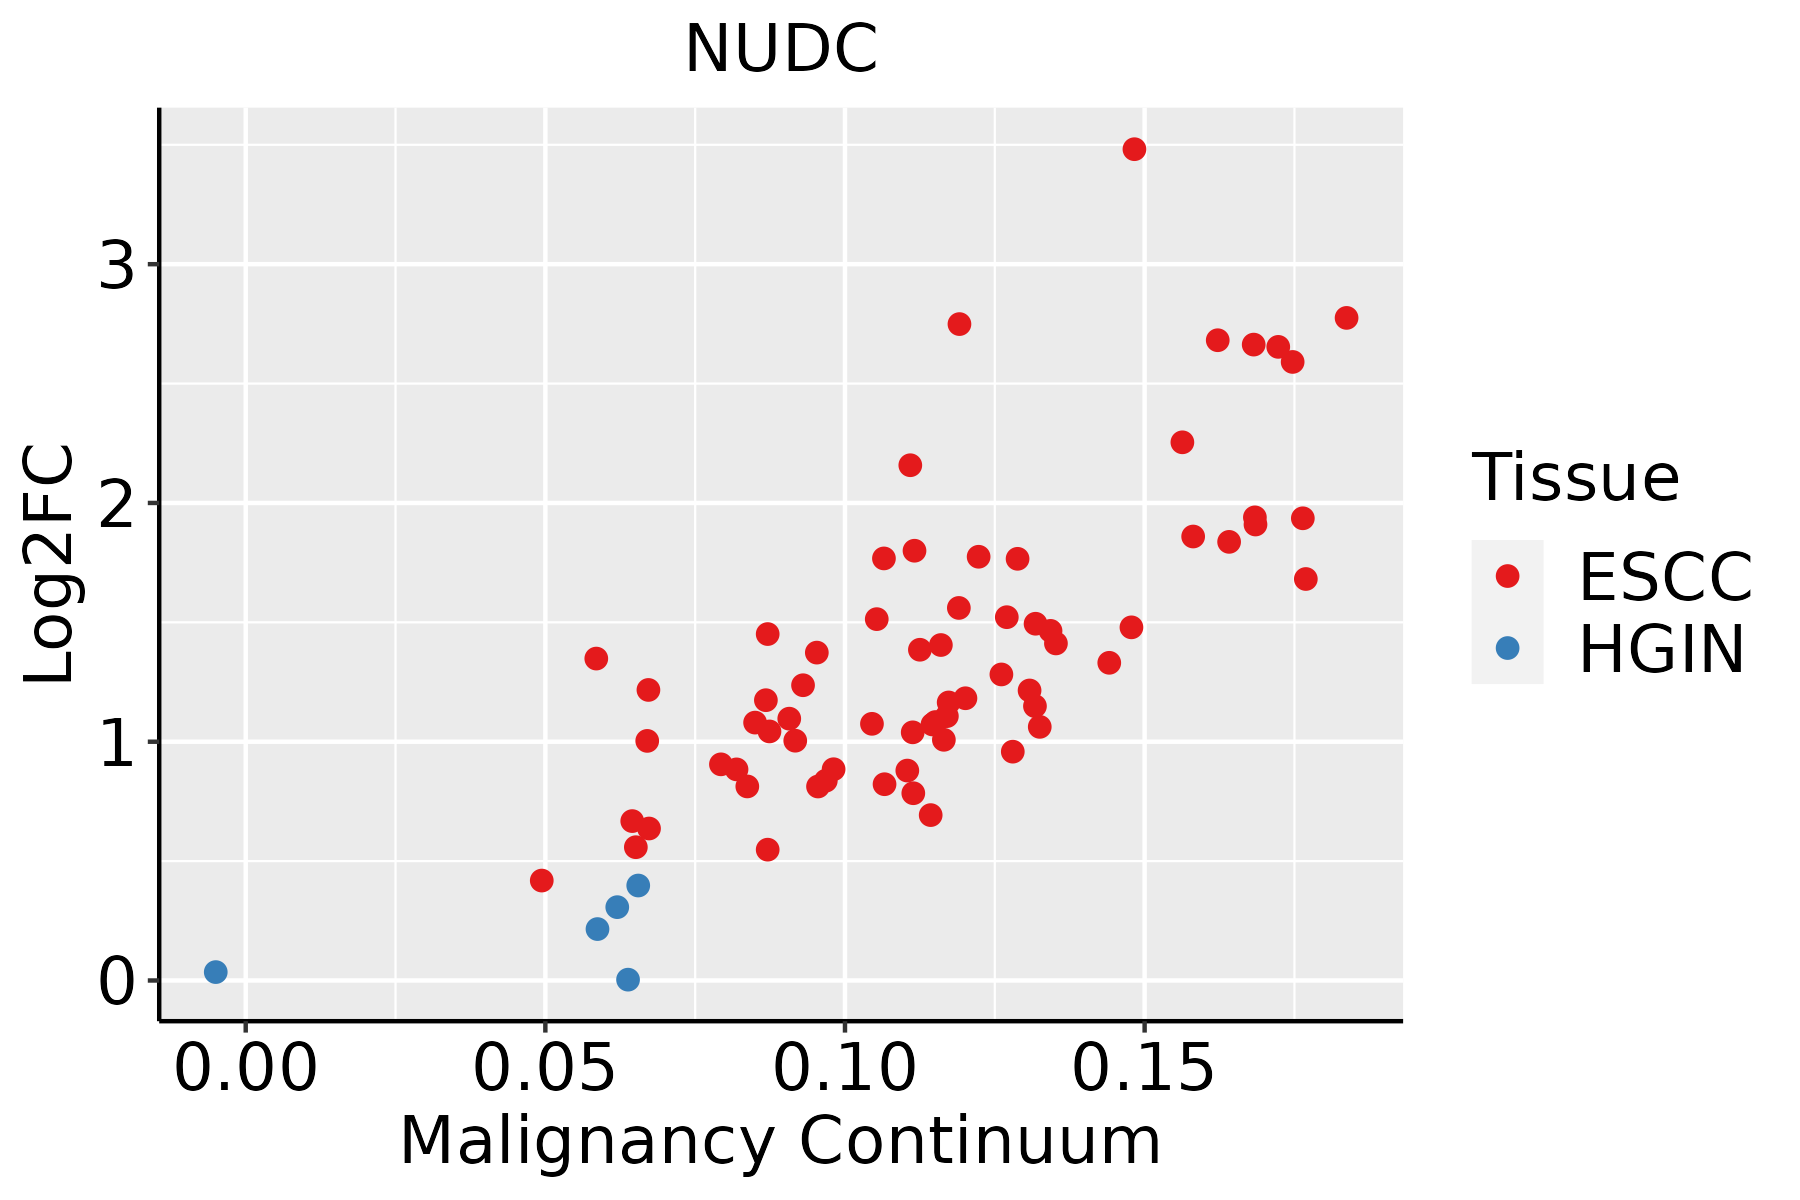
ESCC: Esophageal squamous cell carcinoma
HGIN: High-grade intraepithelial neoplasias
LGIN: Low-grade intraepithelial neoplasias
LiverThe image shows the transcriptomic changes along malignancy continuum.log2FC in expression of this searched gene in stem-like cells from each diseased tissue sample relative to stem-like cells in normal samples in each tissue plotted against the malignancy continuum. Samples are colored based on if they are from different disease stage.
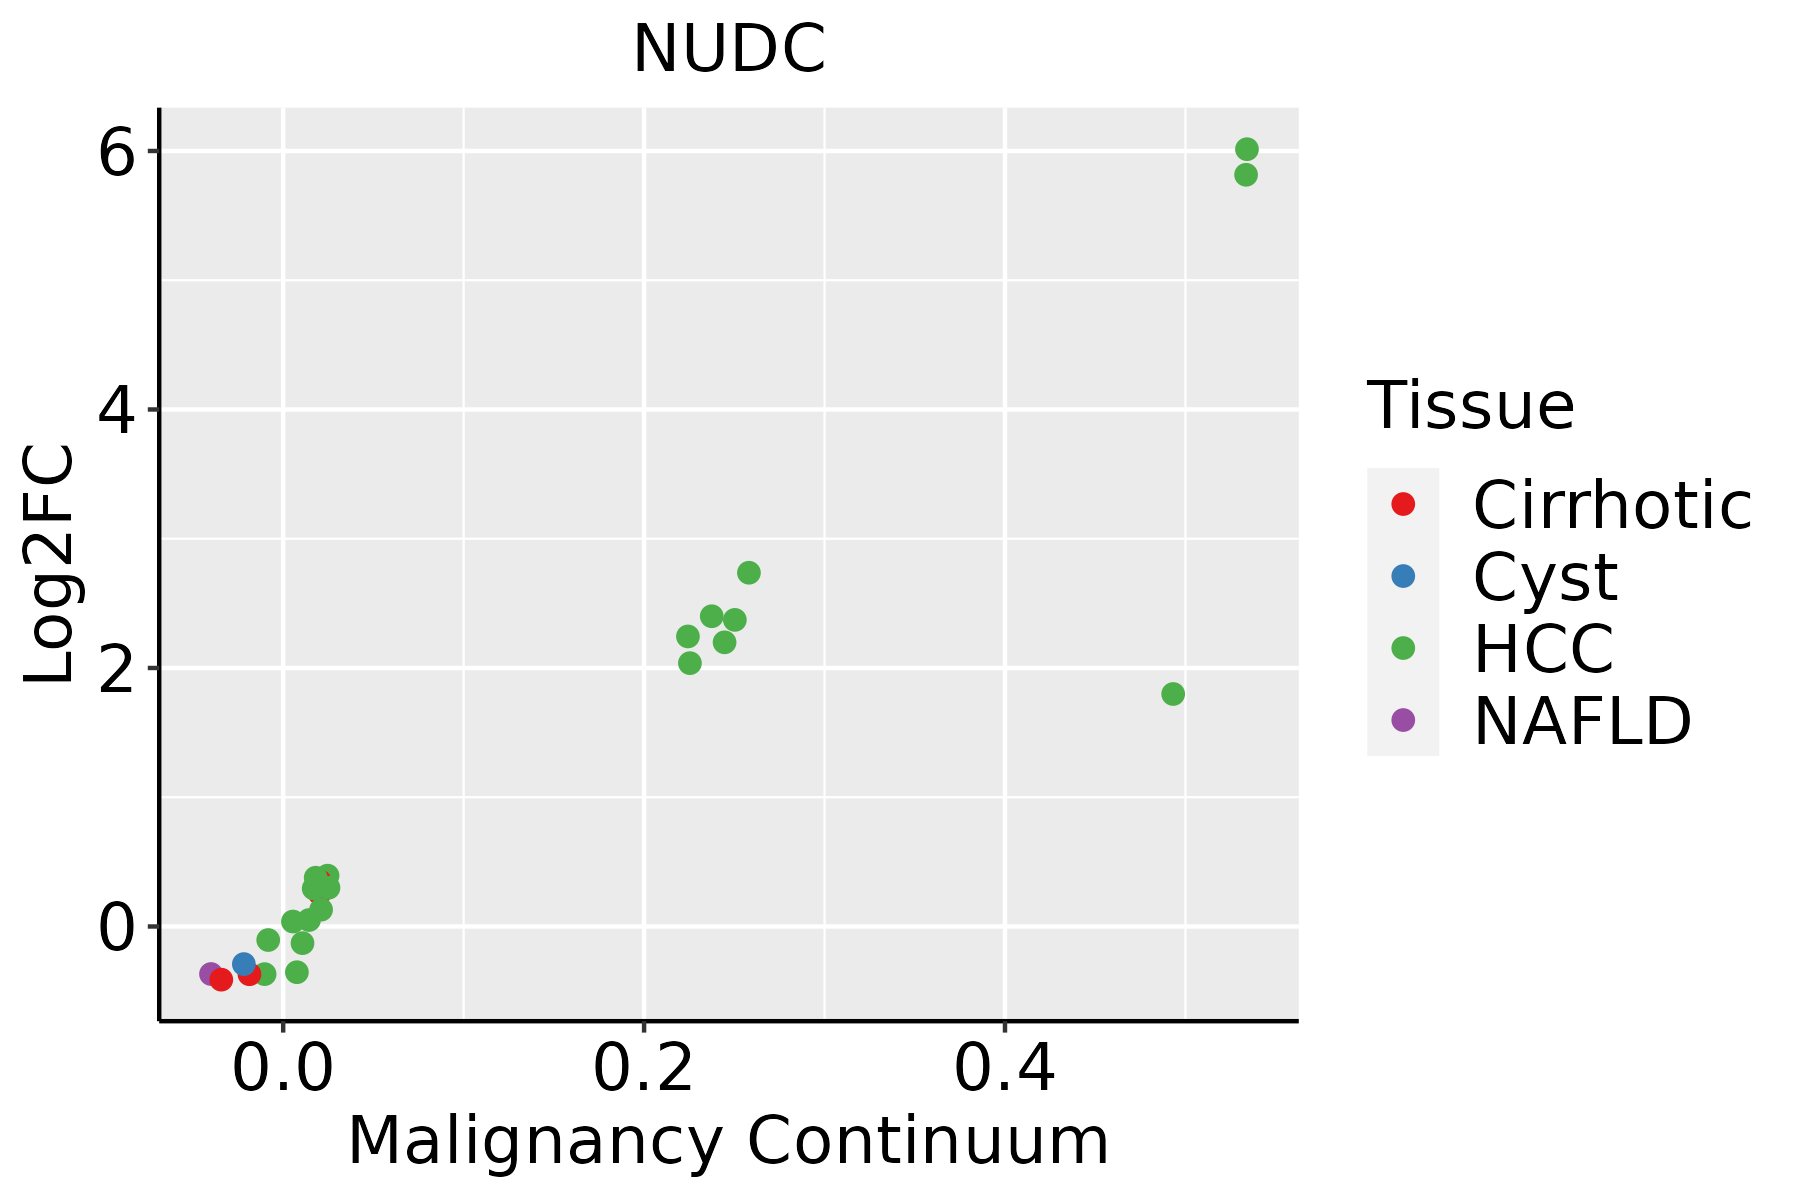
HCC: Hepatocellular carcinoma
NAFLD: Non-alcoholic fatty liver disease
Oral CavityThe image shows the transcriptomic changes along malignancy continuum.log2FC in expression of this searched gene in stem-like cells from each diseased tissue sample relative to stem-like cells in normal samples in each tissue plotted against the malignancy continuum. Samples are colored based on if they are from different disease stage.EOLP: Erosive Oral lichen planus
LP: leukoplakia
NEOLP: Non-erosive oral lichen planus
OSCC: Oral squamous cell carcinoma
ProstateThe image shows the transcriptomic changes along malignancy continuum.log2FC in expression of this searched gene in stem-like cells from each diseased tissue sample relative to stem-like cells in normal samples in each tissue plotted against the malignancy continuum. Samples are colored based on if they are from different disease stage.BPH: Benign Prostatic Hyperplasia
SkinThe image shows the transcriptomic changes along malignancy continuum.log2FC in expression of this searched gene in stem-like cells from each diseased tissue sample relative to stem-like cells in normal samples in each tissue plotted against the malignancy continuum. Samples are colored based on if they are from different disease stage.
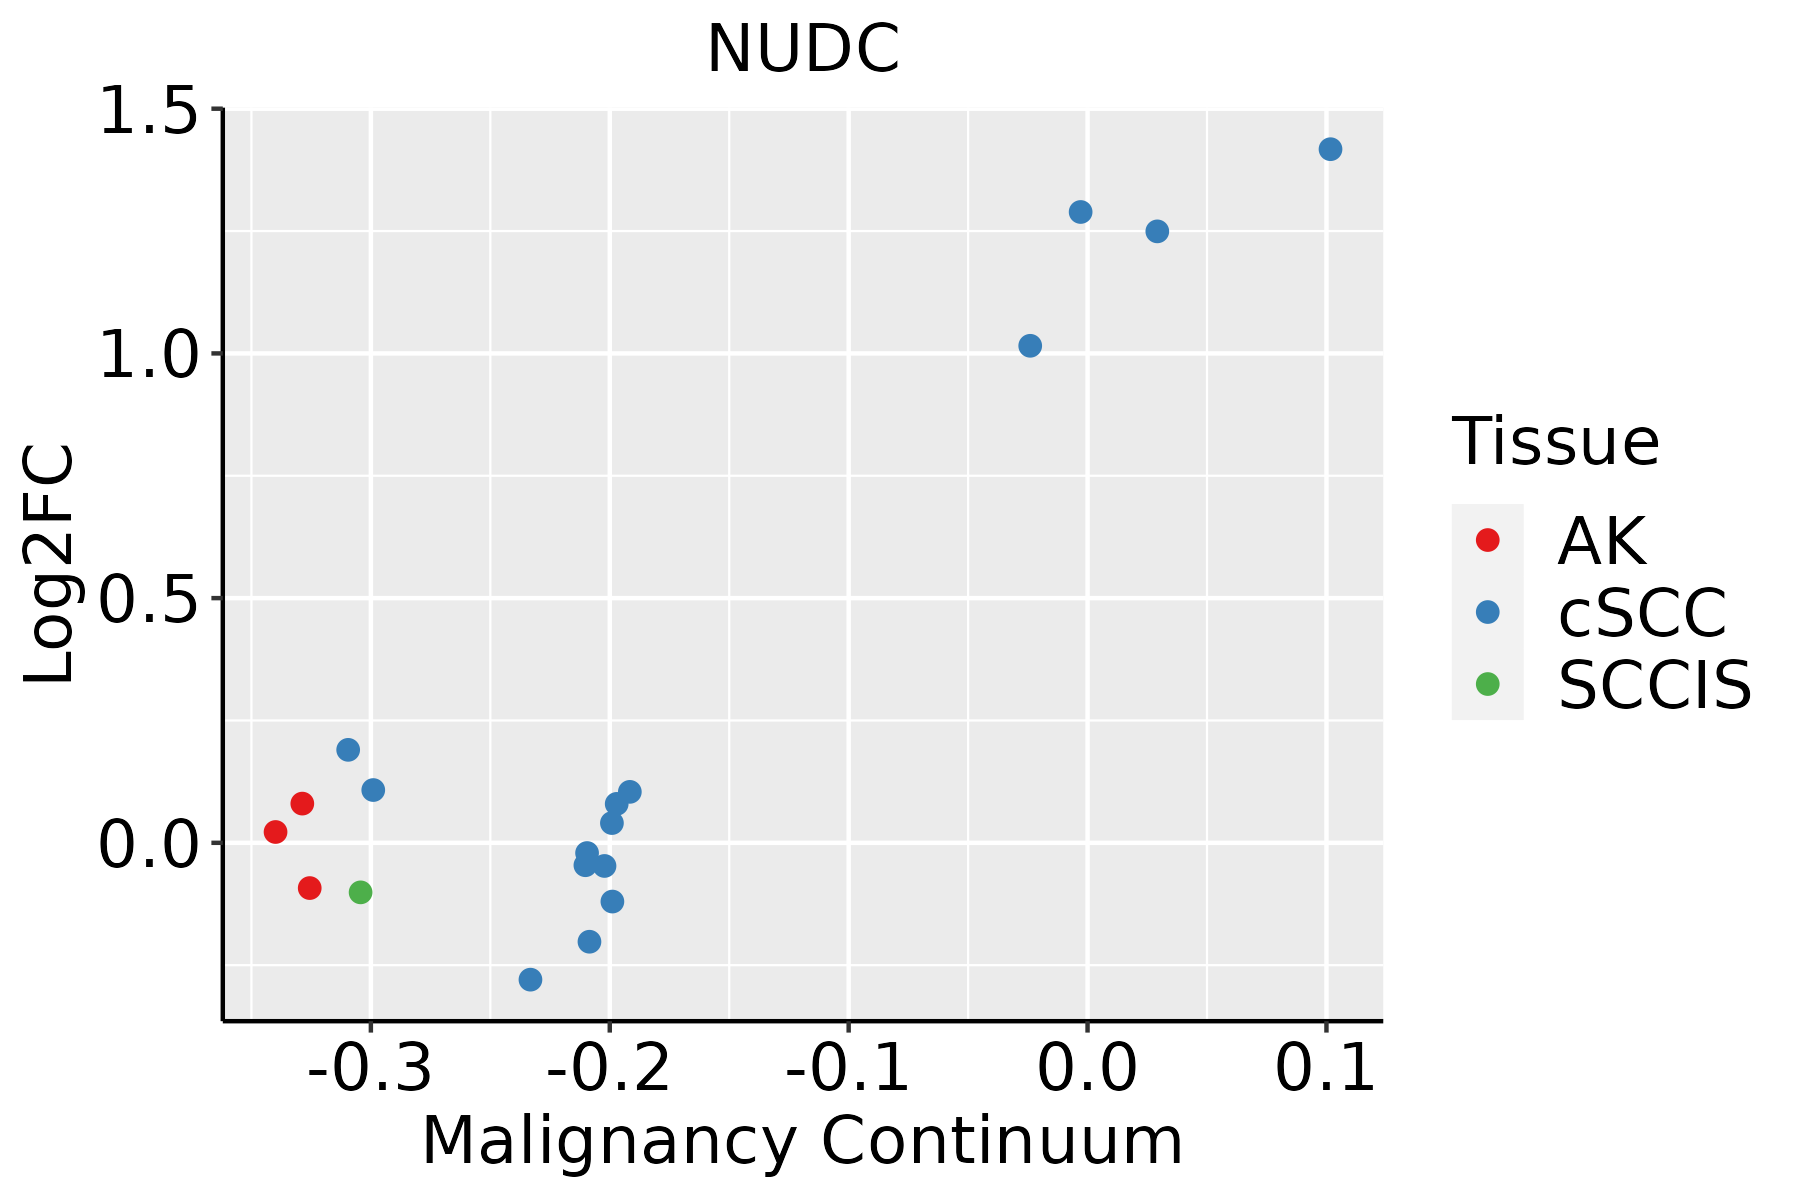
AK: Actinic keratosis
cSCC: Cutaneous squamous cell carcinoma
SCCIS:squamous cell carcinoma in situ
ThyroidThe image shows the transcriptomic changes along malignancy continuum.log2FC in expression of this searched gene in stem-like cells from each diseased tissue sample relative to stem-like cells in normal samples in each tissue plotted against the malignancy continuum. Samples are colored based on if they are from different disease stage.
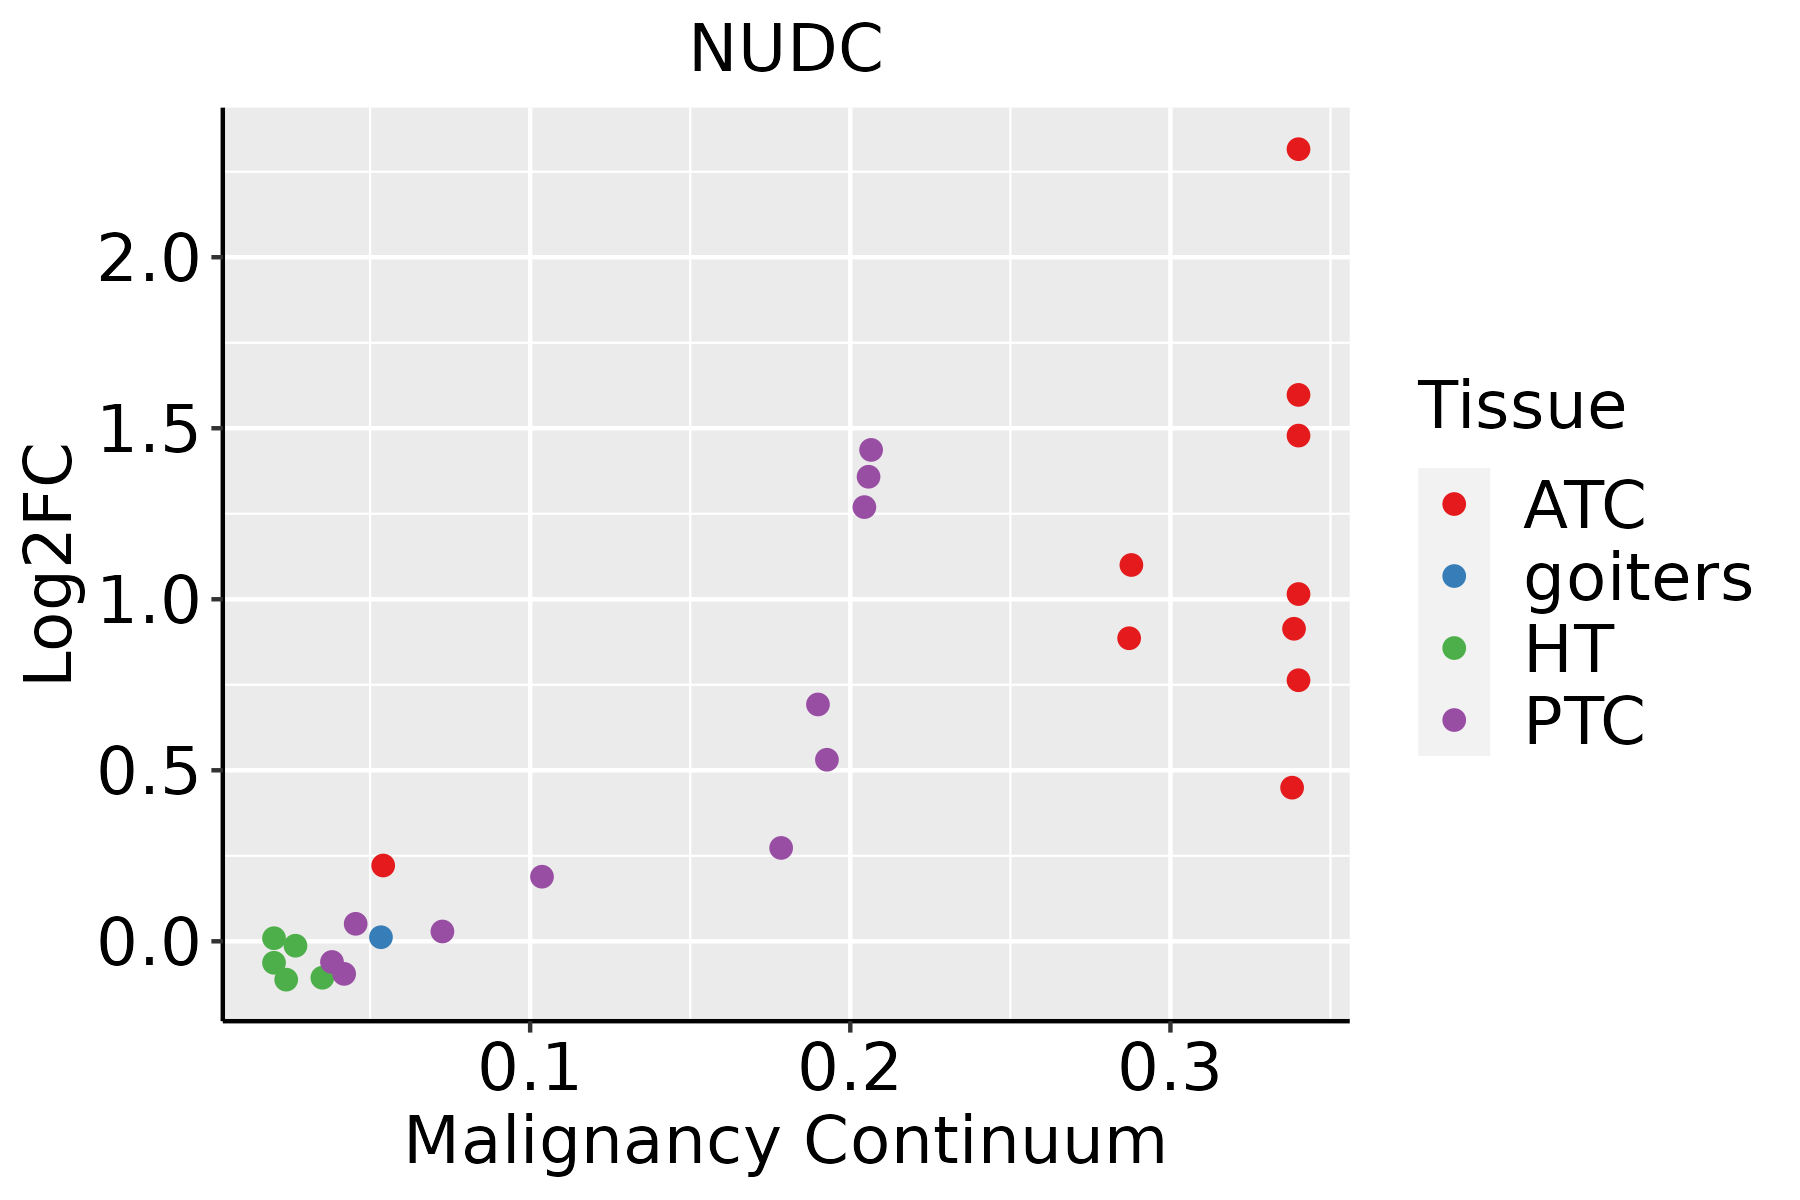
ATC: Anaplastic thyroid cancer
HT: Hashimoto's thyroiditis
PTC: Papillary thyroid cancer
∗log2FC in expression of this searched gene in stem-like cells from each diseased tissue sample relative to stem-like cells in normal samples in each tissue plotted against the malignancy continuum. Samples are colored based on if they are from different disease stage.

Top

Malignant transformation related pathway analysis

check buttonFind out the enriched GO biological processes and KEGG pathways involved in transition from healthy to precancer to cancer
check button Figure of enriched GO biological processes.
TissueDisease StageEnriched GO biological Processes
ColorectumADGO analysis - Figure of enriched GO biological processes: Top 15 enriched GO BP terms are showed in the bar plot of each disease state in each tissue. Each row represents a significant GO biological process which is colored according to the -log10(p.adjust).
ColorectumSERGO analysis - Figure of enriched GO biological processes: Top 15 enriched GO BP terms are showed in the bar plot of each disease state in each tissue. Each row represents a significant GO biological process which is colored according to the -log10(p.adjust).
ColorectumMSSGO analysis - Figure of enriched GO biological processes: Top 15 enriched GO BP terms are showed in the bar plot of each disease state in each tissue. Each row represents a significant GO biological process which is colored according to the -log10(p.adjust).
ColorectumMSI-HGO analysis - Figure of enriched GO biological processes: Top 15 enriched GO BP terms are showed in the bar plot of each disease state in each tissue. Each row represents a significant GO biological process which is colored according to the -log10(p.adjust).
ColorectumFAPGO analysis - Figure of enriched GO biological processes: Top 15 enriched GO BP terms are showed in the bar plot of each disease state in each tissue. Each row represents a significant GO biological process which is colored according to the -log10(p.adjust).
∗Top 15 enriched GO BP terms are showed in the bar plot of each disease state in each tissue. Each row represents a significant GO biological process which is colored according to the -log10(p.adjust).
Page: 1 2 3 4 5 6 7 8 9 

check button Enriched GO biological processes.
GO IDTissueDisease StageDescriptionGene RatioBg Ratiopvaluep.adjustCount
GO:000645710EndometriumAEHprotein folding61/2100212/187231.86e-123.48e-1061
GO:00516568EndometriumAEHestablishment of organelle localization77/2100390/187234.89e-071.94e-0577
GO:19028504EndometriumAEHmicrotubule cytoskeleton organization involved in mitosis28/2100147/187233.46e-032.39e-0228
GO:00070524EndometriumAEHmitotic spindle organization23/2100120/187237.01e-034.07e-0223
GO:000645715EndometriumEECprotein folding63/2168212/187236.82e-131.40e-1063
GO:005165613EndometriumEECestablishment of organelle localization75/2168390/187236.23e-061.49e-0475
GO:000645720EsophagusHGINprotein folding75/2587212/187231.61e-153.86e-1375
GO:005165616EsophagusHGINestablishment of organelle localization90/2587390/187234.27e-071.94e-0590
GO:00500003EsophagusHGINchromosome localization24/258782/187232.07e-043.82e-0324
GO:00070527EsophagusHGINmitotic spindle organization31/2587120/187233.35e-045.50e-0331
GO:01400146EsophagusHGINmitotic nuclear division61/2587287/187233.38e-045.55e-0361
GO:00070593EsophagusHGINchromosome segregation71/2587346/187233.47e-045.62e-0371
GO:19028507EsophagusHGINmicrotubule cytoskeleton organization involved in mitosis36/2587147/187233.61e-045.68e-0336
GO:00513033EsophagusHGINestablishment of chromosome localization23/258780/187233.71e-045.77e-0323
GO:00070518EsophagusHGINspindle organization42/2587184/187236.07e-048.49e-0342
GO:00070803EsophagusHGINmitotic metaphase plate congression15/258750/187232.35e-032.39e-0215
GO:00513103EsophagusHGINmetaphase plate congression18/258765/187232.46e-032.45e-0218
GO:00000703EsophagusHGINmitotic sister chromatid segregation36/2587168/187234.42e-033.87e-0236
GO:014001414EsophagusESCCmitotic nuclear division218/8552287/187236.17e-261.78e-23218
GO:005165617EsophagusESCCestablishment of organelle localization273/8552390/187239.13e-231.81e-20273
Page: 1 2 3 4 5 6 7 8 9 10 

check button Enriched KEGG pathways.
Pathway IDTissueDisease StageDescriptionGene RatioBg Ratiopvaluep.adjustqvalueCount
Page: 1 

Top

Cell-cell communication analysis

check buttonIdentification of potential cell-cell interactions between two cell types and their ligand-receptor pairs for different disease states
LigandReceptorLRpairPathwayTissueDisease Stage
Page: 1 

Top

Single-cell gene regulatory network inference analysis

check buttonFind out the significant the regulons (TFs) and the target genes of each regulon across cell types for different disease states
TFCell TypeTissueDisease StageTarget GeneRSSRegulon Activity
∗The dot plots of a searched regulon are shown for all cell subpopulations in each disease state of each tissue based on the regulon specific score inferred using pySCENIC and by calculating the average expression.
Page: 1 

Top

Somatic mutation of malignant transformation related genes

check buttonAnnotation of somatic variants for genes involved in malignant transformation
Hugo SymbolVariant ClassVariant ClassificationdbSNP RSHGVScHGVSpHGVSp ShortSWISSPROTBIOTYPESIFTPolyPhenTumor Sample BarcodeTissueHistologySexAgeStageTherapy TypesDrugsOutcome
NUDCinsertionFrame_Shift_Insnovelc.267_268insAAGCATCACTTTTTAAAACAGCCAGTTTATTGp.Arg90LysfsTer11p.R90Kfs*11Q9Y266protein_codingTCGA-A2-A0CM-01Breastbreast invasive carcinomaFemale<65I/IIChemotherapyadriamycinPD
NUDCinsertionNonsense_Mutationnovelc.557_558insCAAGATGGTGAAACCCCATCTCTACTAAAAATACAAAAAp.Pro186_Phe187insLysMetValLysProHisLeuTyrTerLysTyrLysAsnp.P186_F187insKMVKPHLY*KYKNQ9Y266protein_codingTCGA-B6-A0I9-01Breastbreast invasive carcinomaFemale<65III/IVUnknownUnknownPD
NUDCinsertionNonsense_Mutationnovelc.613_614insATCTCTACTAAAAATACAAAAATTAGCCAp.Arg205HisfsTer4p.R205Hfs*4Q9Y266protein_codingTCGA-B6-A0RE-01Breastbreast invasive carcinomaFemale<65I/IIUnknownUnknownSD
NUDCSNVMissense_Mutationnovelc.743N>Cp.Ile248Thrp.I248TQ9Y266protein_codingdeleterious(0.03)benign(0.036)TCGA-C5-A2LV-01Cervixcervical & endocervical cancerFemale<65I/IIUnknownUnknownSD
NUDCSNVMissense_Mutationnovelc.814N>Ap.Glu272Lysp.E272KQ9Y266protein_codingdeleterious(0)probably_damaging(0.987)TCGA-VS-A8EL-01Cervixcervical & endocervical cancerFemale<65I/IIChemotherapycisplatinCR
NUDCSNVMissense_Mutationrs556308052c.130N>Gp.Ile44Valp.I44VQ9Y266protein_codingtolerated(0.29)benign(0.003)TCGA-A6-6780-01Colorectumcolon adenocarcinomaMale>=65I/IIUnknownUnknownSD
NUDCSNVMissense_Mutationc.344N>Gp.Leu115Argp.L115RQ9Y266protein_codingdeleterious(0.02)probably_damaging(0.977)TCGA-AD-6889-01Colorectumcolon adenocarcinomaMale>=65I/IIChemotherapyxelodaPD
NUDCSNVMissense_Mutationc.484N>Gp.Asn162Aspp.N162DQ9Y266protein_codingdeleterious(0)probably_damaging(0.992)TCGA-AZ-6598-01Colorectumcolon adenocarcinomaFemale>=65I/IIUnknownUnknownSD
NUDCSNVMissense_Mutationc.911C>Tp.Ser304Leup.S304LQ9Y266protein_codingdeleterious(0)probably_damaging(0.995)TCGA-AG-4015-01Colorectumrectum adenocarcinomaFemale>=65I/IIUnknownUnknownSD
NUDCSNVMissense_Mutationrs757295638c.916N>Ap.Glu306Lysp.E306KQ9Y266protein_codingdeleterious(0)probably_damaging(0.943)TCGA-A5-A0G2-01Endometriumuterine corpus endometrioid carcinomaFemale<65III/IVUnknownUnknownSD
Page: 1 2 3 

Top

Related drugs of malignant transformation related genes

check buttonIdentification of chemicals and drugs interact with genes involved in malignant transfromation
(DGIdb 4.0)
Entrez IDSymbolCategoryInteraction TypesDrug Claim NameDrug NamePMIDs
Page: 1