
|
|||||
|
 | |
| |
| |
| |
| |
| |
|
Gene: NUBPL |
Gene summary for NUBPL |
| Gene information | Species | Human | Gene symbol | NUBPL | Gene ID | 80224 |
| Gene name | nucleotide binding protein like | |
| Gene Alias | C14orf127 | |
| Cytomap | 14q12 | |
| Gene Type | protein-coding | GO ID | GO:0006790 | UniProtAcc | B4DWB0 |
Top |
Malignant transformation analysis |
| Identification of the aberrant gene expression in precancerous and cancerous lesions by comparing the gene expression of stem-like cells in diseased tissues with normal stem cells |
| Entrez ID | Symbol | Replicates | Species | Organ | Tissue | Adj P-value | Log2FC | Malignancy |
| 80224 | NUBPL | HTA11_3410_2000001011 | Human | Colorectum | AD | 1.18e-08 | -4.61e-01 | 0.0155 |
| 80224 | NUBPL | HTA11_696_2000001011 | Human | Colorectum | AD | 1.71e-04 | -3.68e-01 | -0.1464 |
| 80224 | NUBPL | HTA11_5212_2000001011 | Human | Colorectum | AD | 2.36e-03 | -6.33e-01 | -0.2061 |
| 80224 | NUBPL | HTA11_866_3004761011 | Human | Colorectum | AD | 4.80e-03 | -3.80e-01 | 0.096 |
| 80224 | NUBPL | HTA11_99999974143_84620 | Human | Colorectum | MSS | 1.54e-04 | -3.40e-01 | 0.3005 |
| 80224 | NUBPL | A002-C-010 | Human | Colorectum | FAP | 3.61e-02 | 6.87e-02 | 0.242 |
| 80224 | NUBPL | A015-C-203 | Human | Colorectum | FAP | 1.12e-17 | -1.41e-01 | -0.1294 |
| 80224 | NUBPL | A015-C-204 | Human | Colorectum | FAP | 1.23e-03 | -1.23e-01 | -0.0228 |
| 80224 | NUBPL | A014-C-040 | Human | Colorectum | FAP | 2.54e-03 | -7.82e-02 | -0.1184 |
| 80224 | NUBPL | A002-C-201 | Human | Colorectum | FAP | 7.49e-13 | -3.27e-01 | 0.0324 |
| 80224 | NUBPL | A002-C-203 | Human | Colorectum | FAP | 1.21e-02 | 8.64e-02 | 0.2786 |
| 80224 | NUBPL | A001-C-119 | Human | Colorectum | FAP | 2.59e-08 | -3.81e-01 | -0.1557 |
| 80224 | NUBPL | A001-C-108 | Human | Colorectum | FAP | 2.02e-08 | -1.51e-01 | -0.0272 |
| 80224 | NUBPL | A002-C-205 | Human | Colorectum | FAP | 4.39e-22 | -4.62e-01 | -0.1236 |
| 80224 | NUBPL | A015-C-005 | Human | Colorectum | FAP | 6.30e-03 | -1.60e-01 | -0.0336 |
| 80224 | NUBPL | A015-C-006 | Human | Colorectum | FAP | 4.62e-13 | -7.57e-02 | -0.0994 |
| 80224 | NUBPL | A015-C-106 | Human | Colorectum | FAP | 4.86e-08 | -7.27e-02 | -0.0511 |
| 80224 | NUBPL | A002-C-114 | Human | Colorectum | FAP | 3.46e-15 | -1.97e-01 | -0.1561 |
| 80224 | NUBPL | A015-C-104 | Human | Colorectum | FAP | 8.45e-19 | -2.60e-01 | -0.1899 |
| 80224 | NUBPL | A001-C-014 | Human | Colorectum | FAP | 4.07e-08 | -1.27e-01 | 0.0135 |
| Page: 1 2 3 4 5 |
| Tissue | Expression Dynamics | Abbreviation |
| Colorectum (GSE201348) |  | FAP: Familial adenomatous polyposis |
| CRC: Colorectal cancer | ||
| Colorectum (HTA11) |  | AD: Adenomas |
| SER: Sessile serrated lesions | ||
| MSI-H: Microsatellite-high colorectal cancer | ||
| MSS: Microsatellite stable colorectal cancer | ||
| Esophagus |  | ESCC: Esophageal squamous cell carcinoma |
| HGIN: High-grade intraepithelial neoplasias | ||
| LGIN: Low-grade intraepithelial neoplasias | ||
| Liver | 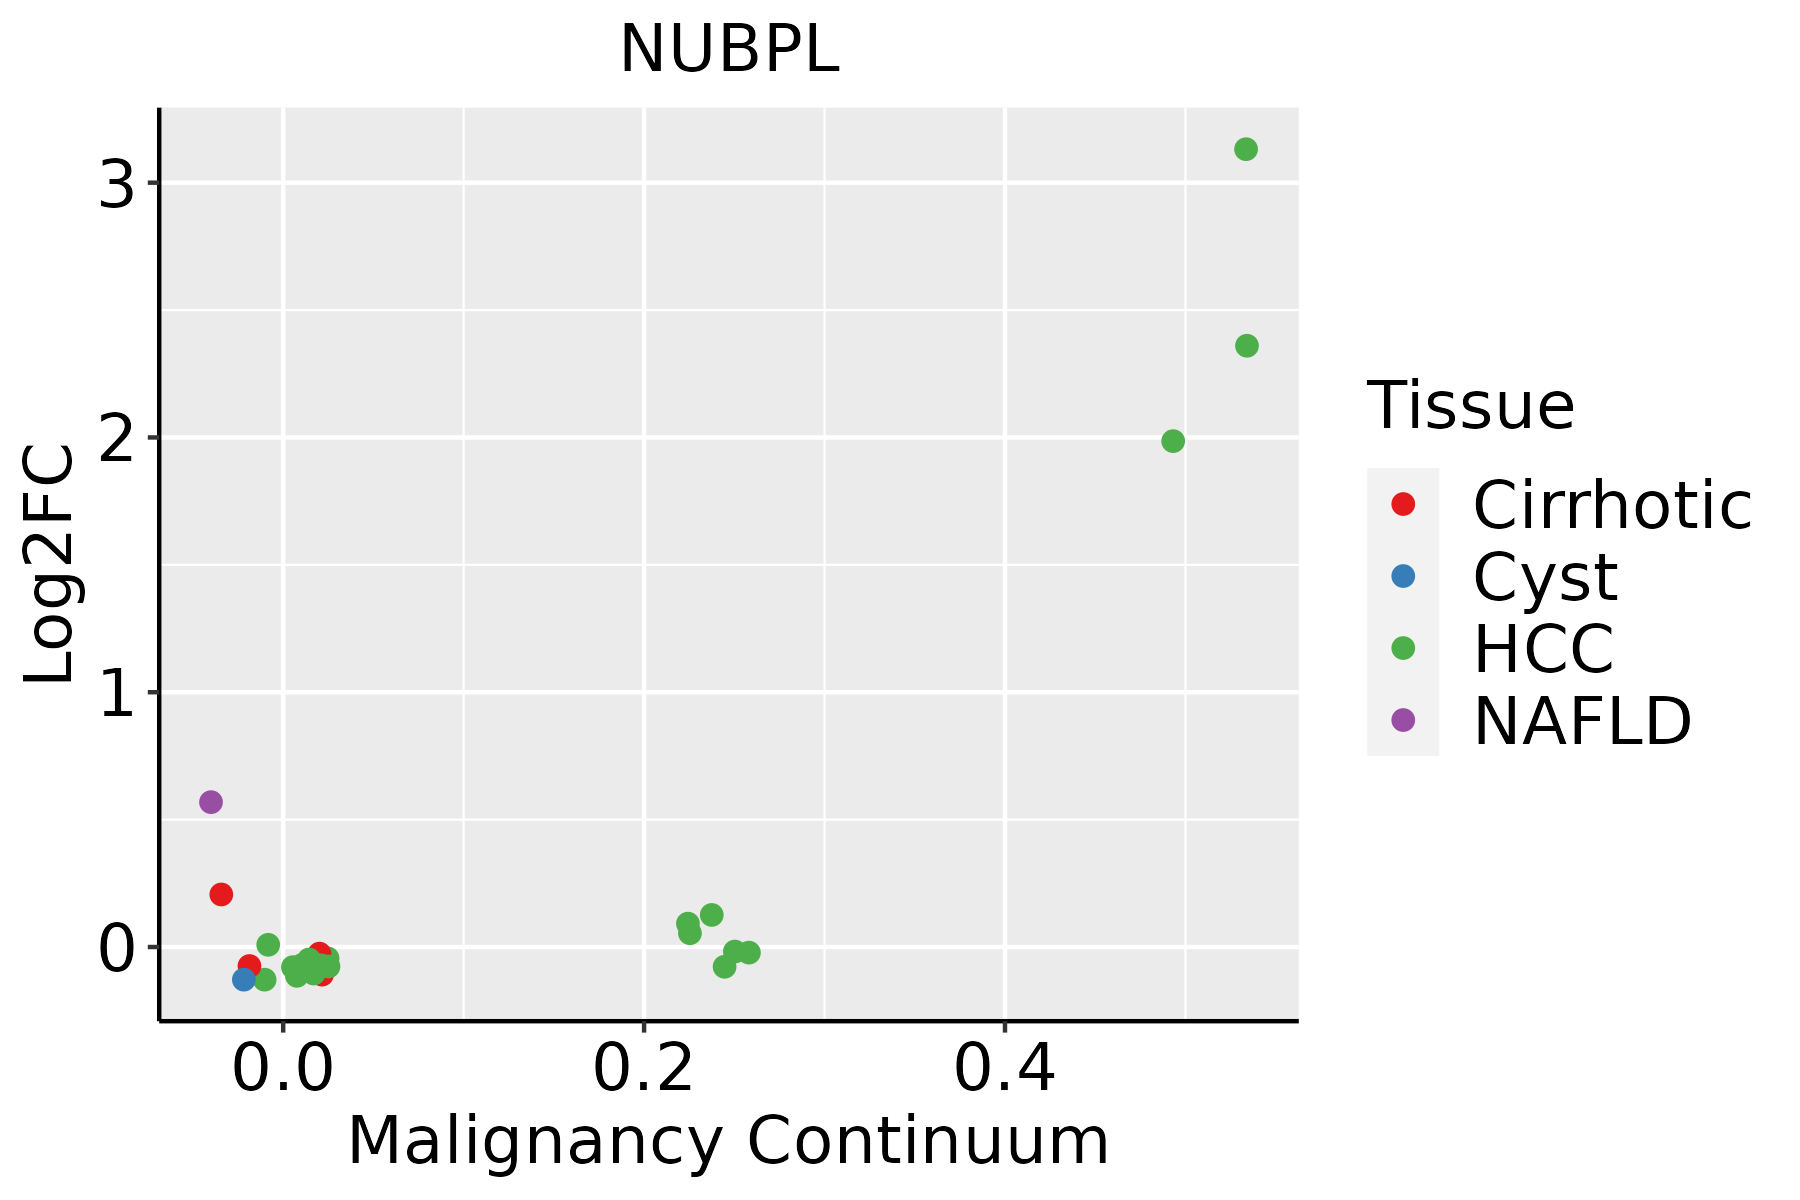 | HCC: Hepatocellular carcinoma |
| NAFLD: Non-alcoholic fatty liver disease | ||
| Lung | 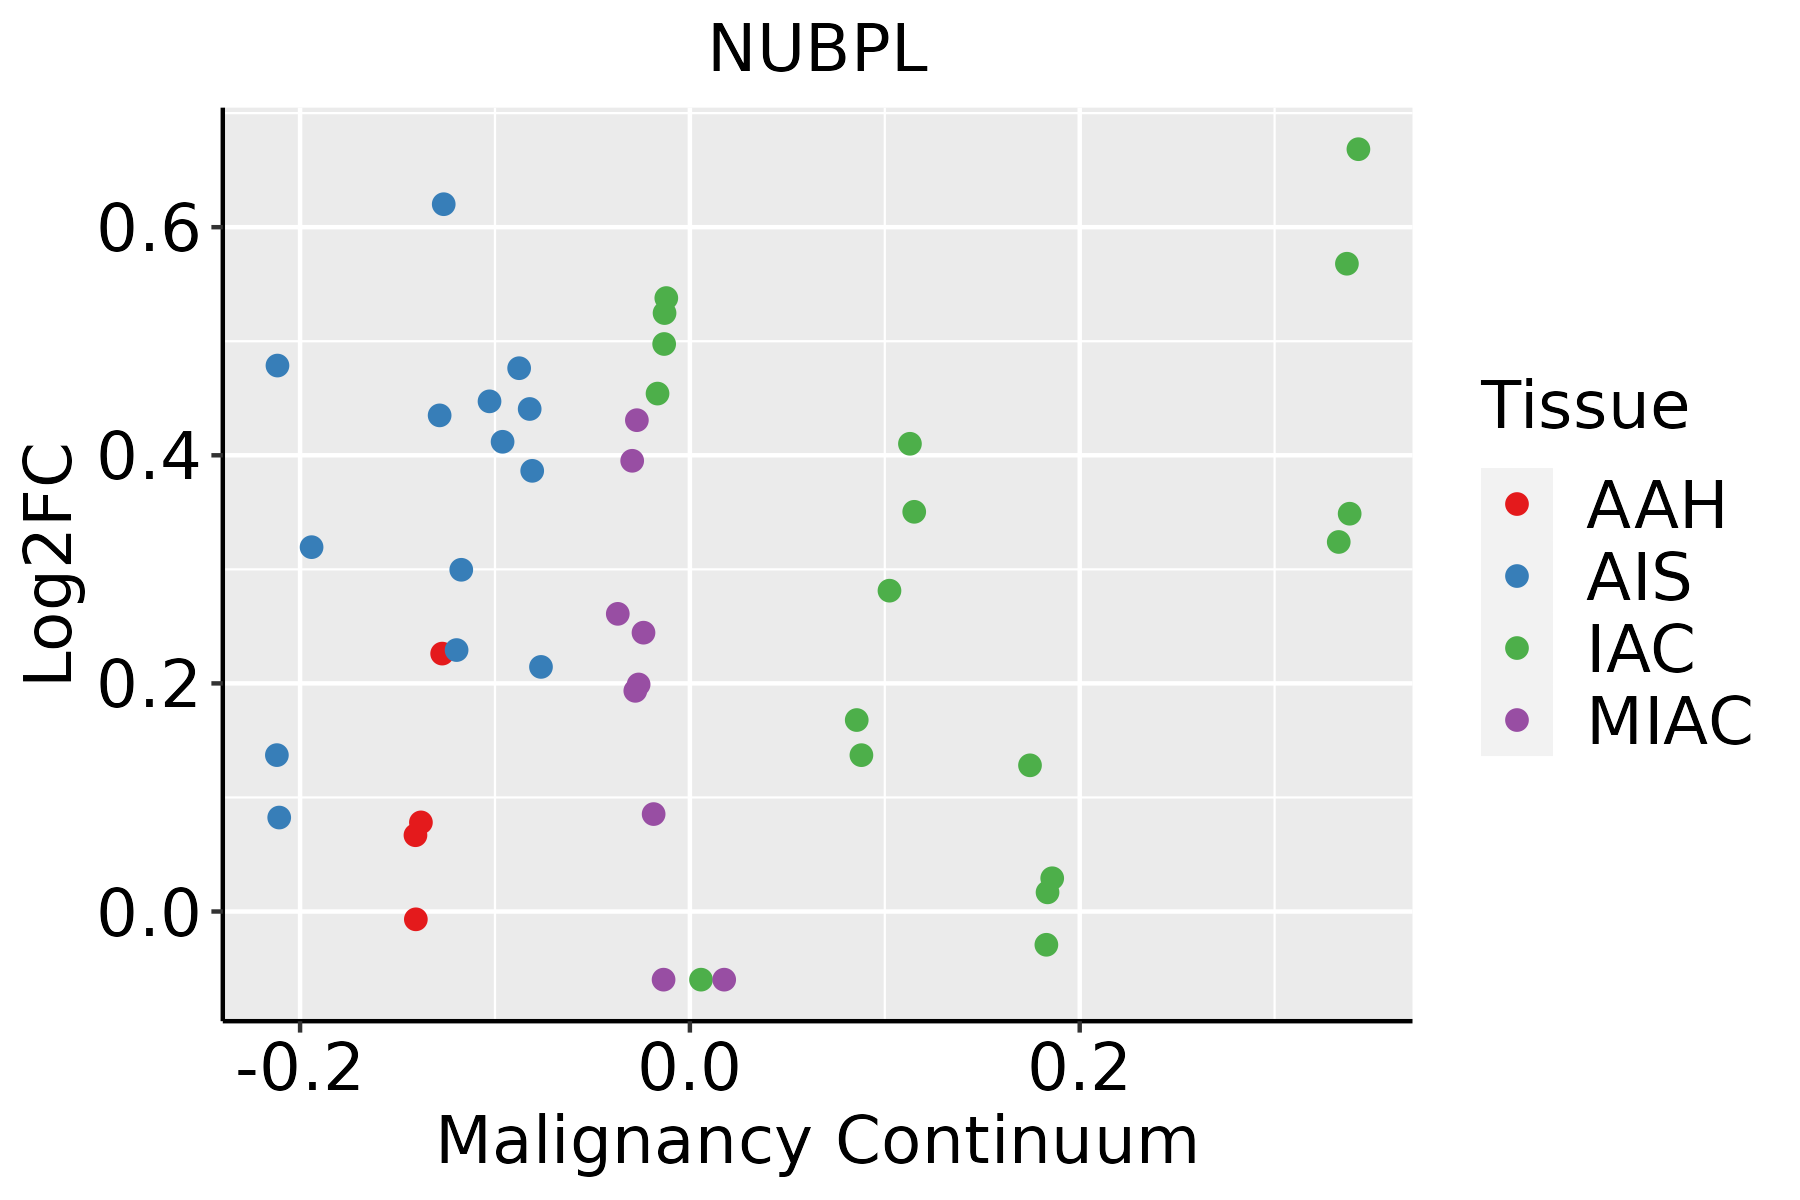 | AAH: Atypical adenomatous hyperplasia |
| AIS: Adenocarcinoma in situ | ||
| IAC: Invasive lung adenocarcinoma | ||
| MIA: Minimally invasive adenocarcinoma |
| ∗log2FC in expression of this searched gene in stem-like cells from each diseased tissue sample relative to stem-like cells in normal samples in each tissue plotted against the malignancy continuum. Samples are colored based on if they are from different disease stage. |
Top |
Malignant transformation related pathway analysis |
| Find out the enriched GO biological processes and KEGG pathways involved in transition from healthy to precancer to cancer |
| Tissue | Disease Stage | Enriched GO biological Processes |
| Colorectum | AD |  |
| Colorectum | SER |  |
| Colorectum | MSS |  |
| Colorectum | MSI-H |  |
| Colorectum | FAP |  |
| ∗Top 15 enriched GO BP terms are showed in the bar plot of each disease state in each tissue. Each row represents a significant GO biological process which is colored according to the -log10(p.adjust). |
| Page: 1 2 3 4 5 6 7 8 9 |
| GO ID | Tissue | Disease Stage | Description | Gene Ratio | Bg Ratio | pvalue | p.adjust | Count |
| GO:003310812 | Liver | HCC | mitochondrial respiratory chain complex assembly | 80/7958 | 93/18723 | 3.47e-18 | 4.15e-16 | 80 |
| GO:000679021 | Liver | HCC | sulfur compound metabolic process | 212/7958 | 339/18723 | 5.60e-14 | 3.39e-12 | 212 |
| GO:001025712 | Liver | HCC | NADH dehydrogenase complex assembly | 50/7958 | 57/18723 | 1.50e-12 | 7.20e-11 | 50 |
| GO:003298112 | Liver | HCC | mitochondrial respiratory chain complex I assembly | 50/7958 | 57/18723 | 1.50e-12 | 7.20e-11 | 50 |
| GO:00705846 | Liver | HCC | mitochondrion morphogenesis | 16/7958 | 21/18723 | 1.82e-03 | 9.37e-03 | 16 |
| GO:0016226 | Liver | HCC | iron-sulfur cluster assembly | 18/7958 | 26/18723 | 5.37e-03 | 2.24e-02 | 18 |
| GO:0031163 | Liver | HCC | metallo-sulfur cluster assembly | 18/7958 | 26/18723 | 5.37e-03 | 2.24e-02 | 18 |
| Page: 1 2 |
| Pathway ID | Tissue | Disease Stage | Description | Gene Ratio | Bg Ratio | pvalue | p.adjust | qvalue | Count |
| Page: 1 |
Top |
Cell-cell communication analysis |
| Identification of potential cell-cell interactions between two cell types and their ligand-receptor pairs for different disease states |
| Ligand | Receptor | LRpair | Pathway | Tissue | Disease Stage |
| Page: 1 |
Top |
Single-cell gene regulatory network inference analysis |
| Find out the significant the regulons (TFs) and the target genes of each regulon across cell types for different disease states |
| TF | Cell Type | Tissue | Disease Stage | Target Gene | RSS | Regulon Activity |
| ∗The dot plots of a searched regulon are shown for all cell subpopulations in each disease state of each tissue based on the regulon specific score inferred using pySCENIC and by calculating the average expression. |
| Page: 1 |
Top |
Somatic mutation of malignant transformation related genes |
| Annotation of somatic variants for genes involved in malignant transformation |
| Hugo Symbol | Variant Class | Variant Classification | dbSNP RS | HGVSc | HGVSp | HGVSp Short | SWISSPROT | BIOTYPE | SIFT | PolyPhen | Tumor Sample Barcode | Tissue | Histology | Sex | Age | Stage | Therapy Types | Drugs | Outcome |
| NUBPL | insertion | In_Frame_Ins | novel | c.676_677insACCATGTTA | p.Arg226delinsHisHisValSer | p.R226delinsHHVS | Q8TB37 | protein_coding | TCGA-A7-A0CJ-01 | Breast | breast invasive carcinoma | Female | <65 | I/II | Chemotherapy | cytoxan | SD | ||
| NUBPL | insertion | In_Frame_Ins | novel | c.678_679insCAGGCTGGTCTTGAACTCCTGACCCCA | p.Arg226_Arg227insGlnAlaGlyLeuGluLeuLeuThrPro | p.R226_R227insQAGLELLTP | Q8TB37 | protein_coding | TCGA-A7-A0CJ-01 | Breast | breast invasive carcinoma | Female | <65 | I/II | Chemotherapy | cytoxan | SD | ||
| NUBPL | SNV | Missense_Mutation | rs781341998 | c.488C>T | p.Ser163Leu | p.S163L | Q8TB37 | protein_coding | deleterious(0) | benign(0.232) | TCGA-C5-A1BL-01 | Cervix | cervical & endocervical cancer | Female | <65 | I/II | Unknown | Unknown | SD |
| NUBPL | SNV | Missense_Mutation | c.316N>A | p.Val106Met | p.V106M | Q8TB37 | protein_coding | deleterious(0) | possibly_damaging(0.549) | TCGA-C5-A7UC-01 | Cervix | cervical & endocervical cancer | Female | <65 | I/II | Unknown | Unknown | SD | |
| NUBPL | SNV | Missense_Mutation | novel | c.717N>C | p.Met239Ile | p.M239I | Q8TB37 | protein_coding | deleterious(0) | probably_damaging(0.999) | TCGA-JW-A5VL-01 | Cervix | cervical & endocervical cancer | Female | <65 | I/II | Unknown | Unknown | SD |
| NUBPL | SNV | Missense_Mutation | c.613N>A | p.Val205Met | p.V205M | Q8TB37 | protein_coding | deleterious(0.01) | probably_damaging(0.973) | TCGA-LP-A4AV-01 | Cervix | cervical & endocervical cancer | Female | <65 | I/II | Unknown | Unknown | SD | |
| NUBPL | SNV | Missense_Mutation | c.805N>C | p.Glu269Gln | p.E269Q | Q8TB37 | protein_coding | tolerated(0.15) | benign(0.003) | TCGA-Q1-A5R2-01 | Cervix | cervical & endocervical cancer | Female | <65 | I/II | Chemotherapy | cisplatin | PR | |
| NUBPL | SNV | Missense_Mutation | novel | c.680G>C | p.Arg227Thr | p.R227T | Q8TB37 | protein_coding | deleterious(0) | benign(0.003) | TCGA-UC-A7PI-01 | Cervix | cervical & endocervical cancer | Female | <65 | I/II | Unknown | Unknown | PD |
| NUBPL | SNV | Missense_Mutation | rs749762773 | c.640N>A | p.Ala214Thr | p.A214T | Q8TB37 | protein_coding | deleterious(0) | probably_damaging(0.992) | TCGA-A6-2680-01 | Colorectum | colon adenocarcinoma | Female | >=65 | I/II | Unknown | Unknown | SD |
| NUBPL | SNV | Missense_Mutation | rs776389264 | c.281C>T | p.Ala94Val | p.A94V | Q8TB37 | protein_coding | tolerated(0.06) | benign(0.391) | TCGA-AZ-4313-01 | Colorectum | colon adenocarcinoma | Female | <65 | I/II | Unknown | Unknown | SD |
| Page: 1 2 3 |
Top |
Related drugs of malignant transformation related genes |
| Identification of chemicals and drugs interact with genes involved in malignant transfromation |
| (DGIdb 4.0) |
| Entrez ID | Symbol | Category | Interaction Types | Drug Claim Name | Drug Name | PMIDs |
| 80224 | NUBPL | NA | iloperidone | ILOPERIDONE | 18521091 |
| Page: 1 |

Copyright 2023-Present -The University of Texas Health Science Center at Houston |