
|
|||||
|
 | |
| |
| |
| |
| |
| |
|
Gene: NT5C3A |
Gene summary for NT5C3A |
| Gene information | Species | Human | Gene symbol | NT5C3A | Gene ID | 51251 |
| Gene name | 5'-nucleotidase, cytosolic IIIA | |
| Gene Alias | NT5C3 | |
| Cytomap | 7p14.3 | |
| Gene Type | protein-coding | GO ID | GO:0002376 | UniProtAcc | A0A024RA81 |
Top |
Malignant transformation analysis |
| Identification of the aberrant gene expression in precancerous and cancerous lesions by comparing the gene expression of stem-like cells in diseased tissues with normal stem cells |
| Entrez ID | Symbol | Replicates | Species | Organ | Tissue | Adj P-value | Log2FC | Malignancy |
| 51251 | NT5C3A | LZE4T | Human | Esophagus | ESCC | 5.56e-08 | 4.74e-01 | 0.0811 |
| 51251 | NT5C3A | LZE5T | Human | Esophagus | ESCC | 4.89e-04 | 2.63e-01 | 0.0514 |
| 51251 | NT5C3A | LZE7T | Human | Esophagus | ESCC | 5.79e-10 | 5.34e-01 | 0.0667 |
| 51251 | NT5C3A | LZE8T | Human | Esophagus | ESCC | 4.09e-08 | 4.07e-01 | 0.067 |
| 51251 | NT5C3A | LZE20T | Human | Esophagus | ESCC | 3.51e-14 | 3.90e-01 | 0.0662 |
| 51251 | NT5C3A | LZE22T | Human | Esophagus | ESCC | 1.79e-06 | 4.52e-01 | 0.068 |
| 51251 | NT5C3A | LZE24D1 | Human | Esophagus | HGIN | 1.29e-02 | 4.07e-01 | 0.054 |
| 51251 | NT5C3A | LZE24T | Human | Esophagus | ESCC | 6.04e-18 | 7.41e-01 | 0.0596 |
| 51251 | NT5C3A | LZE21T | Human | Esophagus | ESCC | 1.12e-07 | 3.31e-01 | 0.0655 |
| 51251 | NT5C3A | LZE6T | Human | Esophagus | ESCC | 1.13e-06 | 5.07e-01 | 0.0845 |
| 51251 | NT5C3A | P1T-E | Human | Esophagus | ESCC | 3.96e-07 | 6.36e-01 | 0.0875 |
| 51251 | NT5C3A | P2T-E | Human | Esophagus | ESCC | 2.40e-34 | 7.32e-01 | 0.1177 |
| 51251 | NT5C3A | P4T-E | Human | Esophagus | ESCC | 3.45e-24 | 8.26e-01 | 0.1323 |
| 51251 | NT5C3A | P5T-E | Human | Esophagus | ESCC | 1.22e-21 | 2.66e-01 | 0.1327 |
| 51251 | NT5C3A | P8T-E | Human | Esophagus | ESCC | 3.08e-25 | 4.88e-01 | 0.0889 |
| 51251 | NT5C3A | P9T-E | Human | Esophagus | ESCC | 7.90e-21 | 6.22e-01 | 0.1131 |
| 51251 | NT5C3A | P10T-E | Human | Esophagus | ESCC | 1.43e-45 | 7.19e-01 | 0.116 |
| 51251 | NT5C3A | P11T-E | Human | Esophagus | ESCC | 2.00e-19 | 1.08e+00 | 0.1426 |
| 51251 | NT5C3A | P12T-E | Human | Esophagus | ESCC | 3.46e-30 | 6.42e-01 | 0.1122 |
| 51251 | NT5C3A | P15T-E | Human | Esophagus | ESCC | 2.26e-34 | 8.60e-01 | 0.1149 |
| Page: 1 2 3 4 5 6 |
| Tissue | Expression Dynamics | Abbreviation |
| Esophagus | 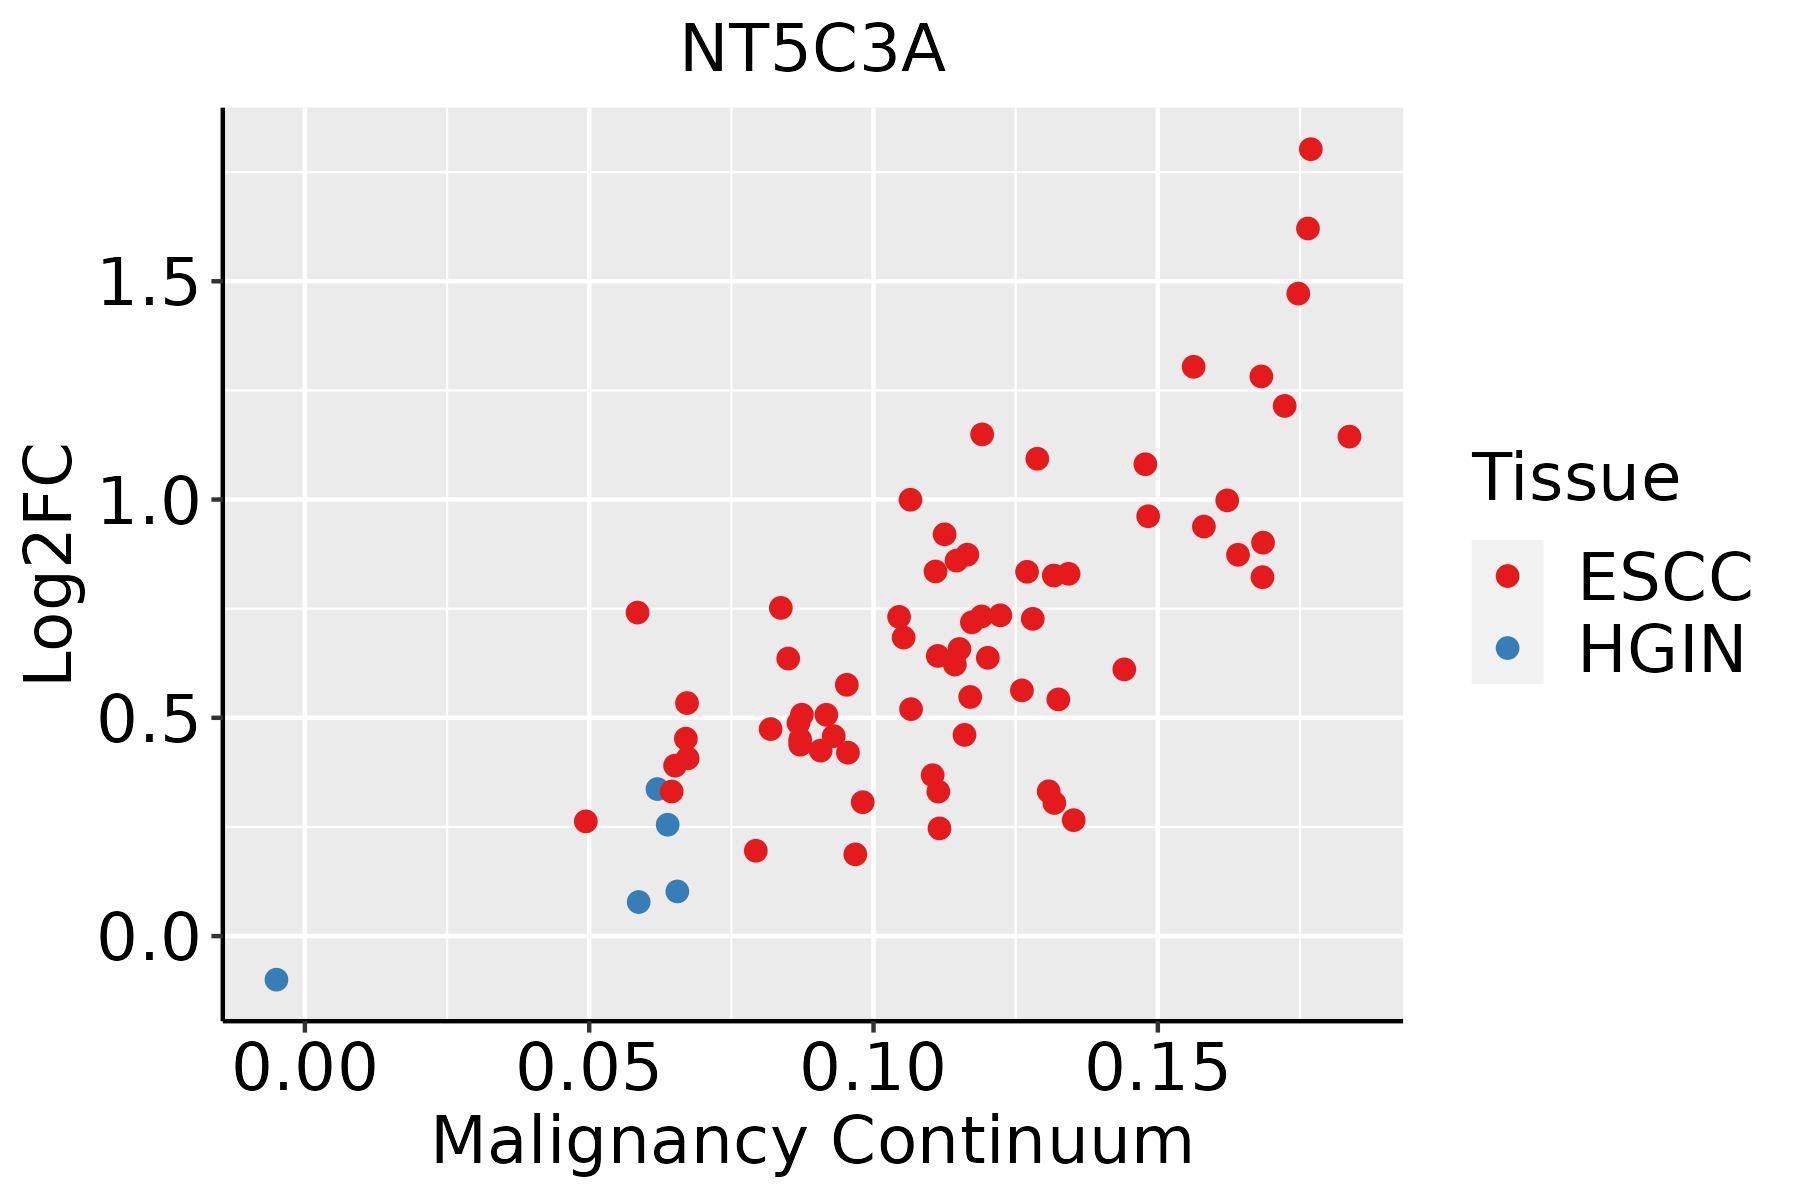 | ESCC: Esophageal squamous cell carcinoma |
| HGIN: High-grade intraepithelial neoplasias | ||
| LGIN: Low-grade intraepithelial neoplasias | ||
| Liver |  | HCC: Hepatocellular carcinoma |
| NAFLD: Non-alcoholic fatty liver disease | ||
| Oral Cavity | 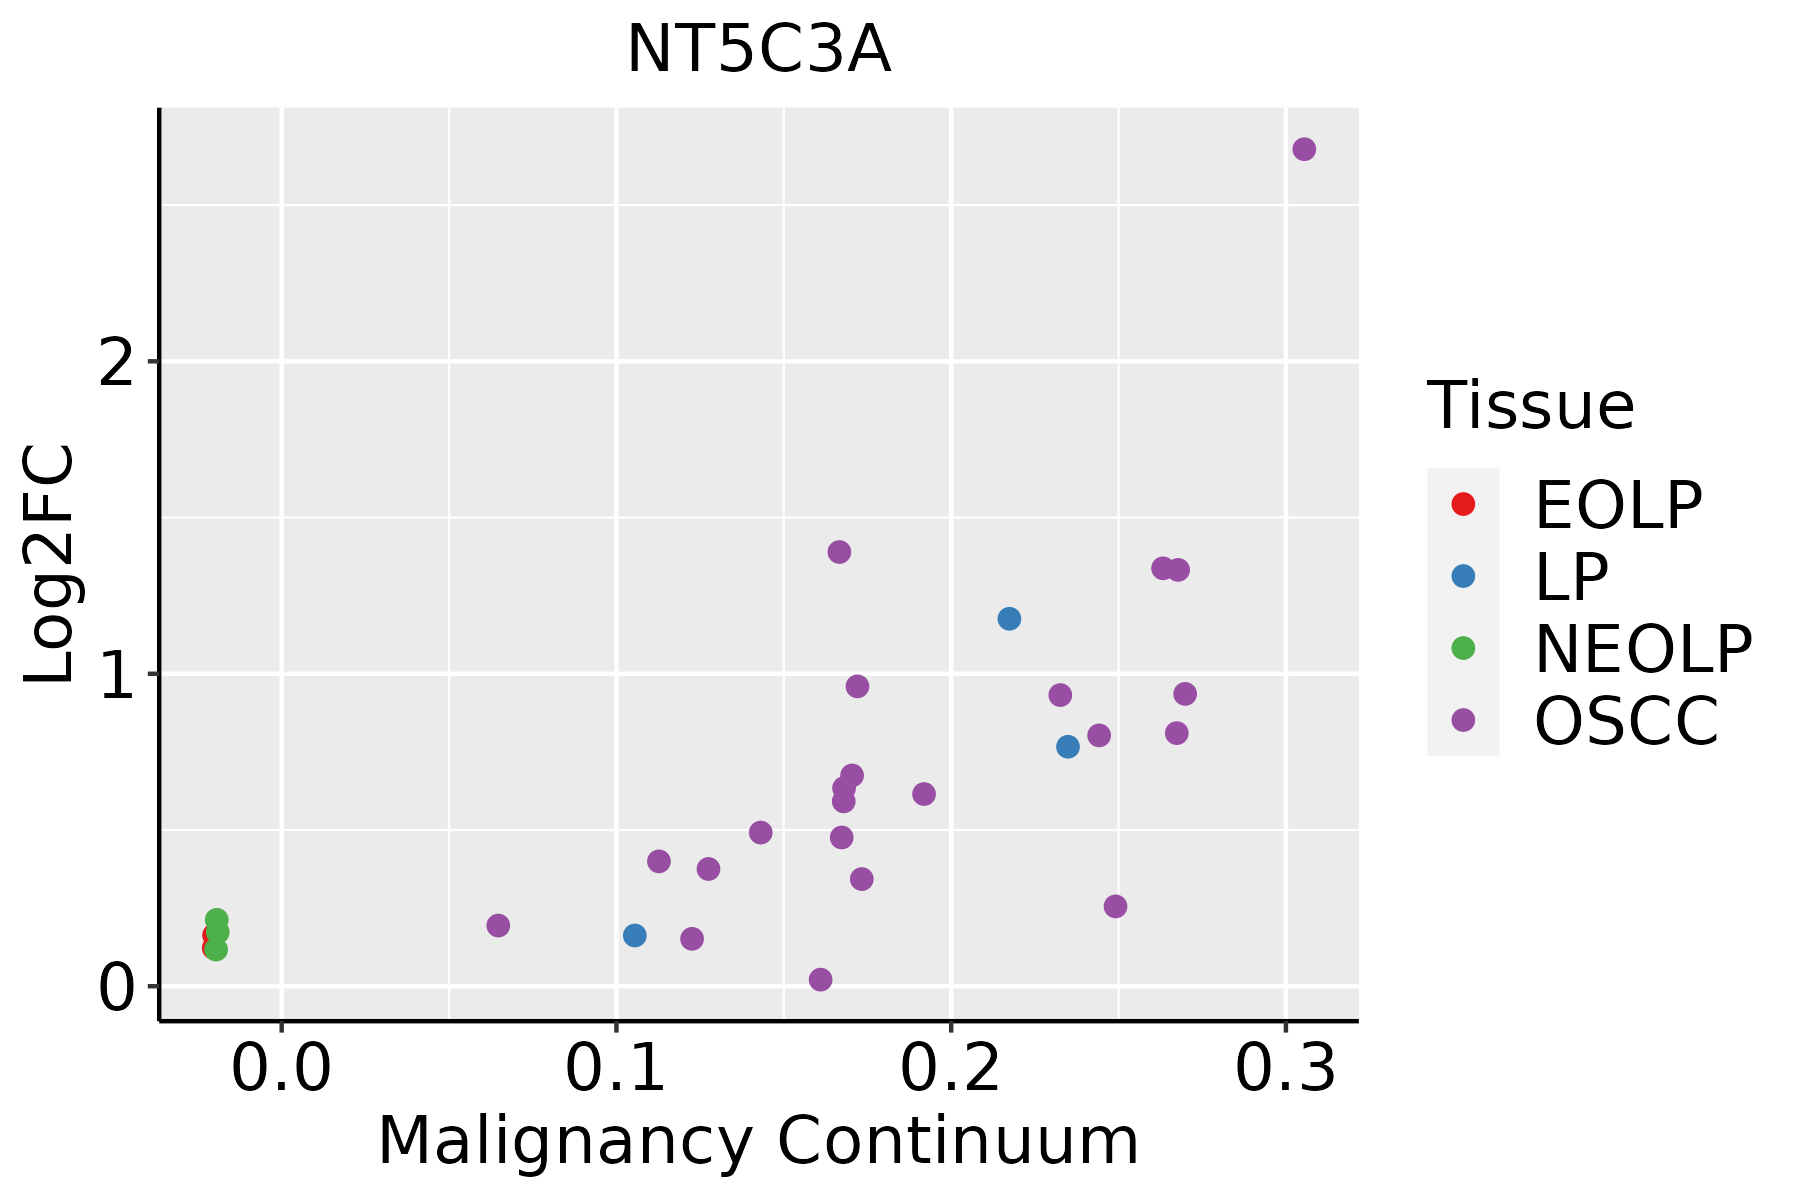 | EOLP: Erosive Oral lichen planus |
| LP: leukoplakia | ||
| NEOLP: Non-erosive oral lichen planus | ||
| OSCC: Oral squamous cell carcinoma | ||
| Skin | 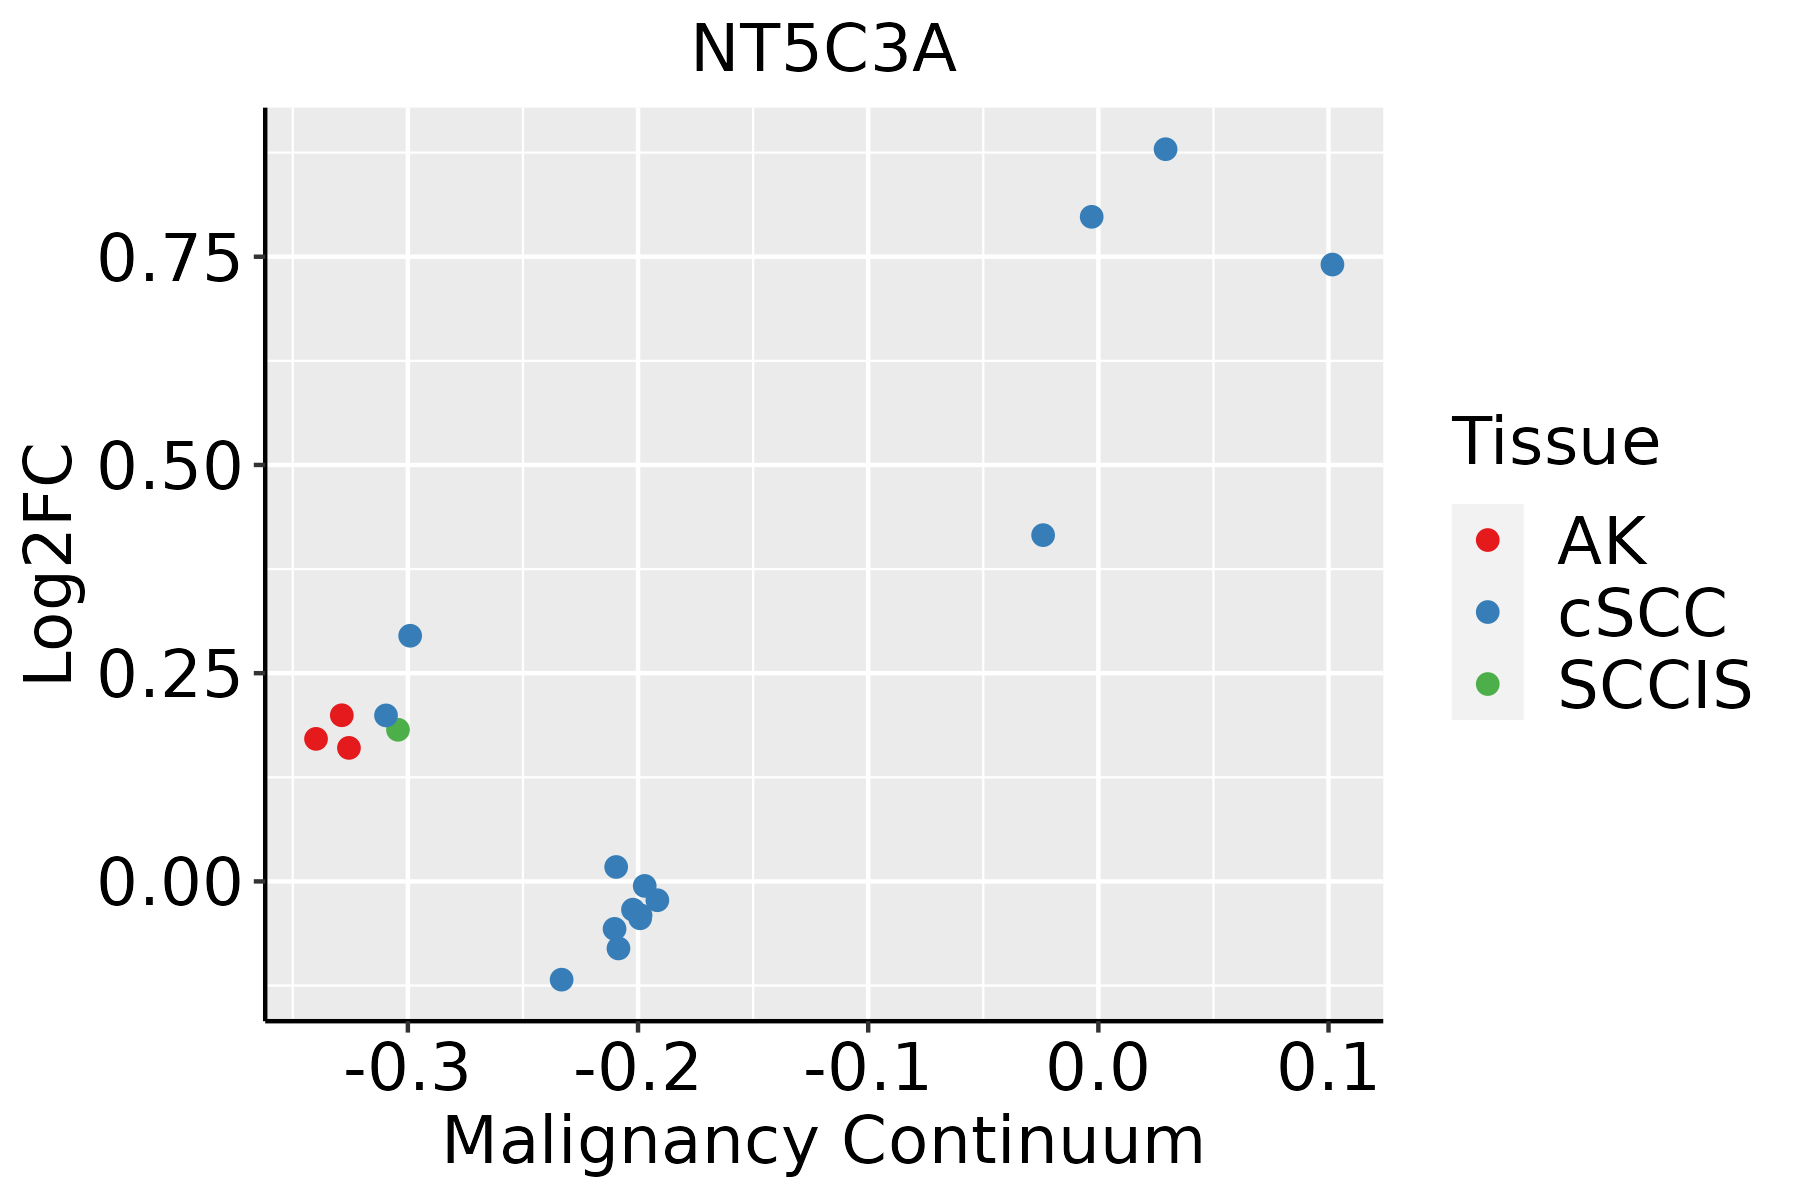 | AK: Actinic keratosis |
| cSCC: Cutaneous squamous cell carcinoma | ||
| SCCIS:squamous cell carcinoma in situ | ||
| Thyroid |  | ATC: Anaplastic thyroid cancer |
| HT: Hashimoto's thyroiditis | ||
| PTC: Papillary thyroid cancer |
| ∗log2FC in expression of this searched gene in stem-like cells from each diseased tissue sample relative to stem-like cells in normal samples in each tissue plotted against the malignancy continuum. Samples are colored based on if they are from different disease stage. |
Top |
Malignant transformation related pathway analysis |
| Find out the enriched GO biological processes and KEGG pathways involved in transition from healthy to precancer to cancer |
| Tissue | Disease Stage | Enriched GO biological Processes |
| Colorectum | AD |  |
| Colorectum | SER |  |
| Colorectum | MSS |  |
| Colorectum | MSI-H |  |
| Colorectum | FAP |  |
| ∗Top 15 enriched GO BP terms are showed in the bar plot of each disease state in each tissue. Each row represents a significant GO biological process which is colored according to the -log10(p.adjust). |
| Page: 1 2 3 4 5 6 7 8 9 |
| GO ID | Tissue | Disease Stage | Description | Gene Ratio | Bg Ratio | pvalue | p.adjust | Count |
| GO:000961511 | Liver | HCC | response to virus | 210/7958 | 367/18723 | 7.32e-09 | 1.86e-07 | 210 |
| GO:001631121 | Liver | HCC | dephosphorylation | 230/7958 | 417/18723 | 1.00e-07 | 1.96e-06 | 230 |
| GO:00516071 | Liver | HCC | defense response to virus | 151/7958 | 265/18723 | 1.27e-06 | 1.85e-05 | 151 |
| GO:01405461 | Liver | HCC | defense response to symbiont | 151/7958 | 265/18723 | 1.27e-06 | 1.85e-05 | 151 |
| GO:19016571 | Liver | HCC | glycosyl compound metabolic process | 55/7958 | 88/18723 | 1.20e-04 | 1.01e-03 | 55 |
| GO:00725271 | Liver | HCC | pyrimidine-containing compound metabolic process | 49/7958 | 82/18723 | 1.20e-03 | 6.68e-03 | 49 |
| GO:00091161 | Liver | HCC | nucleoside metabolic process | 37/7958 | 62/18723 | 4.73e-03 | 2.02e-02 | 37 |
| GO:000961515 | Oral cavity | OSCC | response to virus | 215/7305 | 367/18723 | 1.63e-14 | 9.41e-13 | 215 |
| GO:00516074 | Oral cavity | OSCC | defense response to virus | 154/7305 | 265/18723 | 1.96e-10 | 5.63e-09 | 154 |
| GO:01405464 | Oral cavity | OSCC | defense response to symbiont | 154/7305 | 265/18723 | 1.96e-10 | 5.63e-09 | 154 |
| GO:00163119 | Oral cavity | OSCC | dephosphorylation | 220/7305 | 417/18723 | 6.33e-09 | 1.34e-07 | 220 |
| GO:000675318 | Oral cavity | OSCC | nucleoside phosphate metabolic process | 247/7305 | 497/18723 | 6.28e-07 | 8.96e-06 | 247 |
| GO:000911719 | Oral cavity | OSCC | nucleotide metabolic process | 243/7305 | 489/18723 | 7.80e-07 | 1.09e-05 | 243 |
| GO:19016573 | Oral cavity | OSCC | glycosyl compound metabolic process | 52/7305 | 88/18723 | 1.06e-04 | 7.84e-04 | 52 |
| GO:00091162 | Oral cavity | OSCC | nucleoside metabolic process | 37/7305 | 62/18723 | 7.79e-04 | 4.23e-03 | 37 |
| GO:00725272 | Oral cavity | OSCC | pyrimidine-containing compound metabolic process | 44/7305 | 82/18723 | 4.95e-03 | 1.94e-02 | 44 |
| GO:000961516 | Oral cavity | LP | response to virus | 143/4623 | 367/18723 | 7.42e-10 | 3.52e-08 | 143 |
| GO:190165711 | Oral cavity | LP | glycosyl compound metabolic process | 43/4623 | 88/18723 | 7.80e-07 | 2.05e-05 | 43 |
| GO:005160711 | Oral cavity | LP | defense response to virus | 97/4623 | 265/18723 | 9.31e-06 | 1.74e-04 | 97 |
| GO:014054611 | Oral cavity | LP | defense response to symbiont | 97/4623 | 265/18723 | 9.31e-06 | 1.74e-04 | 97 |
| Page: 1 2 3 4 |
| Pathway ID | Tissue | Disease Stage | Description | Gene Ratio | Bg Ratio | pvalue | p.adjust | qvalue | Count |
| hsa012325 | Esophagus | ESCC | Nucleotide metabolism | 59/4205 | 85/8465 | 1.67e-04 | 6.58e-04 | 3.37e-04 | 59 |
| hsa002405 | Esophagus | ESCC | Pyrimidine metabolism | 41/4205 | 58/8465 | 9.14e-04 | 2.92e-03 | 1.49e-03 | 41 |
| hsa0123212 | Esophagus | ESCC | Nucleotide metabolism | 59/4205 | 85/8465 | 1.67e-04 | 6.58e-04 | 3.37e-04 | 59 |
| hsa0024012 | Esophagus | ESCC | Pyrimidine metabolism | 41/4205 | 58/8465 | 9.14e-04 | 2.92e-03 | 1.49e-03 | 41 |
| hsa01232 | Liver | Cirrhotic | Nucleotide metabolism | 39/2530 | 85/8465 | 1.27e-03 | 6.73e-03 | 4.15e-03 | 39 |
| hsa00240 | Liver | Cirrhotic | Pyrimidine metabolism | 27/2530 | 58/8465 | 5.31e-03 | 1.88e-02 | 1.16e-02 | 27 |
| hsa012321 | Liver | Cirrhotic | Nucleotide metabolism | 39/2530 | 85/8465 | 1.27e-03 | 6.73e-03 | 4.15e-03 | 39 |
| hsa002401 | Liver | Cirrhotic | Pyrimidine metabolism | 27/2530 | 58/8465 | 5.31e-03 | 1.88e-02 | 1.16e-02 | 27 |
| hsa002402 | Liver | HCC | Pyrimidine metabolism | 44/4020 | 58/8465 | 9.34e-06 | 7.11e-05 | 3.95e-05 | 44 |
| hsa012322 | Liver | HCC | Nucleotide metabolism | 59/4020 | 85/8465 | 3.30e-05 | 1.88e-04 | 1.04e-04 | 59 |
| hsa002403 | Liver | HCC | Pyrimidine metabolism | 44/4020 | 58/8465 | 9.34e-06 | 7.11e-05 | 3.95e-05 | 44 |
| hsa012323 | Liver | HCC | Nucleotide metabolism | 59/4020 | 85/8465 | 3.30e-05 | 1.88e-04 | 1.04e-04 | 59 |
| hsa012324 | Oral cavity | OSCC | Nucleotide metabolism | 54/3704 | 85/8465 | 1.78e-04 | 5.95e-04 | 3.03e-04 | 54 |
| hsa002404 | Oral cavity | OSCC | Pyrimidine metabolism | 37/3704 | 58/8465 | 1.62e-03 | 4.45e-03 | 2.26e-03 | 37 |
| hsa0123211 | Oral cavity | OSCC | Nucleotide metabolism | 54/3704 | 85/8465 | 1.78e-04 | 5.95e-04 | 3.03e-04 | 54 |
| hsa0024011 | Oral cavity | OSCC | Pyrimidine metabolism | 37/3704 | 58/8465 | 1.62e-03 | 4.45e-03 | 2.26e-03 | 37 |
| hsa0123221 | Oral cavity | LP | Nucleotide metabolism | 42/2418 | 85/8465 | 3.62e-05 | 2.36e-04 | 1.52e-04 | 42 |
| hsa0024021 | Oral cavity | LP | Pyrimidine metabolism | 28/2418 | 58/8465 | 1.12e-03 | 5.02e-03 | 3.24e-03 | 28 |
| hsa0123231 | Oral cavity | LP | Nucleotide metabolism | 42/2418 | 85/8465 | 3.62e-05 | 2.36e-04 | 1.52e-04 | 42 |
| hsa0024031 | Oral cavity | LP | Pyrimidine metabolism | 28/2418 | 58/8465 | 1.12e-03 | 5.02e-03 | 3.24e-03 | 28 |
| Page: 1 |
Top |
Cell-cell communication analysis |
| Identification of potential cell-cell interactions between two cell types and their ligand-receptor pairs for different disease states |
| Ligand | Receptor | LRpair | Pathway | Tissue | Disease Stage |
| Page: 1 |
Top |
Single-cell gene regulatory network inference analysis |
| Find out the significant the regulons (TFs) and the target genes of each regulon across cell types for different disease states |
| TF | Cell Type | Tissue | Disease Stage | Target Gene | RSS | Regulon Activity |
| ∗The dot plots of a searched regulon are shown for all cell subpopulations in each disease state of each tissue based on the regulon specific score inferred using pySCENIC and by calculating the average expression. |
| Page: 1 |
Top |
Somatic mutation of malignant transformation related genes |
| Annotation of somatic variants for genes involved in malignant transformation |
| Hugo Symbol | Variant Class | Variant Classification | dbSNP RS | HGVSc | HGVSp | HGVSp Short | SWISSPROT | BIOTYPE | SIFT | PolyPhen | Tumor Sample Barcode | Tissue | Histology | Sex | Age | Stage | Therapy Types | Drugs | Outcome |
| NT5C3A | SNV | Missense_Mutation | rs751646719 | c.760N>T | p.Asp254Tyr | p.D254Y | Q9H0P0 | protein_coding | deleterious(0.01) | probably_damaging(0.991) | TCGA-AC-A23H-01 | Breast | breast invasive carcinoma | Female | >=65 | I/II | Unknown | Unknown | PD |
| NT5C3A | SNV | Missense_Mutation | c.913G>A | p.Asp305Asn | p.D305N | Q9H0P0 | protein_coding | deleterious(0) | possibly_damaging(0.635) | TCGA-AA-3492-01 | Colorectum | colon adenocarcinoma | Female | >=65 | I/II | Unknown | Unknown | SD | |
| NT5C3A | SNV | Missense_Mutation | c.356N>G | p.Glu119Gly | p.E119G | Q9H0P0 | protein_coding | tolerated(0.11) | possibly_damaging(0.797) | TCGA-AA-3663-01 | Colorectum | colon adenocarcinoma | Male | <65 | I/II | Unknown | Unknown | SD | |
| NT5C3A | SNV | Missense_Mutation | rs772942875 | c.397N>A | p.Ala133Thr | p.A133T | Q9H0P0 | protein_coding | deleterious(0) | possibly_damaging(0.644) | TCGA-AA-3855-01 | Colorectum | colon adenocarcinoma | Male | >=65 | I/II | Unknown | Unknown | SD |
| NT5C3A | SNV | Missense_Mutation | c.742C>A | p.His248Asn | p.H248N | Q9H0P0 | protein_coding | deleterious(0) | probably_damaging(0.999) | TCGA-AA-3977-01 | Colorectum | colon adenocarcinoma | Male | >=65 | I/II | Unknown | Unknown | SD | |
| NT5C3A | SNV | Missense_Mutation | novel | c.831C>A | p.Asp277Glu | p.D277E | Q9H0P0 | protein_coding | deleterious(0) | possibly_damaging(0.808) | TCGA-CA-6717-01 | Colorectum | colon adenocarcinoma | Male | <65 | I/II | Chemotherapy | oxaliplatin | CR |
| NT5C3A | SNV | Missense_Mutation | c.787N>G | p.Phe263Val | p.F263V | Q9H0P0 | protein_coding | deleterious(0) | possibly_damaging(0.84) | TCGA-CA-6718-01 | Colorectum | colon adenocarcinoma | Male | <65 | I/II | Unknown | Unknown | PD | |
| NT5C3A | insertion | Frame_Shift_Ins | novel | c.709-1_709insATTTTGATGAAACT | p.Gly237IlefsTer15 | p.G237Ifs*15 | Q9H0P0 | protein_coding | TCGA-SS-A7HO-01 | Colorectum | colon adenocarcinoma | Female | <65 | I/II | Chemotherapy | oxaliplatin | PD | ||
| NT5C3A | SNV | Missense_Mutation | c.518N>G | p.Ile173Ser | p.I173S | Q9H0P0 | protein_coding | tolerated(0.07) | possibly_damaging(0.462) | TCGA-A5-A0GP-01 | Endometrium | uterine corpus endometrioid carcinoma | Female | <65 | I/II | Unknown | Unknown | SD | |
| NT5C3A | SNV | Missense_Mutation | novel | c.281N>A | p.Ser94Asn | p.S94N | Q9H0P0 | protein_coding | deleterious(0) | probably_damaging(0.993) | TCGA-AJ-A2QK-01 | Endometrium | uterine corpus endometrioid carcinoma | Female | >=65 | I/II | Chemotherapy | carboplatin | SD |
| Page: 1 2 3 |
Top |
Related drugs of malignant transformation related genes |
| Identification of chemicals and drugs interact with genes involved in malignant transfromation |
| (DGIdb 4.0) |
| Entrez ID | Symbol | Category | Interaction Types | Drug Claim Name | Drug Name | PMIDs |
| 51251 | NT5C3A | ENZYME | cytarabine | CYTARABINE | 25000516 | |
| 51251 | NT5C3A | ENZYME | idarubicin | IDARUBICIN | 25000516 | |
| 51251 | NT5C3A | ENZYME | gemcitabine | GEMCITABINE | 22838949 |
| Page: 1 |

Copyright 2023-Present -The University of Texas Health Science Center at Houston |