
|
|||||
|
 | |
| |
| |
| |
| |
| |
|
Gene: NSL1 |
Gene summary for NSL1 |
| Gene information | Species | Human | Gene symbol | NSL1 | Gene ID | 25936 |
| Gene name | NSL1 component of MIS12 kinetochore complex | |
| Gene Alias | C1orf48 | |
| Cytomap | 1q32.3 | |
| Gene Type | protein-coding | GO ID | GO:0000070 | UniProtAcc | Q96IY1 |
Top |
Malignant transformation analysis |
| Identification of the aberrant gene expression in precancerous and cancerous lesions by comparing the gene expression of stem-like cells in diseased tissues with normal stem cells |
| Entrez ID | Symbol | Replicates | Species | Organ | Tissue | Adj P-value | Log2FC | Malignancy |
| 25936 | NSL1 | LZE2T | Human | Esophagus | ESCC | 6.89e-07 | 7.35e-01 | 0.082 |
| 25936 | NSL1 | LZE4T | Human | Esophagus | ESCC | 4.11e-17 | 4.95e-01 | 0.0811 |
| 25936 | NSL1 | LZE7T | Human | Esophagus | ESCC | 3.88e-07 | 5.49e-01 | 0.0667 |
| 25936 | NSL1 | LZE8T | Human | Esophagus | ESCC | 3.49e-08 | 2.94e-01 | 0.067 |
| 25936 | NSL1 | LZE20T | Human | Esophagus | ESCC | 1.44e-07 | 2.18e-01 | 0.0662 |
| 25936 | NSL1 | LZE22T | Human | Esophagus | ESCC | 1.58e-07 | 5.65e-01 | 0.068 |
| 25936 | NSL1 | LZE24T | Human | Esophagus | ESCC | 2.65e-18 | 4.58e-01 | 0.0596 |
| 25936 | NSL1 | LZE21T | Human | Esophagus | ESCC | 1.61e-08 | 5.42e-01 | 0.0655 |
| 25936 | NSL1 | LZE6T | Human | Esophagus | ESCC | 4.91e-09 | 3.40e-01 | 0.0845 |
| 25936 | NSL1 | P1T-E | Human | Esophagus | ESCC | 2.21e-09 | 5.27e-01 | 0.0875 |
| 25936 | NSL1 | P2T-E | Human | Esophagus | ESCC | 2.10e-67 | 1.01e+00 | 0.1177 |
| 25936 | NSL1 | P4T-E | Human | Esophagus | ESCC | 1.59e-23 | 6.01e-01 | 0.1323 |
| 25936 | NSL1 | P5T-E | Human | Esophagus | ESCC | 8.96e-29 | 5.41e-01 | 0.1327 |
| 25936 | NSL1 | P8T-E | Human | Esophagus | ESCC | 2.81e-30 | 5.12e-01 | 0.0889 |
| 25936 | NSL1 | P9T-E | Human | Esophagus | ESCC | 4.57e-19 | 4.47e-01 | 0.1131 |
| 25936 | NSL1 | P10T-E | Human | Esophagus | ESCC | 1.40e-40 | 6.50e-01 | 0.116 |
| 25936 | NSL1 | P11T-E | Human | Esophagus | ESCC | 8.33e-26 | 6.42e-01 | 0.1426 |
| 25936 | NSL1 | P12T-E | Human | Esophagus | ESCC | 8.48e-35 | 5.23e-01 | 0.1122 |
| 25936 | NSL1 | P15T-E | Human | Esophagus | ESCC | 4.22e-23 | 5.01e-01 | 0.1149 |
| 25936 | NSL1 | P16T-E | Human | Esophagus | ESCC | 1.76e-46 | 7.75e-01 | 0.1153 |
| Page: 1 2 3 4 5 |
| Tissue | Expression Dynamics | Abbreviation |
| Esophagus | 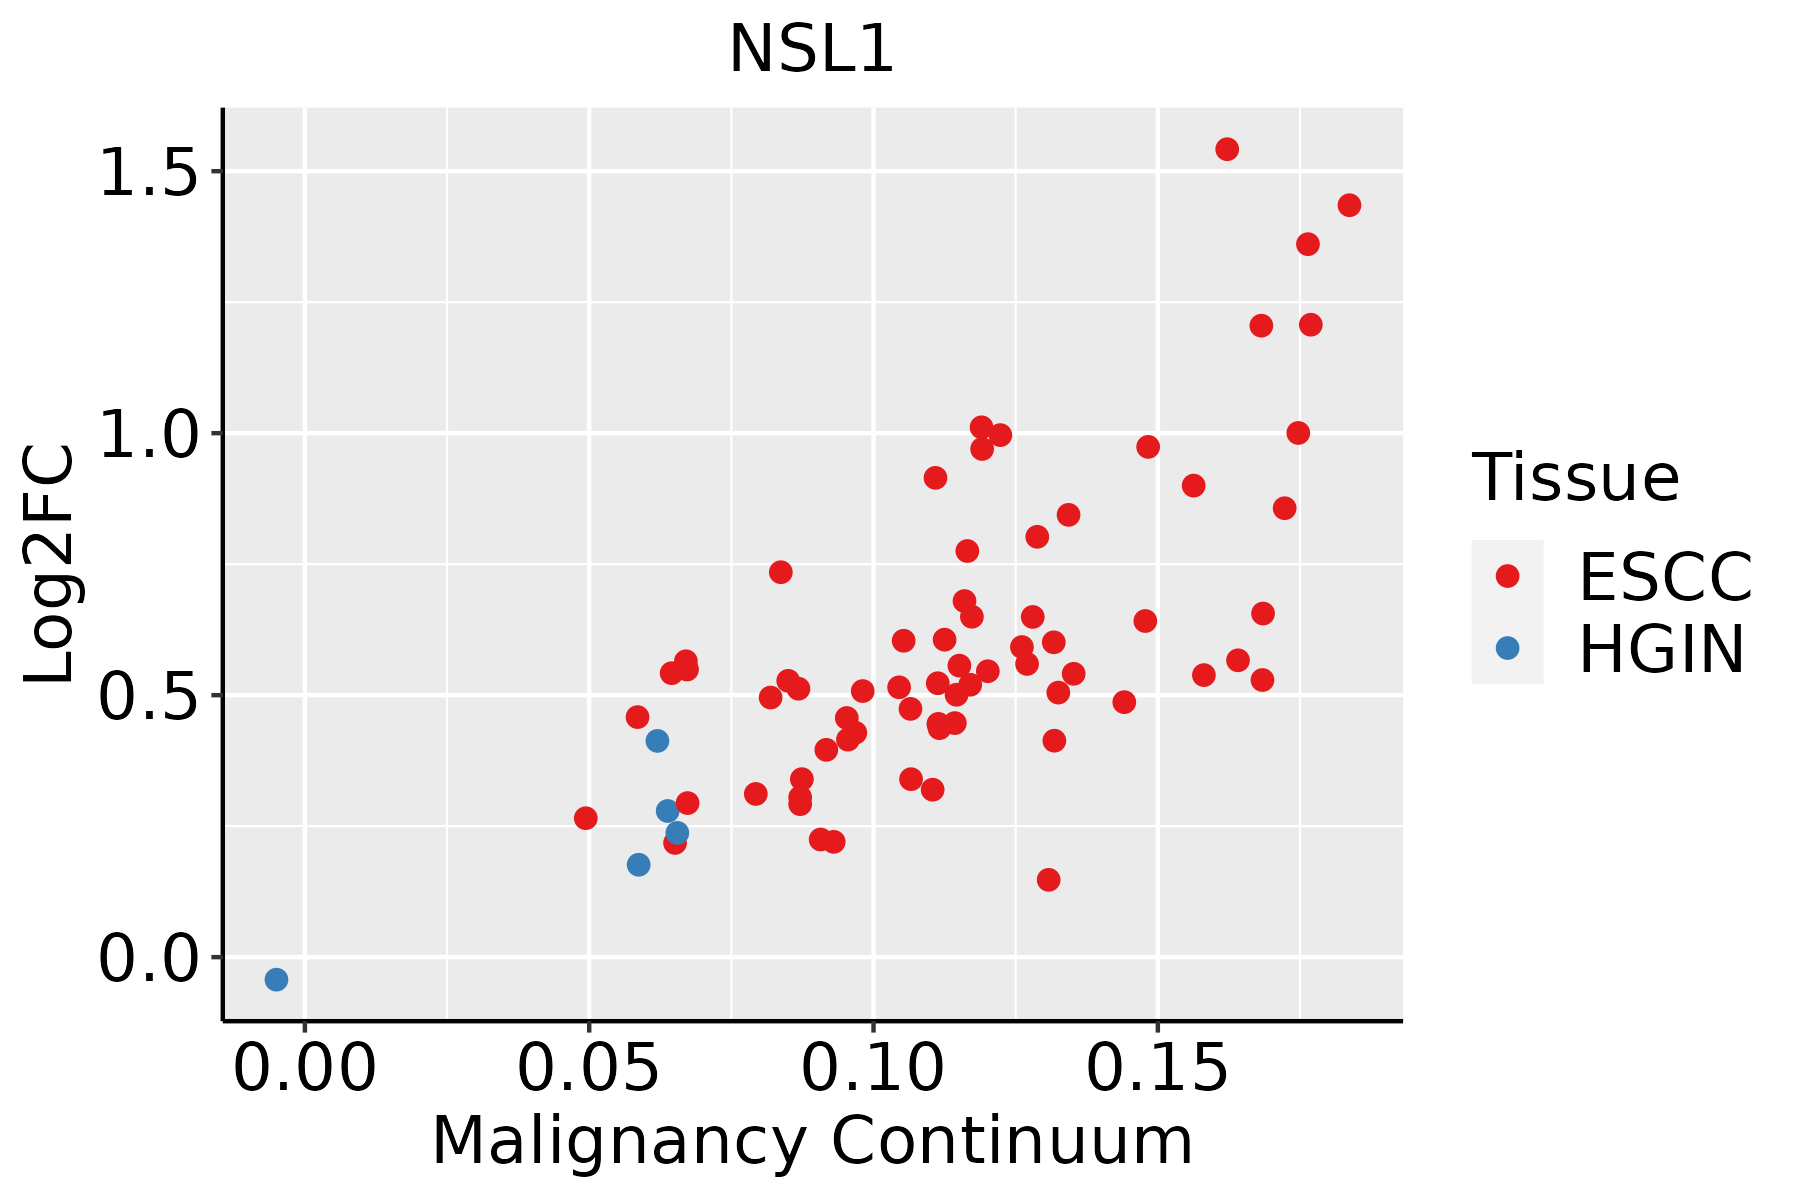 | ESCC: Esophageal squamous cell carcinoma |
| HGIN: High-grade intraepithelial neoplasias | ||
| LGIN: Low-grade intraepithelial neoplasias | ||
| Liver | 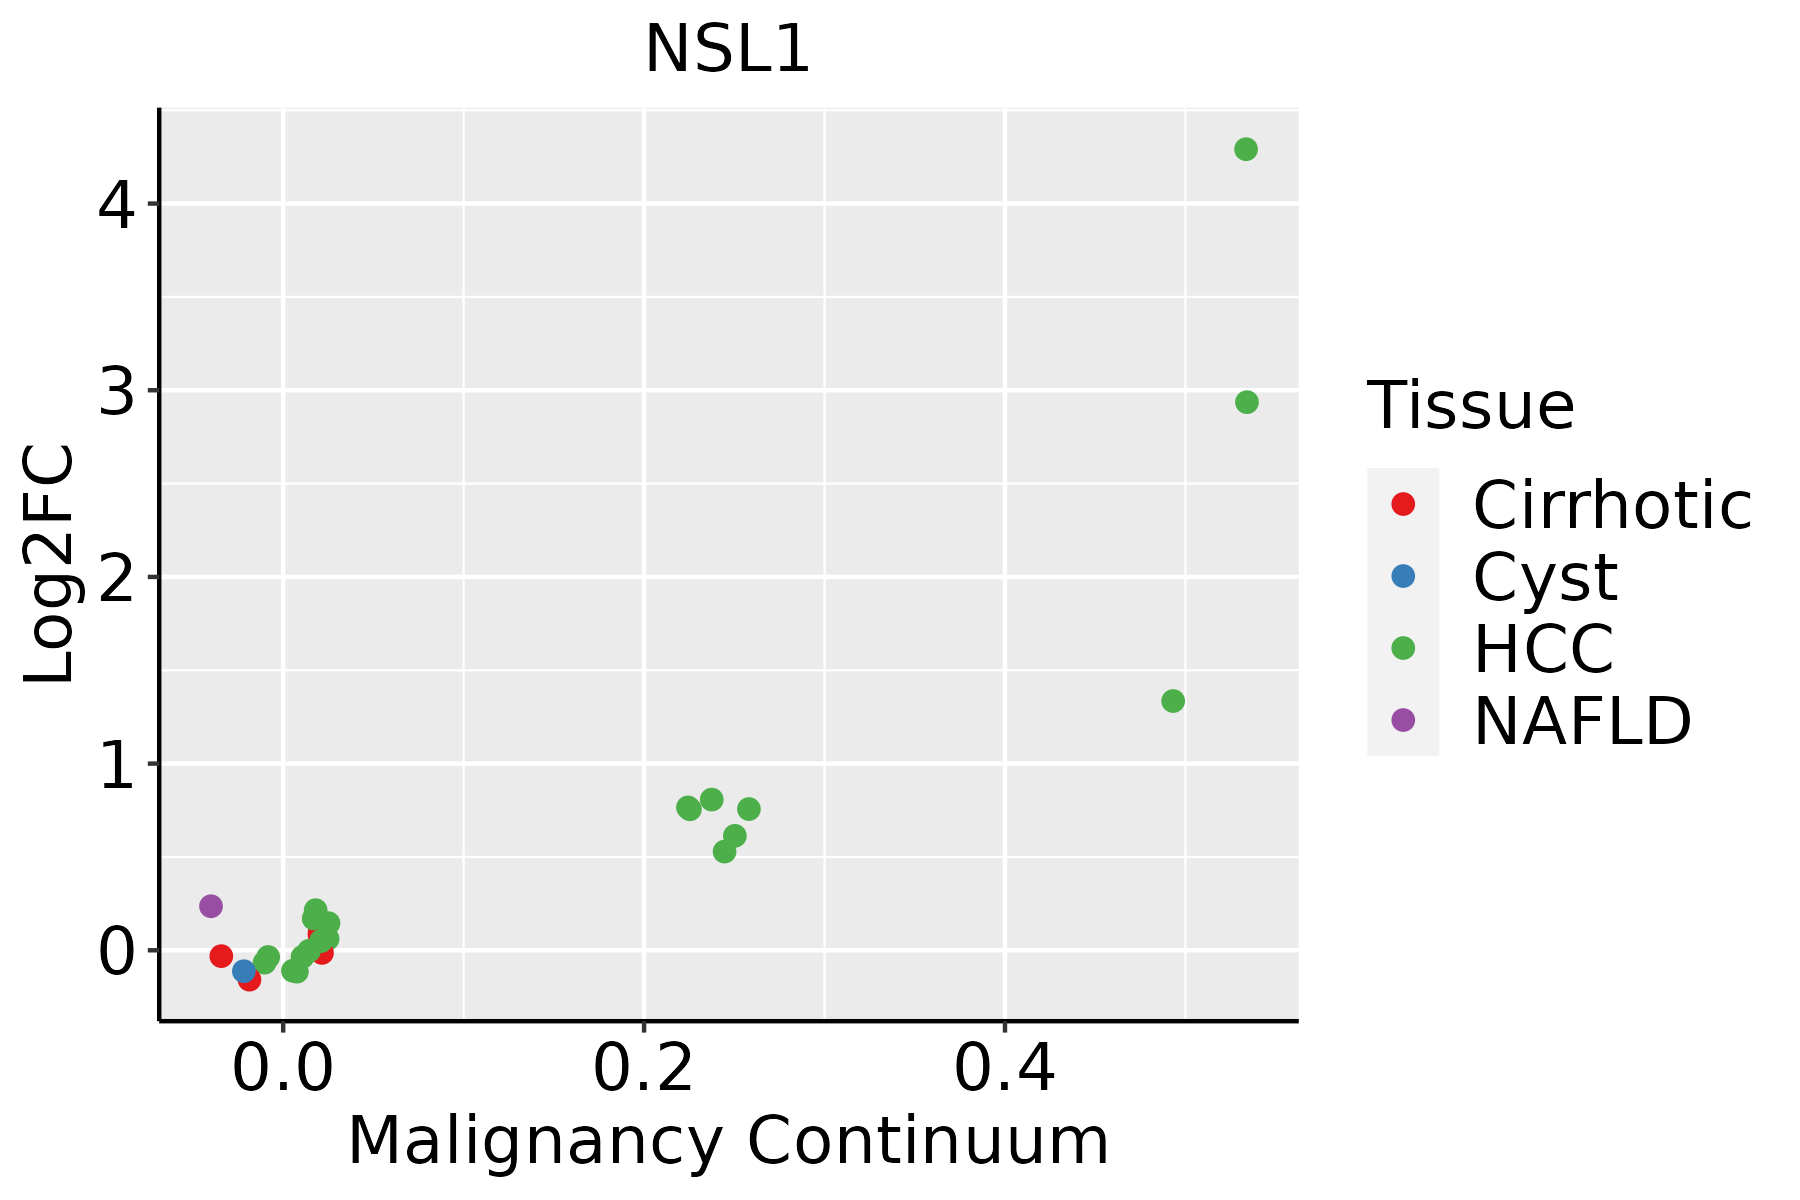 | HCC: Hepatocellular carcinoma |
| NAFLD: Non-alcoholic fatty liver disease | ||
| Oral Cavity | 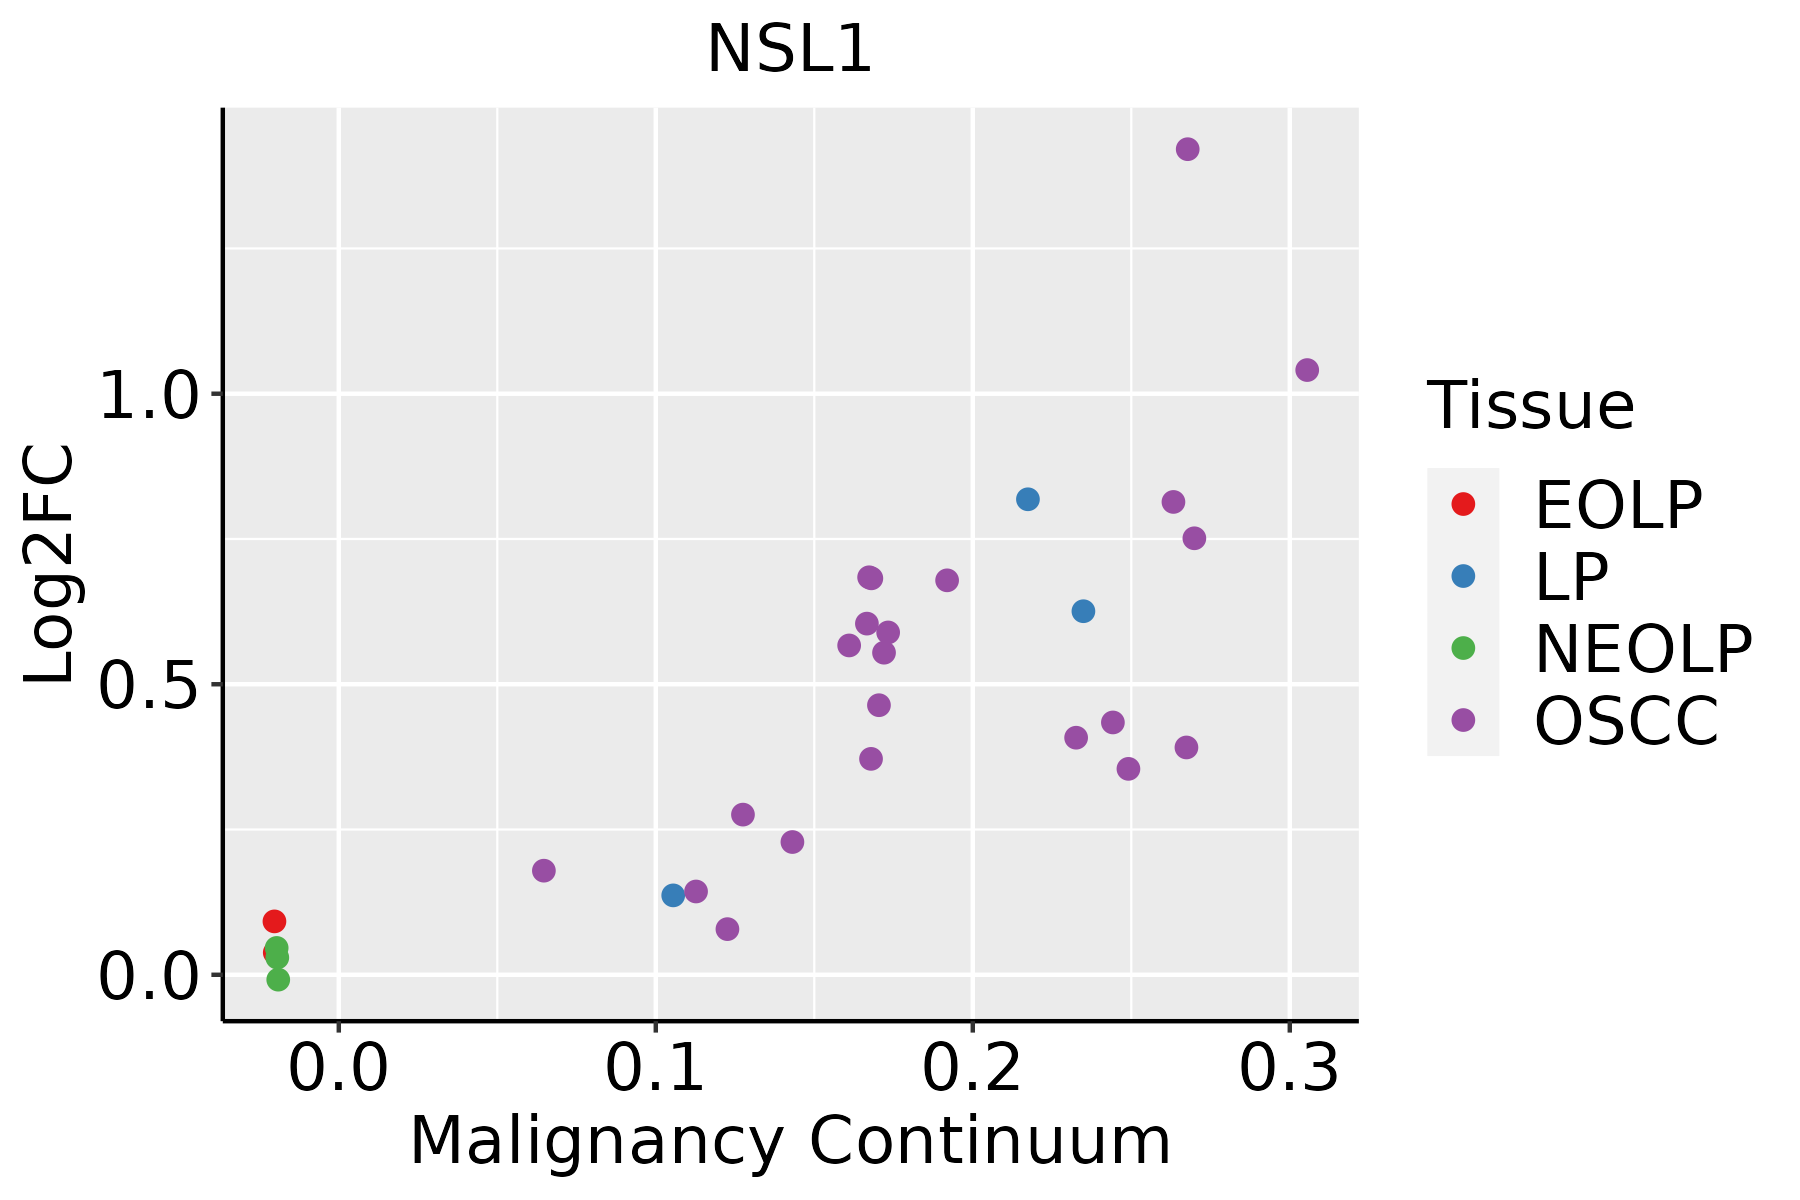 | EOLP: Erosive Oral lichen planus |
| LP: leukoplakia | ||
| NEOLP: Non-erosive oral lichen planus | ||
| OSCC: Oral squamous cell carcinoma | ||
| Skin | 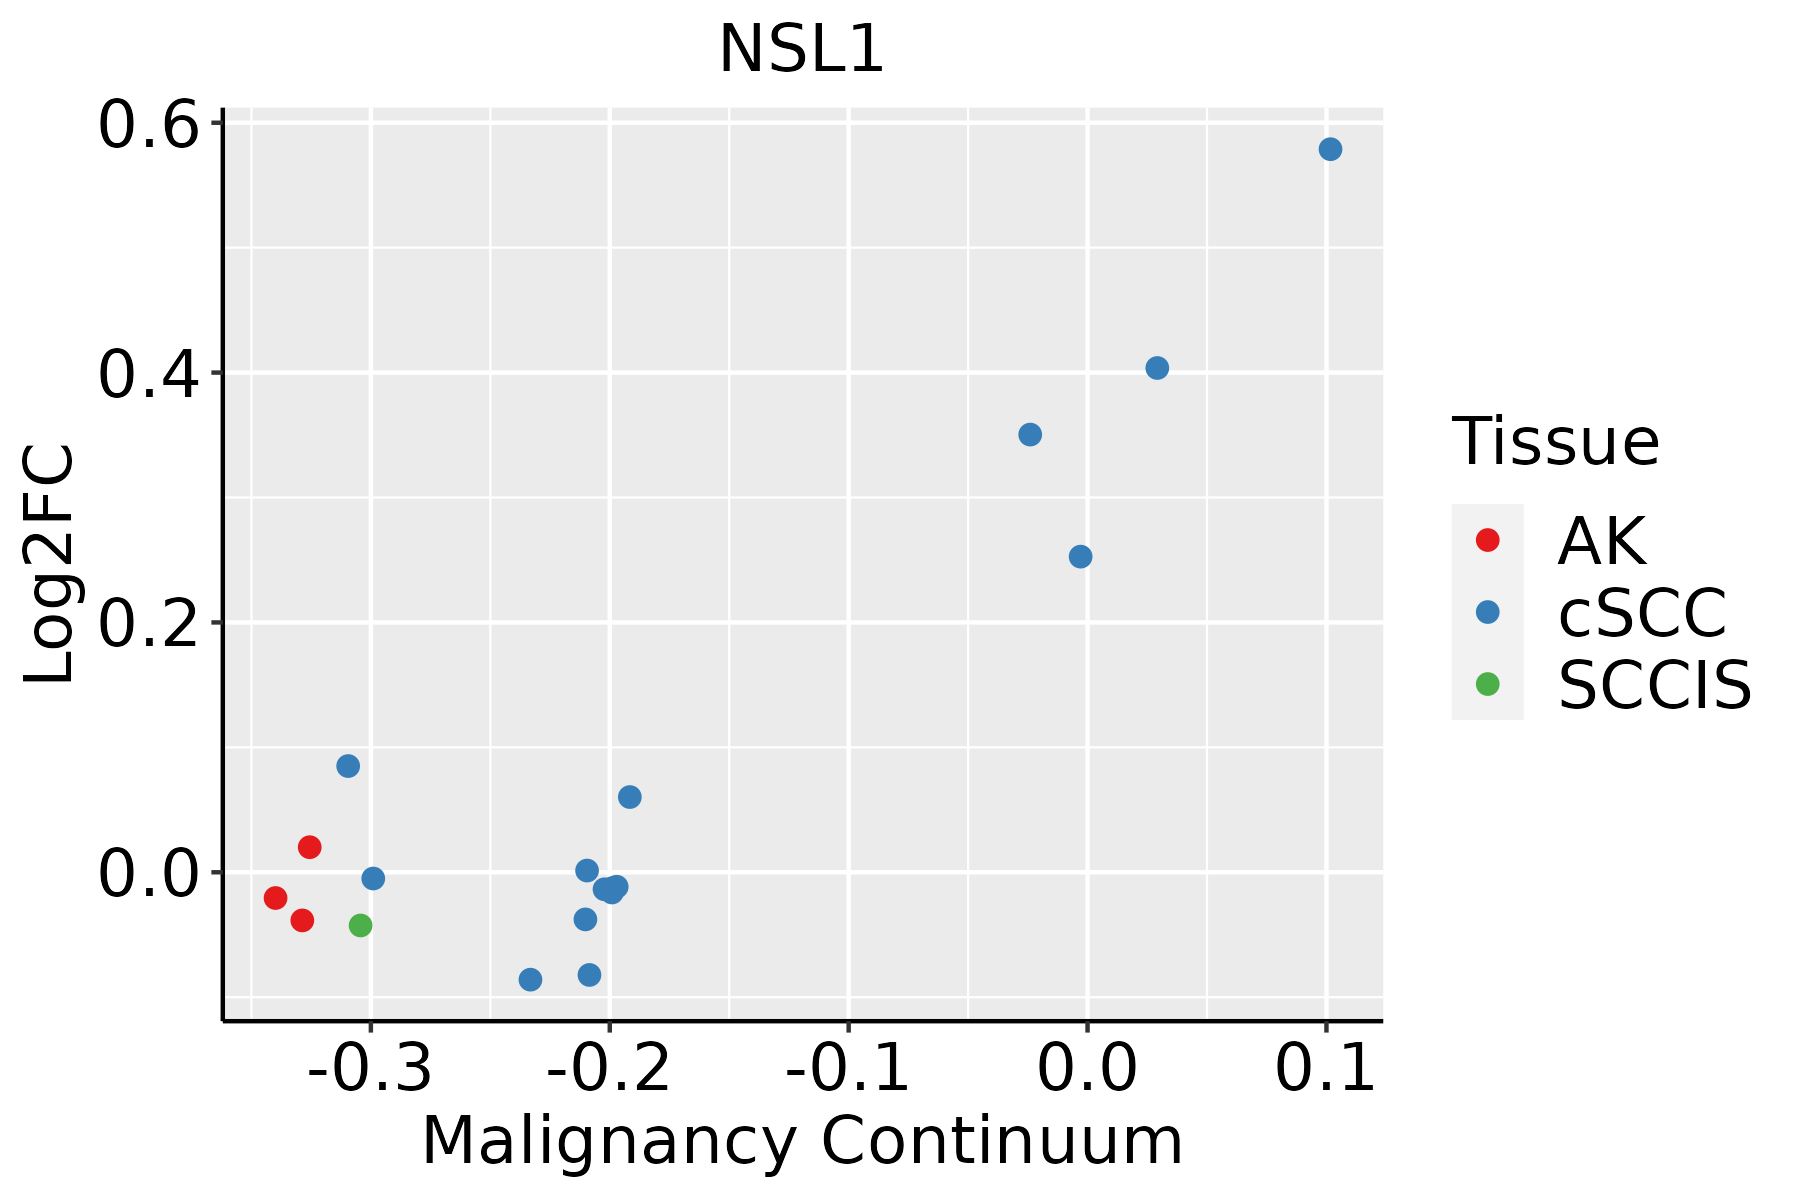 | AK: Actinic keratosis |
| cSCC: Cutaneous squamous cell carcinoma | ||
| SCCIS:squamous cell carcinoma in situ |
| ∗log2FC in expression of this searched gene in stem-like cells from each diseased tissue sample relative to stem-like cells in normal samples in each tissue plotted against the malignancy continuum. Samples are colored based on if they are from different disease stage. |
Top |
Malignant transformation related pathway analysis |
| Find out the enriched GO biological processes and KEGG pathways involved in transition from healthy to precancer to cancer |
| Tissue | Disease Stage | Enriched GO biological Processes |
| Colorectum | AD |  |
| Colorectum | SER |  |
| Colorectum | MSS |  |
| Colorectum | MSI-H |  |
| Colorectum | FAP |  |
| ∗Top 15 enriched GO BP terms are showed in the bar plot of each disease state in each tissue. Each row represents a significant GO biological process which is colored according to the -log10(p.adjust). |
| Page: 1 2 3 4 5 6 7 8 9 |
| GO ID | Tissue | Disease Stage | Description | Gene Ratio | Bg Ratio | pvalue | p.adjust | Count |
| GO:00482853 | Esophagus | ESCC | organelle fission | 301/8552 | 488/18723 | 4.64e-13 | 2.12e-11 | 301 |
| GO:001839413 | Esophagus | ESCC | peptidyl-lysine acetylation | 123/8552 | 169/18723 | 6.58e-13 | 2.94e-11 | 123 |
| GO:00988133 | Esophagus | ESCC | nuclear chromosome segregation | 187/8552 | 281/18723 | 1.00e-12 | 4.36e-11 | 187 |
| GO:004354313 | Esophagus | ESCC | protein acylation | 165/8552 | 243/18723 | 1.69e-12 | 7.14e-11 | 165 |
| GO:000647313 | Esophagus | ESCC | protein acetylation | 140/8552 | 201/18723 | 4.37e-12 | 1.69e-10 | 140 |
| GO:001839313 | Esophagus | ESCC | internal peptidyl-lysine acetylation | 114/8552 | 158/18723 | 1.16e-11 | 4.24e-10 | 114 |
| GO:00002802 | Esophagus | ESCC | nuclear division | 270/8552 | 439/18723 | 1.17e-11 | 4.24e-10 | 270 |
| GO:000647513 | Esophagus | ESCC | internal protein amino acid acetylation | 115/8552 | 160/18723 | 1.43e-11 | 5.08e-10 | 115 |
| GO:00165735 | Esophagus | ESCC | histone acetylation | 110/8552 | 152/18723 | 1.95e-11 | 6.81e-10 | 110 |
| GO:004396712 | Esophagus | ESCC | histone H4 acetylation | 53/8552 | 67/18723 | 2.11e-08 | 4.03e-07 | 53 |
| GO:00439811 | Esophagus | ESCC | histone H4-K5 acetylation | 13/8552 | 15/18723 | 1.31e-03 | 6.26e-03 | 13 |
| GO:00439821 | Esophagus | ESCC | histone H4-K8 acetylation | 13/8552 | 15/18723 | 1.31e-03 | 6.26e-03 | 13 |
| GO:004398411 | Esophagus | ESCC | histone H4-K16 acetylation | 16/8552 | 20/18723 | 1.85e-03 | 8.40e-03 | 16 |
| GO:00165703 | Liver | NAFLD | histone modification | 90/1882 | 463/18723 | 5.74e-10 | 1.28e-07 | 90 |
| GO:0018205 | Liver | NAFLD | peptidyl-lysine modification | 65/1882 | 376/18723 | 9.42e-06 | 3.02e-04 | 65 |
| GO:0043543 | Liver | NAFLD | protein acylation | 43/1882 | 243/18723 | 1.70e-04 | 3.07e-03 | 43 |
| GO:0006473 | Liver | NAFLD | protein acetylation | 37/1882 | 201/18723 | 2.10e-04 | 3.61e-03 | 37 |
| GO:0018394 | Liver | NAFLD | peptidyl-lysine acetylation | 32/1882 | 169/18723 | 3.24e-04 | 5.00e-03 | 32 |
| GO:0018393 | Liver | NAFLD | internal peptidyl-lysine acetylation | 28/1882 | 158/18723 | 2.10e-03 | 2.06e-02 | 28 |
| GO:0006475 | Liver | NAFLD | internal protein amino acid acetylation | 28/1882 | 160/18723 | 2.54e-03 | 2.36e-02 | 28 |
| Page: 1 2 3 4 5 6 7 8 9 10 |
| Pathway ID | Tissue | Disease Stage | Description | Gene Ratio | Bg Ratio | pvalue | p.adjust | qvalue | Count |
| Page: 1 |
Top |
Cell-cell communication analysis |
| Identification of potential cell-cell interactions between two cell types and their ligand-receptor pairs for different disease states |
| Ligand | Receptor | LRpair | Pathway | Tissue | Disease Stage |
| Page: 1 |
Top |
Single-cell gene regulatory network inference analysis |
| Find out the significant the regulons (TFs) and the target genes of each regulon across cell types for different disease states |
| TF | Cell Type | Tissue | Disease Stage | Target Gene | RSS | Regulon Activity |
| ∗The dot plots of a searched regulon are shown for all cell subpopulations in each disease state of each tissue based on the regulon specific score inferred using pySCENIC and by calculating the average expression. |
| Page: 1 |
Top |
Somatic mutation of malignant transformation related genes |
| Annotation of somatic variants for genes involved in malignant transformation |
| Hugo Symbol | Variant Class | Variant Classification | dbSNP RS | HGVSc | HGVSp | HGVSp Short | SWISSPROT | BIOTYPE | SIFT | PolyPhen | Tumor Sample Barcode | Tissue | Histology | Sex | Age | Stage | Therapy Types | Drugs | Outcome |
| NSL1 | SNV | Missense_Mutation | c.731N>G | p.Thr244Arg | p.T244R | Q96IY1 | protein_coding | tolerated(0.1) | possibly_damaging(0.467) | TCGA-BH-A0C0-01 | Breast | breast invasive carcinoma | Female | <65 | I/II | Chemotherapy | carboplatin | SD | |
| NSL1 | SNV | Missense_Mutation | c.772N>G | p.Arg258Gly | p.R258G | Q96IY1 | protein_coding | deleterious(0.01) | probably_damaging(0.994) | TCGA-BH-A0DK-01 | Breast | breast invasive carcinoma | Female | <65 | I/II | Hormone Therapy | tamoxiphen | SD | |
| NSL1 | SNV | Missense_Mutation | c.223N>C | p.Asp75His | p.D75H | Q96IY1 | protein_coding | deleterious(0) | probably_damaging(0.993) | TCGA-E2-A15S-01 | Breast | breast invasive carcinoma | Female | <65 | I/II | Chemotherapy | doxorubicin | SD | |
| NSL1 | SNV | Missense_Mutation | c.547N>C | p.Glu183Gln | p.E183Q | Q96IY1 | protein_coding | tolerated(1) | benign(0.043) | TCGA-E9-A1RF-01 | Breast | breast invasive carcinoma | Female | >=65 | III/IV | Hormone Therapy | tamoxiphen | SD | |
| NSL1 | SNV | Missense_Mutation | novel | c.82N>C | p.Val28Leu | p.V28L | Q96IY1 | protein_coding | tolerated(0.24) | benign(0.027) | TCGA-E9-A3X8-01 | Breast | breast invasive carcinoma | Female | <65 | I/II | Chemotherapy | cyclophosphane | CR |
| NSL1 | SNV | Missense_Mutation | novel | c.807N>C | p.Trp269Cys | p.W269C | Q96IY1 | protein_coding | tolerated(0.18) | benign(0.003) | TCGA-DG-A2KJ-01 | Cervix | cervical & endocervical cancer | Female | <65 | III/IV | Chemotherapy | cisplatin | SD |
| NSL1 | insertion | Frame_Shift_Ins | novel | c.528_529insT | p.Gly177TrpfsTer10 | p.G177Wfs*10 | Q96IY1 | protein_coding | TCGA-2W-A8YY-01 | Cervix | cervical & endocervical cancer | Female | <65 | I/II | Chemotherapy | cisplatin | CR | ||
| NSL1 | SNV | Missense_Mutation | c.832A>C | p.Asn278His | p.N278H | Q96IY1 | protein_coding | tolerated(0.15) | benign(0.312) | TCGA-AA-3510-01 | Colorectum | colon adenocarcinoma | Male | >=65 | I/II | Unknown | Unknown | SD | |
| NSL1 | SNV | Missense_Mutation | c.566N>C | p.Lys189Thr | p.K189T | Q96IY1 | protein_coding | deleterious(0) | probably_damaging(0.986) | TCGA-AA-3955-01 | Colorectum | colon adenocarcinoma | Male | <65 | III/IV | Chemotherapy | capecitabine | CR | |
| NSL1 | SNV | Missense_Mutation | novel | c.773G>T | p.Arg258Ile | p.R258I | Q96IY1 | protein_coding | tolerated(0.11) | probably_damaging(0.997) | TCGA-AA-A00N-01 | Colorectum | colon adenocarcinoma | Male | >=65 | I/II | Unknown | Unknown | PD |
| Page: 1 2 3 |
Top |
Related drugs of malignant transformation related genes |
| Identification of chemicals and drugs interact with genes involved in malignant transfromation |
| (DGIdb 4.0) |
| Entrez ID | Symbol | Category | Interaction Types | Drug Claim Name | Drug Name | PMIDs |
| Page: 1 |

Copyright 2023-Present -The University of Texas Health Science Center at Houston |