
|
|||||
|
 | |
| |
| |
| |
| |
| |
|
Gene: NPRL3 |
Gene summary for NPRL3 |
| Gene information | Species | Human | Gene symbol | NPRL3 | Gene ID | 8131 |
| Gene name | NPR3 like, GATOR1 complex subunit | |
| Gene Alias | C16orf35 | |
| Cytomap | 16p13.3 | |
| Gene Type | protein-coding | GO ID | GO:0000045 | UniProtAcc | Q9BTE2 |
Top |
Malignant transformation analysis |
| Identification of the aberrant gene expression in precancerous and cancerous lesions by comparing the gene expression of stem-like cells in diseased tissues with normal stem cells |
| Entrez ID | Symbol | Replicates | Species | Organ | Tissue | Adj P-value | Log2FC | Malignancy |
| 8131 | NPRL3 | LZE7T | Human | Esophagus | ESCC | 1.31e-08 | 2.80e-01 | 0.0667 |
| 8131 | NPRL3 | LZE8T | Human | Esophagus | ESCC | 7.37e-05 | 8.45e-02 | 0.067 |
| 8131 | NPRL3 | LZE22T | Human | Esophagus | ESCC | 2.42e-07 | 3.69e-01 | 0.068 |
| 8131 | NPRL3 | LZE24T | Human | Esophagus | ESCC | 9.57e-08 | 2.07e-01 | 0.0596 |
| 8131 | NPRL3 | LZE21T | Human | Esophagus | ESCC | 4.50e-02 | 1.11e-01 | 0.0655 |
| 8131 | NPRL3 | P1T-E | Human | Esophagus | ESCC | 2.02e-02 | 2.77e-01 | 0.0875 |
| 8131 | NPRL3 | P2T-E | Human | Esophagus | ESCC | 2.57e-25 | 5.10e-01 | 0.1177 |
| 8131 | NPRL3 | P4T-E | Human | Esophagus | ESCC | 2.18e-06 | 6.48e-02 | 0.1323 |
| 8131 | NPRL3 | P5T-E | Human | Esophagus | ESCC | 5.06e-14 | 1.47e-01 | 0.1327 |
| 8131 | NPRL3 | P8T-E | Human | Esophagus | ESCC | 6.14e-13 | 2.30e-01 | 0.0889 |
| 8131 | NPRL3 | P9T-E | Human | Esophagus | ESCC | 1.68e-07 | 7.77e-02 | 0.1131 |
| 8131 | NPRL3 | P10T-E | Human | Esophagus | ESCC | 5.38e-13 | 2.28e-01 | 0.116 |
| 8131 | NPRL3 | P11T-E | Human | Esophagus | ESCC | 9.08e-03 | 1.06e-01 | 0.1426 |
| 8131 | NPRL3 | P12T-E | Human | Esophagus | ESCC | 3.22e-17 | 3.57e-01 | 0.1122 |
| 8131 | NPRL3 | P15T-E | Human | Esophagus | ESCC | 1.97e-14 | 2.44e-01 | 0.1149 |
| 8131 | NPRL3 | P16T-E | Human | Esophagus | ESCC | 6.34e-13 | 1.58e-01 | 0.1153 |
| 8131 | NPRL3 | P17T-E | Human | Esophagus | ESCC | 4.03e-04 | 2.28e-01 | 0.1278 |
| 8131 | NPRL3 | P20T-E | Human | Esophagus | ESCC | 9.65e-19 | 3.40e-01 | 0.1124 |
| 8131 | NPRL3 | P21T-E | Human | Esophagus | ESCC | 6.31e-13 | 1.43e-01 | 0.1617 |
| 8131 | NPRL3 | P22T-E | Human | Esophagus | ESCC | 3.01e-20 | 3.70e-01 | 0.1236 |
| Page: 1 2 3 4 5 6 |
| Tissue | Expression Dynamics | Abbreviation |
| Esophagus |  | ESCC: Esophageal squamous cell carcinoma |
| HGIN: High-grade intraepithelial neoplasias | ||
| LGIN: Low-grade intraepithelial neoplasias | ||
| Liver | 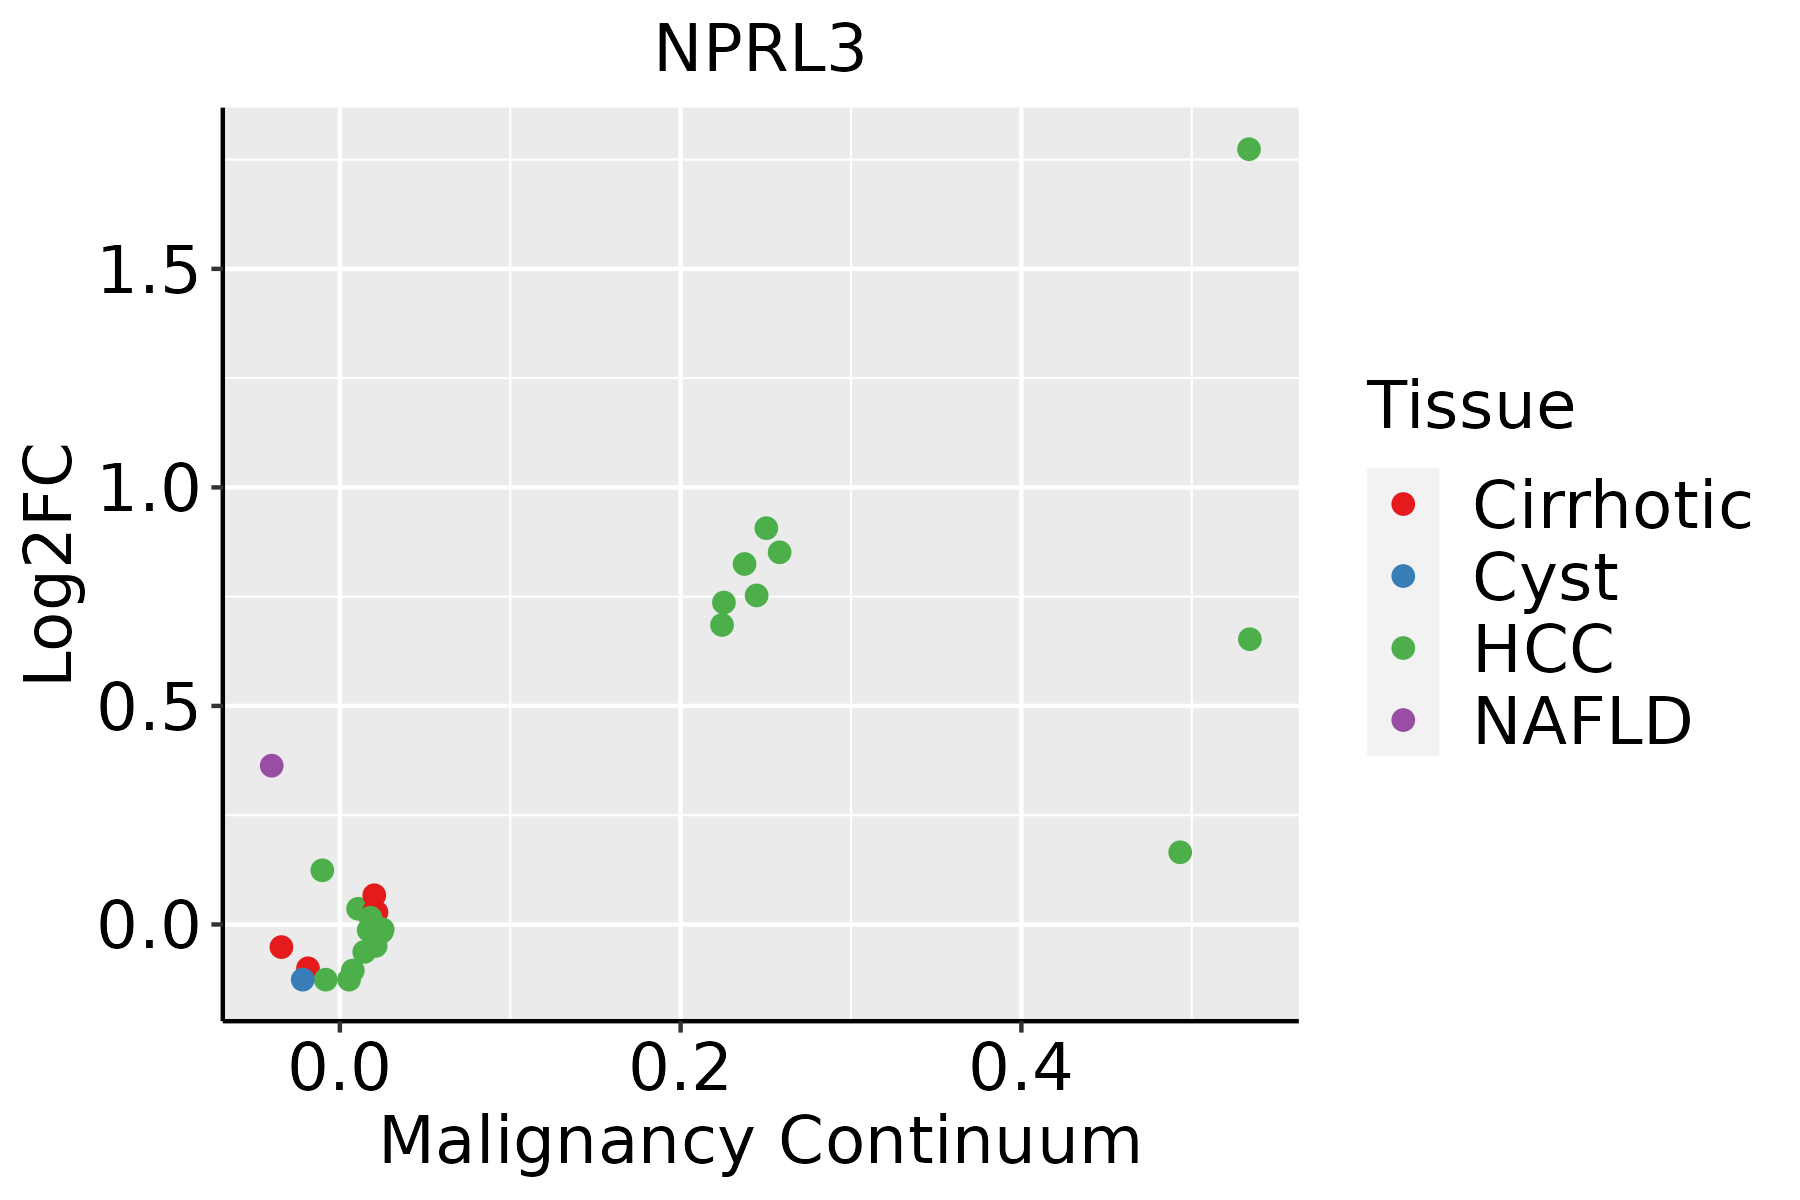 | HCC: Hepatocellular carcinoma |
| NAFLD: Non-alcoholic fatty liver disease | ||
| Oral Cavity |  | EOLP: Erosive Oral lichen planus |
| LP: leukoplakia | ||
| NEOLP: Non-erosive oral lichen planus | ||
| OSCC: Oral squamous cell carcinoma | ||
| Skin | 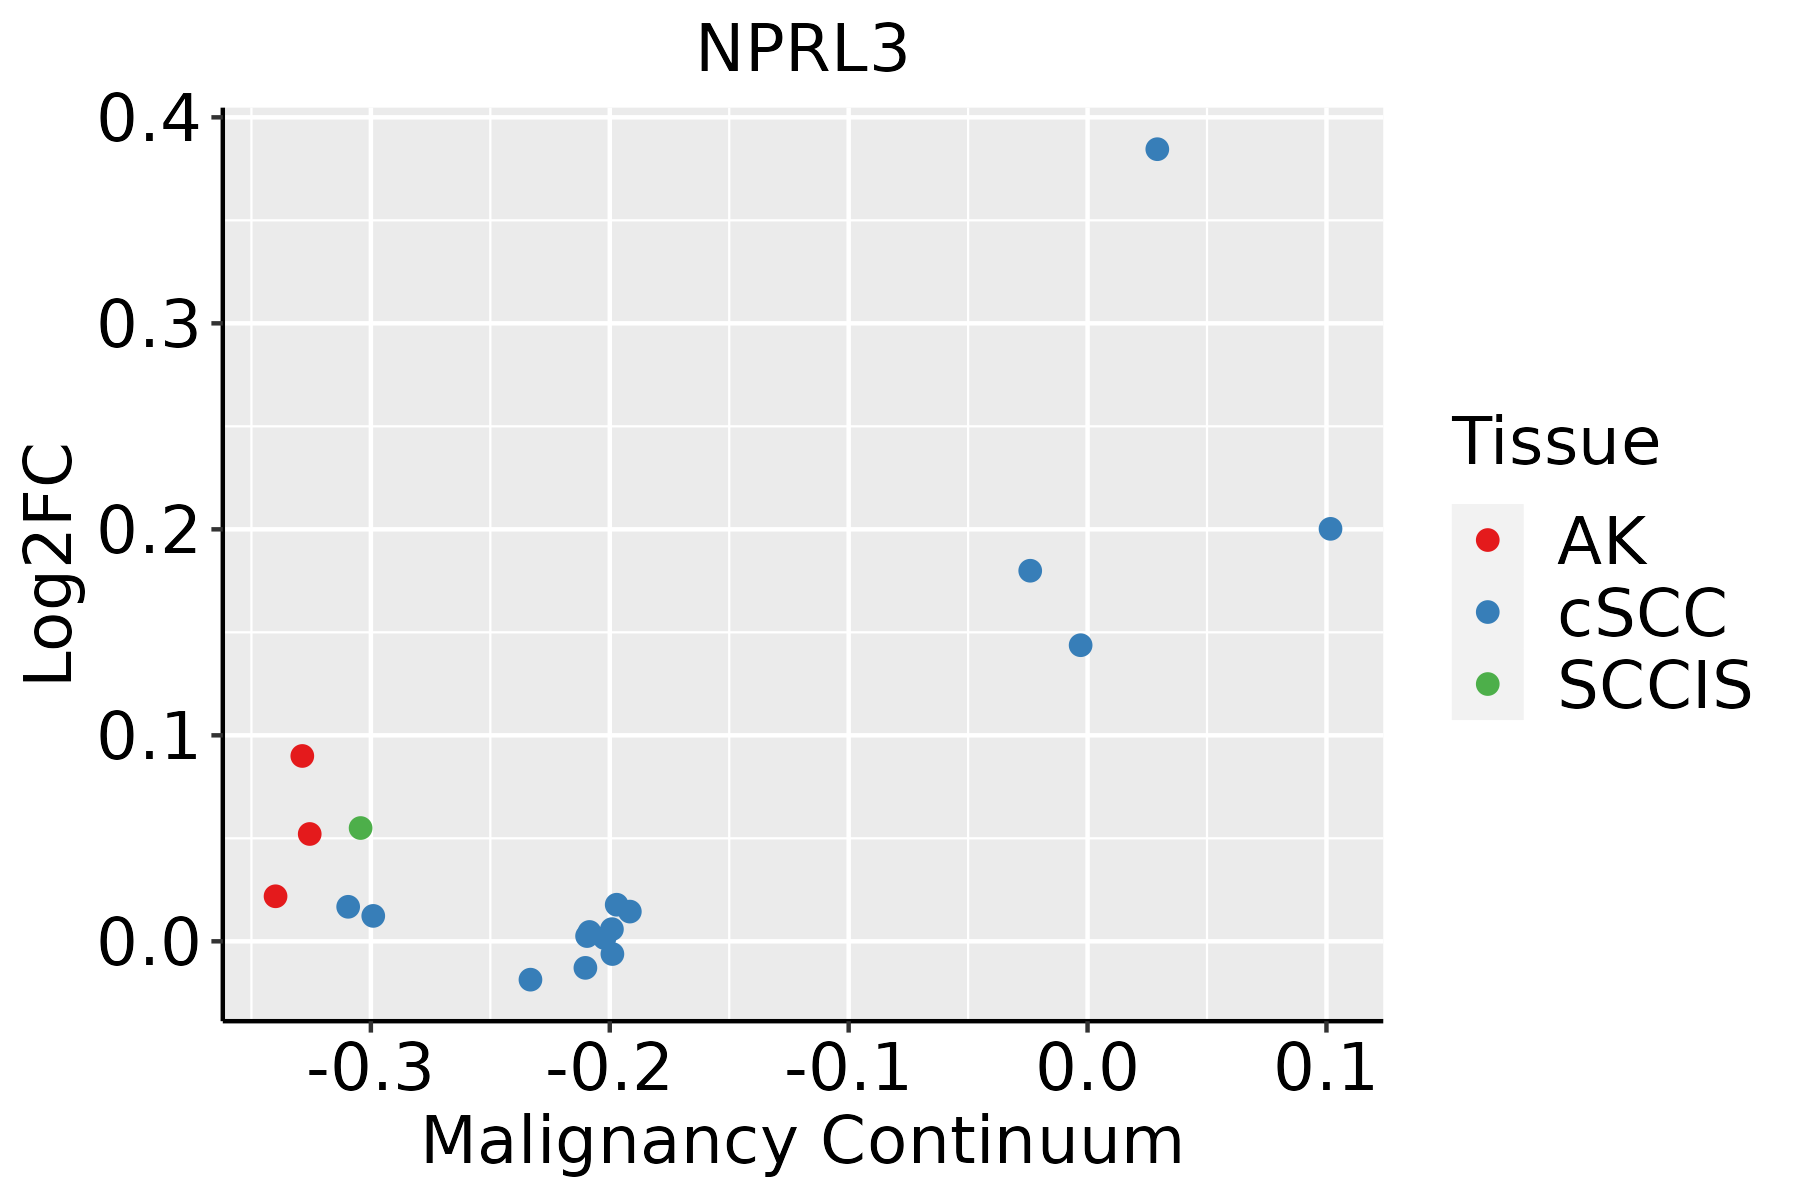 | AK: Actinic keratosis |
| cSCC: Cutaneous squamous cell carcinoma | ||
| SCCIS:squamous cell carcinoma in situ | ||
| Thyroid |  | ATC: Anaplastic thyroid cancer |
| HT: Hashimoto's thyroiditis | ||
| PTC: Papillary thyroid cancer |
| ∗log2FC in expression of this searched gene in stem-like cells from each diseased tissue sample relative to stem-like cells in normal samples in each tissue plotted against the malignancy continuum. Samples are colored based on if they are from different disease stage. |
Top |
Malignant transformation related pathway analysis |
| Find out the enriched GO biological processes and KEGG pathways involved in transition from healthy to precancer to cancer |
| Tissue | Disease Stage | Enriched GO biological Processes |
| Colorectum | AD |  |
| Colorectum | SER |  |
| Colorectum | MSS |  |
| Colorectum | MSI-H |  |
| Colorectum | FAP |  |
| ∗Top 15 enriched GO BP terms are showed in the bar plot of each disease state in each tissue. Each row represents a significant GO biological process which is colored according to the -log10(p.adjust). |
| Page: 1 2 3 4 5 6 7 8 9 |
| GO ID | Tissue | Disease Stage | Description | Gene Ratio | Bg Ratio | pvalue | p.adjust | Count |
| GO:00316677 | Liver | NAFLD | response to nutrient levels | 85/1882 | 474/18723 | 8.23e-08 | 7.09e-06 | 85 |
| GO:00714967 | Liver | NAFLD | cellular response to external stimulus | 51/1882 | 320/18723 | 6.21e-04 | 8.18e-03 | 51 |
| GO:00162365 | Liver | NAFLD | macroautophagy | 45/1882 | 291/18723 | 2.31e-03 | 2.19e-02 | 45 |
| GO:00425945 | Liver | NAFLD | response to starvation | 33/1882 | 197/18723 | 2.35e-03 | 2.21e-02 | 33 |
| GO:001623611 | Liver | Cirrhotic | macroautophagy | 129/4634 | 291/18723 | 1.75e-13 | 1.41e-11 | 129 |
| GO:004259412 | Liver | Cirrhotic | response to starvation | 87/4634 | 197/18723 | 1.85e-09 | 7.78e-08 | 87 |
| GO:003166712 | Liver | Cirrhotic | response to nutrient levels | 174/4634 | 474/18723 | 3.08e-09 | 1.27e-07 | 174 |
| GO:00070332 | Liver | Cirrhotic | vacuole organization | 80/4634 | 180/18723 | 5.73e-09 | 2.25e-07 | 80 |
| GO:007149612 | Liver | Cirrhotic | cellular response to external stimulus | 123/4634 | 320/18723 | 3.27e-08 | 1.10e-06 | 123 |
| GO:00316686 | Liver | Cirrhotic | cellular response to extracellular stimulus | 96/4634 | 246/18723 | 4.55e-07 | 1.05e-05 | 96 |
| GO:00092675 | Liver | Cirrhotic | cellular response to starvation | 67/4634 | 156/18723 | 4.58e-07 | 1.05e-05 | 67 |
| GO:00316695 | Liver | Cirrhotic | cellular response to nutrient levels | 85/4634 | 215/18723 | 1.08e-06 | 2.20e-05 | 85 |
| GO:0000045 | Liver | Cirrhotic | autophagosome assembly | 43/4634 | 99/18723 | 3.56e-05 | 4.32e-04 | 43 |
| GO:1905037 | Liver | Cirrhotic | autophagosome organization | 44/4634 | 103/18723 | 4.74e-05 | 5.50e-04 | 44 |
| GO:0044088 | Liver | Cirrhotic | regulation of vacuole organization | 23/4634 | 45/18723 | 1.23e-04 | 1.22e-03 | 23 |
| GO:1990928 | Liver | Cirrhotic | response to amino acid starvation | 23/4634 | 49/18723 | 6.06e-04 | 4.67e-03 | 23 |
| GO:1902115 | Liver | Cirrhotic | regulation of organelle assembly | 66/4634 | 186/18723 | 6.66e-04 | 5.04e-03 | 66 |
| GO:2000785 | Liver | Cirrhotic | regulation of autophagosome assembly | 18/4634 | 39/18723 | 2.93e-03 | 1.67e-02 | 18 |
| GO:0034198 | Liver | Cirrhotic | cellular response to amino acid starvation | 20/4634 | 46/18723 | 4.15e-03 | 2.22e-02 | 20 |
| GO:00319292 | Liver | Cirrhotic | TOR signaling | 44/4634 | 126/18723 | 6.69e-03 | 3.30e-02 | 44 |
| Page: 1 2 3 4 5 6 7 8 |
| Pathway ID | Tissue | Disease Stage | Description | Gene Ratio | Bg Ratio | pvalue | p.adjust | qvalue | Count |
| hsa041505 | Esophagus | ESCC | mTOR signaling pathway | 98/4205 | 156/8465 | 5.81e-04 | 1.95e-03 | 9.97e-04 | 98 |
| hsa0415013 | Esophagus | ESCC | mTOR signaling pathway | 98/4205 | 156/8465 | 5.81e-04 | 1.95e-03 | 9.97e-04 | 98 |
| hsa041502 | Liver | HCC | mTOR signaling pathway | 95/4020 | 156/8465 | 4.70e-04 | 1.99e-03 | 1.11e-03 | 95 |
| hsa0415011 | Liver | HCC | mTOR signaling pathway | 95/4020 | 156/8465 | 4.70e-04 | 1.99e-03 | 1.11e-03 | 95 |
| hsa041504 | Oral cavity | OSCC | mTOR signaling pathway | 90/3704 | 156/8465 | 2.87e-04 | 9.15e-04 | 4.66e-04 | 90 |
| hsa0415012 | Oral cavity | OSCC | mTOR signaling pathway | 90/3704 | 156/8465 | 2.87e-04 | 9.15e-04 | 4.66e-04 | 90 |
| Page: 1 |
Top |
Cell-cell communication analysis |
| Identification of potential cell-cell interactions between two cell types and their ligand-receptor pairs for different disease states |
| Ligand | Receptor | LRpair | Pathway | Tissue | Disease Stage |
| Page: 1 |
Top |
Single-cell gene regulatory network inference analysis |
| Find out the significant the regulons (TFs) and the target genes of each regulon across cell types for different disease states |
| TF | Cell Type | Tissue | Disease Stage | Target Gene | RSS | Regulon Activity |
| ∗The dot plots of a searched regulon are shown for all cell subpopulations in each disease state of each tissue based on the regulon specific score inferred using pySCENIC and by calculating the average expression. |
| Page: 1 |
Top |
Somatic mutation of malignant transformation related genes |
| Annotation of somatic variants for genes involved in malignant transformation |
| Hugo Symbol | Variant Class | Variant Classification | dbSNP RS | HGVSc | HGVSp | HGVSp Short | SWISSPROT | BIOTYPE | SIFT | PolyPhen | Tumor Sample Barcode | Tissue | Histology | Sex | Age | Stage | Therapy Types | Drugs | Outcome |
| NPRL3 | SNV | Missense_Mutation | rs778377009 | c.1462G>C | p.Ala488Pro | p.A488P | Q12980 | protein_coding | tolerated(0.13) | possibly_damaging(0.502) | TCGA-A2-A0CS-01 | Breast | breast invasive carcinoma | Female | >=65 | III/IV | Hormone Therapy | anastrozole | SD |
| NPRL3 | SNV | Missense_Mutation | rs778377009 | c.1462N>C | p.Ala488Pro | p.A488P | Q12980 | protein_coding | tolerated(0.13) | possibly_damaging(0.502) | TCGA-A2-A1FW-01 | Breast | breast invasive carcinoma | Female | <65 | III/IV | Chemotherapy | cytoxan | SD |
| NPRL3 | SNV | Missense_Mutation | c.548N>C | p.Gly183Ala | p.G183A | Q12980 | protein_coding | tolerated(1) | benign(0) | TCGA-D8-A27G-01 | Breast | breast invasive carcinoma | Female | >=65 | I/II | Unknown | Unknown | SD | |
| NPRL3 | SNV | Missense_Mutation | rs778377009 | c.1462N>C | p.Ala488Pro | p.A488P | Q12980 | protein_coding | tolerated(0.13) | possibly_damaging(0.502) | TCGA-E2-A150-01 | Breast | breast invasive carcinoma | Female | <65 | I/II | Chemotherapy | doxorubicin | SD |
| NPRL3 | SNV | Missense_Mutation | rs556683821 | c.1198C>T | p.Arg400Cys | p.R400C | Q12980 | protein_coding | deleterious(0) | possibly_damaging(0.541) | TCGA-2W-A8YY-01 | Cervix | cervical & endocervical cancer | Female | <65 | I/II | Chemotherapy | cisplatin | CR |
| NPRL3 | SNV | Missense_Mutation | rs769327693 | c.1606N>T | p.Arg536Trp | p.R536W | Q12980 | protein_coding | deleterious(0) | probably_damaging(0.99) | TCGA-AA-3982-01 | Colorectum | colon adenocarcinoma | Male | >=65 | III/IV | Unknown | Unknown | SD |
| NPRL3 | SNV | Missense_Mutation | rs556232826 | c.641N>T | p.Ser214Leu | p.S214L | Q12980 | protein_coding | deleterious(0) | benign(0.06) | TCGA-AA-A00N-01 | Colorectum | colon adenocarcinoma | Male | >=65 | I/II | Unknown | Unknown | PD |
| NPRL3 | SNV | Missense_Mutation | c.801N>T | p.Glu267Asp | p.E267D | Q12980 | protein_coding | tolerated(0.15) | probably_damaging(0.989) | TCGA-AA-A010-01 | Colorectum | colon adenocarcinoma | Female | <65 | I/II | Chemotherapy | folinic | CR | |
| NPRL3 | SNV | Missense_Mutation | c.113A>T | p.Gln38Leu | p.Q38L | Q12980 | protein_coding | tolerated(0.37) | benign(0) | TCGA-CK-4951-01 | Colorectum | colon adenocarcinoma | Female | >=65 | I/II | Unknown | Unknown | PD | |
| NPRL3 | SNV | Missense_Mutation | novel | c.640N>C | p.Ser214Pro | p.S214P | Q12980 | protein_coding | deleterious(0) | benign(0.198) | TCGA-D5-6927-01 | Colorectum | colon adenocarcinoma | Male | <65 | I/II | Unknown | Unknown | SD |
| Page: 1 2 3 4 5 |
Top |
Related drugs of malignant transformation related genes |
| Identification of chemicals and drugs interact with genes involved in malignant transfromation |
| (DGIdb 4.0) |
| Entrez ID | Symbol | Category | Interaction Types | Drug Claim Name | Drug Name | PMIDs |
| Page: 1 |

Copyright 2023-Present -The University of Texas Health Science Center at Houston |