
|
|||||
|
 | |
| |
| |
| |
| |
| |
|
Gene: NIPSNAP2 |
Gene summary for NIPSNAP2 |
| Gene information | Species | Human | Gene symbol | NIPSNAP2 | Gene ID | 2631 |
| Gene name | nipsnap homolog 2 | |
| Gene Alias | GBAS | |
| Cytomap | 7p11.2 | |
| Gene Type | protein-coding | GO ID | GO:0006091 | UniProtAcc | O75323 |
Top |
Malignant transformation analysis |
| Identification of the aberrant gene expression in precancerous and cancerous lesions by comparing the gene expression of stem-like cells in diseased tissues with normal stem cells |
| Entrez ID | Symbol | Replicates | Species | Organ | Tissue | Adj P-value | Log2FC | Malignancy |
| 2631 | NIPSNAP2 | HTA11_78_2000001011 | Human | Colorectum | AD | 8.26e-03 | 4.42e-01 | -0.1088 |
| 2631 | NIPSNAP2 | HTA11_347_2000001011 | Human | Colorectum | AD | 6.08e-08 | 4.82e-01 | -0.1954 |
| 2631 | NIPSNAP2 | HTA11_696_2000001011 | Human | Colorectum | AD | 1.34e-02 | 2.79e-01 | -0.1464 |
| 2631 | NIPSNAP2 | HTA11_99999970781_79442 | Human | Colorectum | MSS | 4.78e-17 | -4.15e-01 | 0.294 |
| 2631 | NIPSNAP2 | HTA11_99999965104_69814 | Human | Colorectum | MSS | 6.87e-07 | -4.15e-01 | 0.281 |
| 2631 | NIPSNAP2 | HTA11_99999971662_82457 | Human | Colorectum | MSS | 5.56e-16 | -4.15e-01 | 0.3859 |
| 2631 | NIPSNAP2 | HTA11_99999973899_84307 | Human | Colorectum | MSS | 6.67e-05 | -4.15e-01 | 0.2585 |
| 2631 | NIPSNAP2 | HTA11_99999974143_84620 | Human | Colorectum | MSS | 7.63e-19 | -4.15e-01 | 0.3005 |
| 2631 | NIPSNAP2 | A015-C-203 | Human | Colorectum | FAP | 2.05e-10 | -2.88e-01 | -0.1294 |
| 2631 | NIPSNAP2 | A015-C-204 | Human | Colorectum | FAP | 4.00e-04 | -2.86e-01 | -0.0228 |
| 2631 | NIPSNAP2 | A002-C-201 | Human | Colorectum | FAP | 2.58e-05 | -1.82e-01 | 0.0324 |
| 2631 | NIPSNAP2 | A001-C-108 | Human | Colorectum | FAP | 6.06e-08 | -2.74e-01 | -0.0272 |
| 2631 | NIPSNAP2 | A002-C-205 | Human | Colorectum | FAP | 2.15e-09 | -2.61e-01 | -0.1236 |
| 2631 | NIPSNAP2 | A015-C-006 | Human | Colorectum | FAP | 3.94e-07 | -2.86e-01 | -0.0994 |
| 2631 | NIPSNAP2 | A015-C-106 | Human | Colorectum | FAP | 1.49e-03 | -2.01e-01 | -0.0511 |
| 2631 | NIPSNAP2 | A002-C-114 | Human | Colorectum | FAP | 4.11e-11 | -3.61e-01 | -0.1561 |
| 2631 | NIPSNAP2 | A015-C-104 | Human | Colorectum | FAP | 1.39e-10 | -2.81e-01 | -0.1899 |
| 2631 | NIPSNAP2 | A001-C-014 | Human | Colorectum | FAP | 2.27e-03 | -2.24e-01 | 0.0135 |
| 2631 | NIPSNAP2 | A002-C-016 | Human | Colorectum | FAP | 2.49e-07 | -2.54e-01 | 0.0521 |
| 2631 | NIPSNAP2 | A015-C-002 | Human | Colorectum | FAP | 7.51e-06 | -3.41e-01 | -0.0763 |
| Page: 1 2 3 4 5 |
| Tissue | Expression Dynamics | Abbreviation |
| Colorectum (GSE201348) |  | FAP: Familial adenomatous polyposis |
| CRC: Colorectal cancer | ||
| Colorectum (HTA11) |  | AD: Adenomas |
| SER: Sessile serrated lesions | ||
| MSI-H: Microsatellite-high colorectal cancer | ||
| MSS: Microsatellite stable colorectal cancer | ||
| Endometrium | 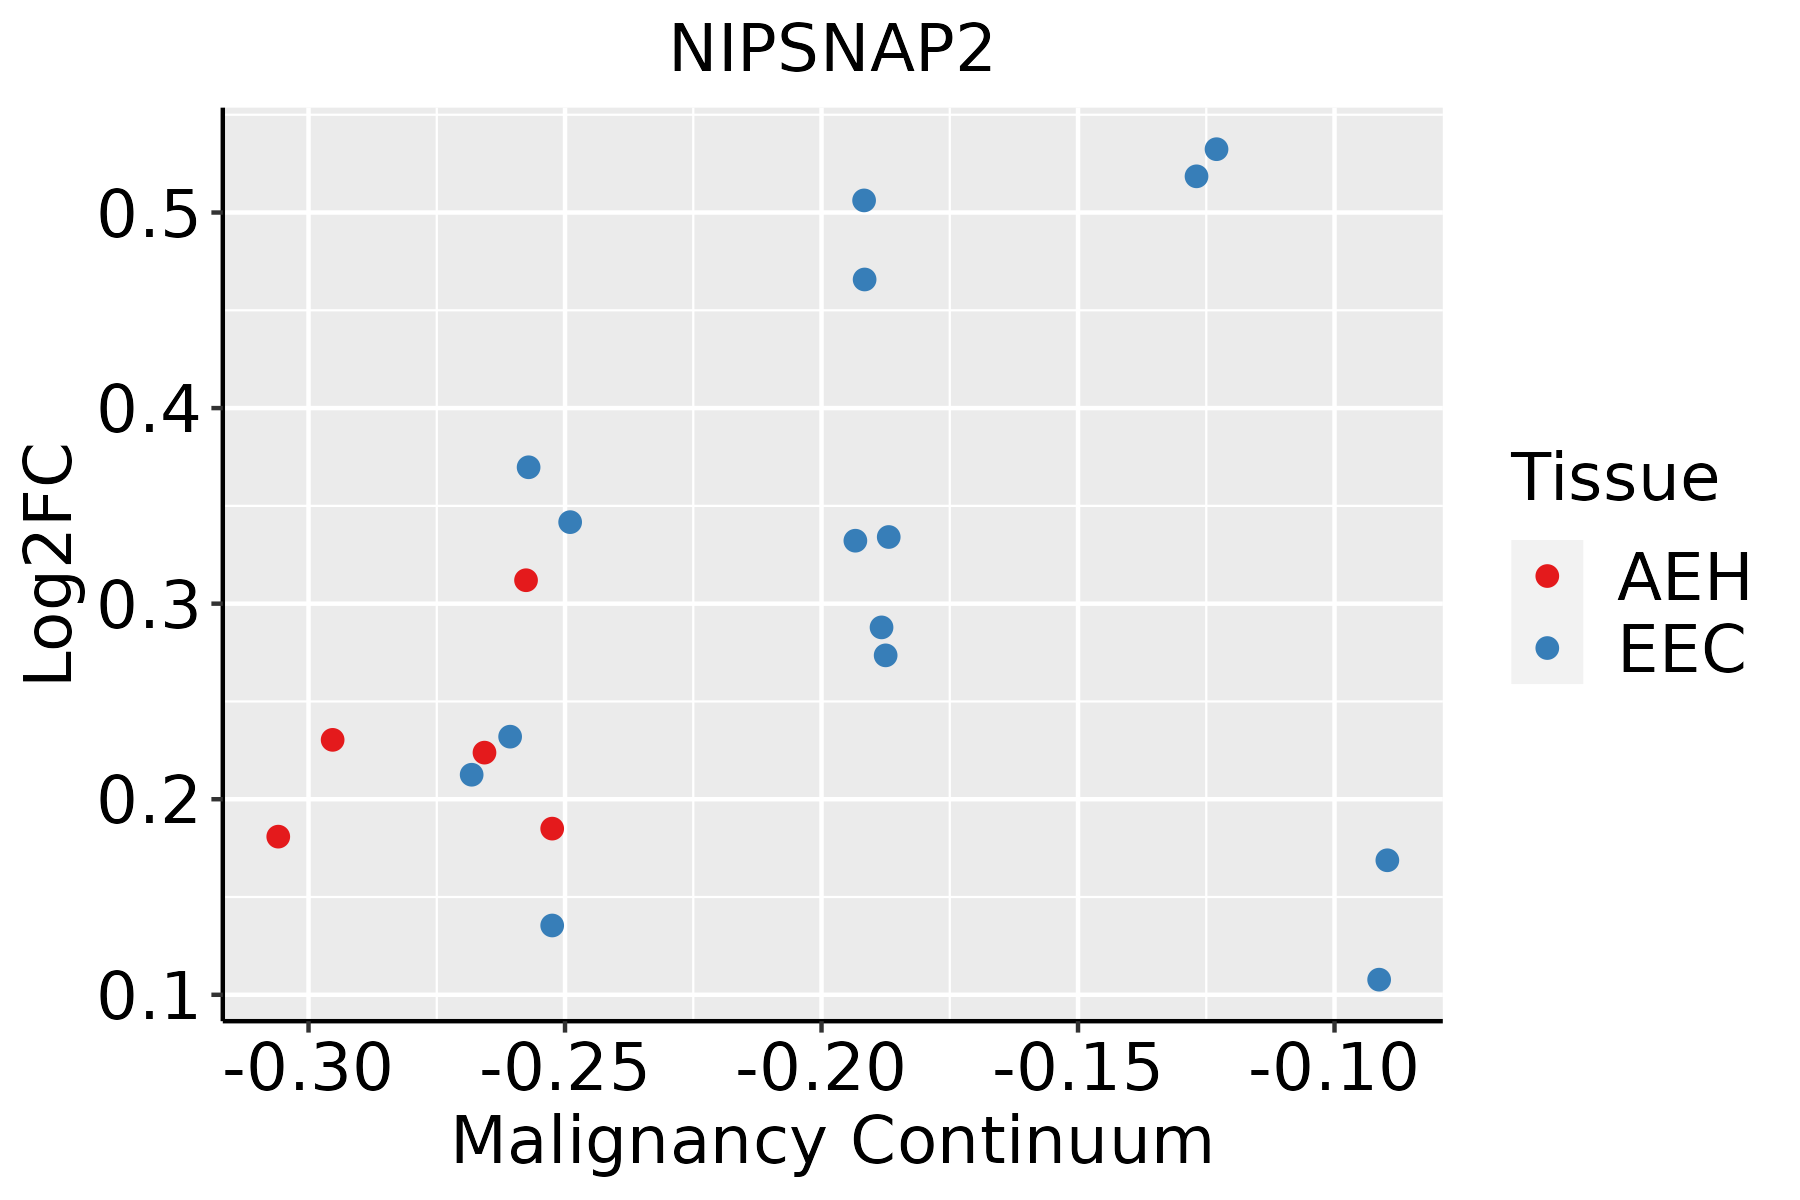 | AEH: Atypical endometrial hyperplasia |
| EEC: Endometrioid Cancer | ||
| Esophagus | 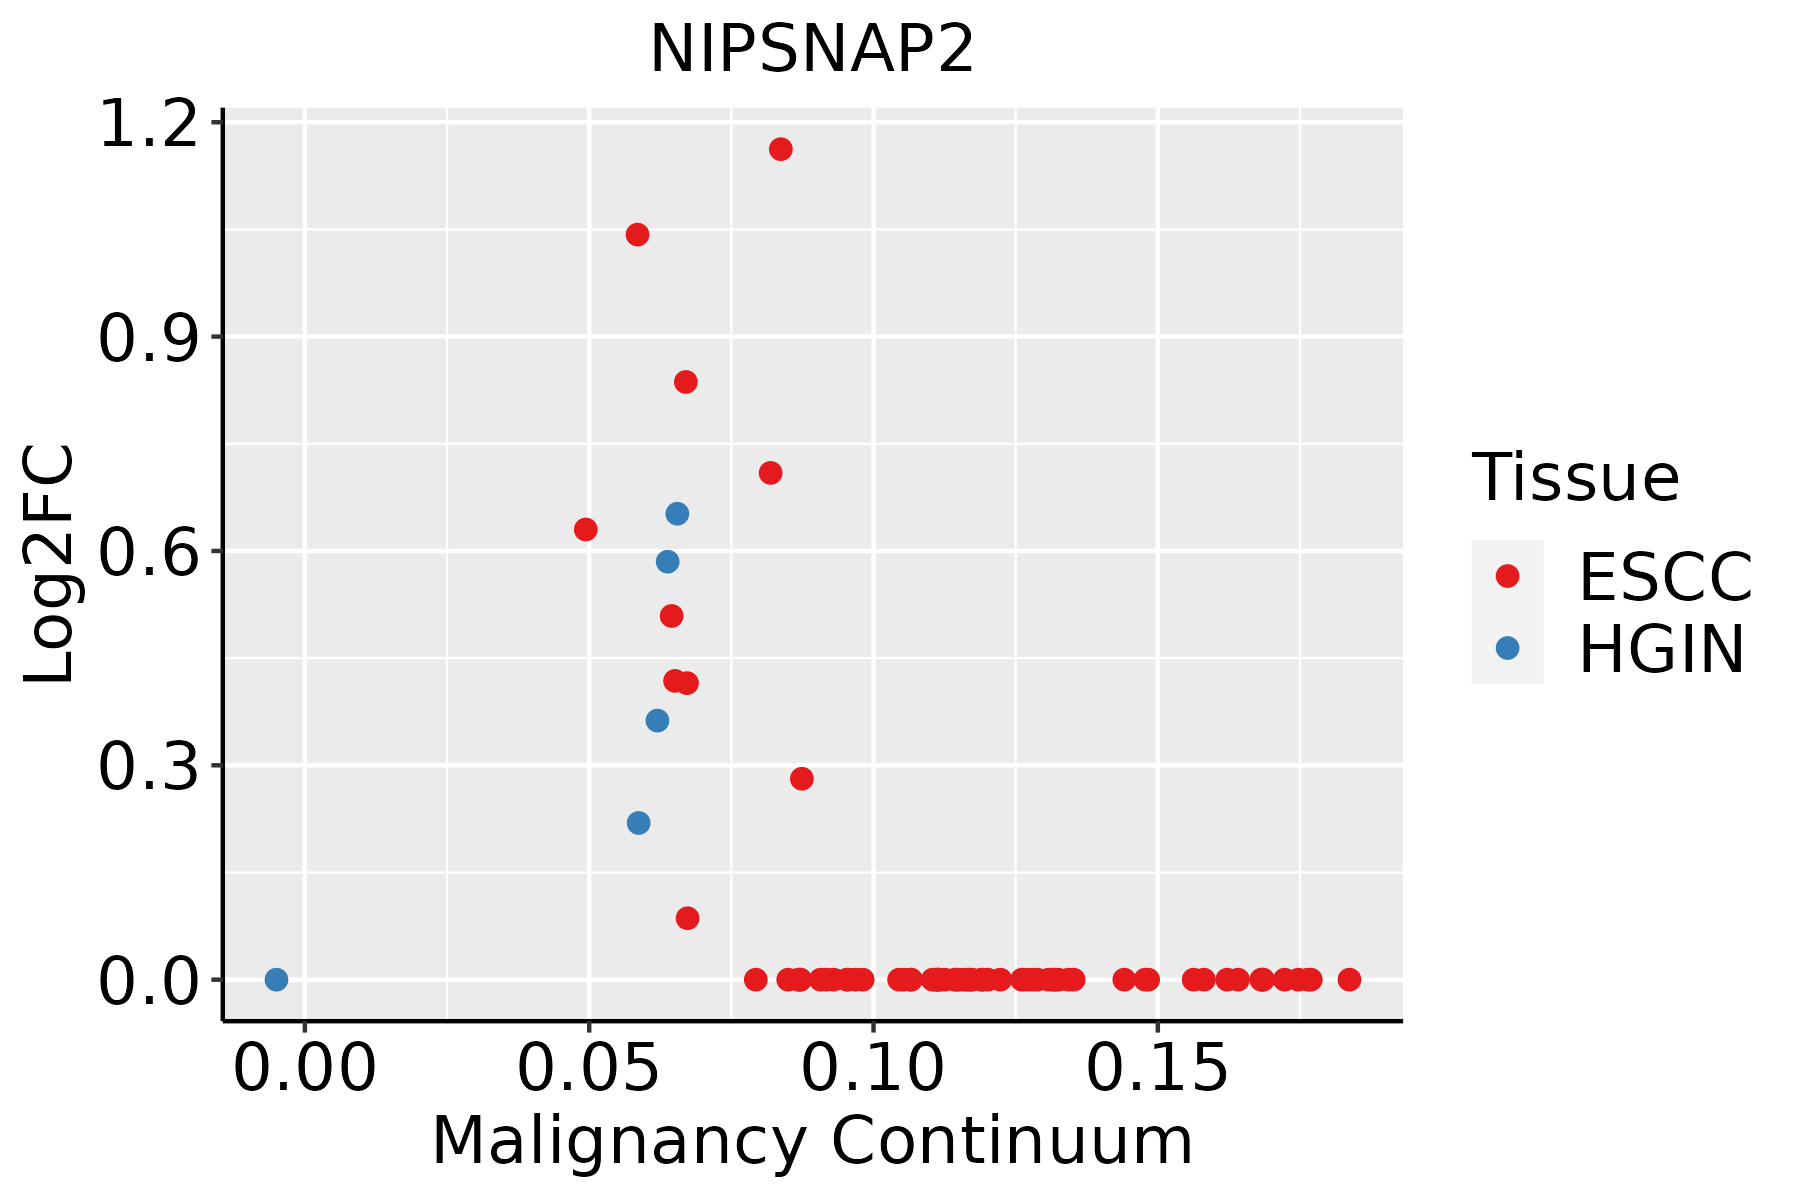 | ESCC: Esophageal squamous cell carcinoma |
| HGIN: High-grade intraepithelial neoplasias | ||
| LGIN: Low-grade intraepithelial neoplasias | ||
| Liver | 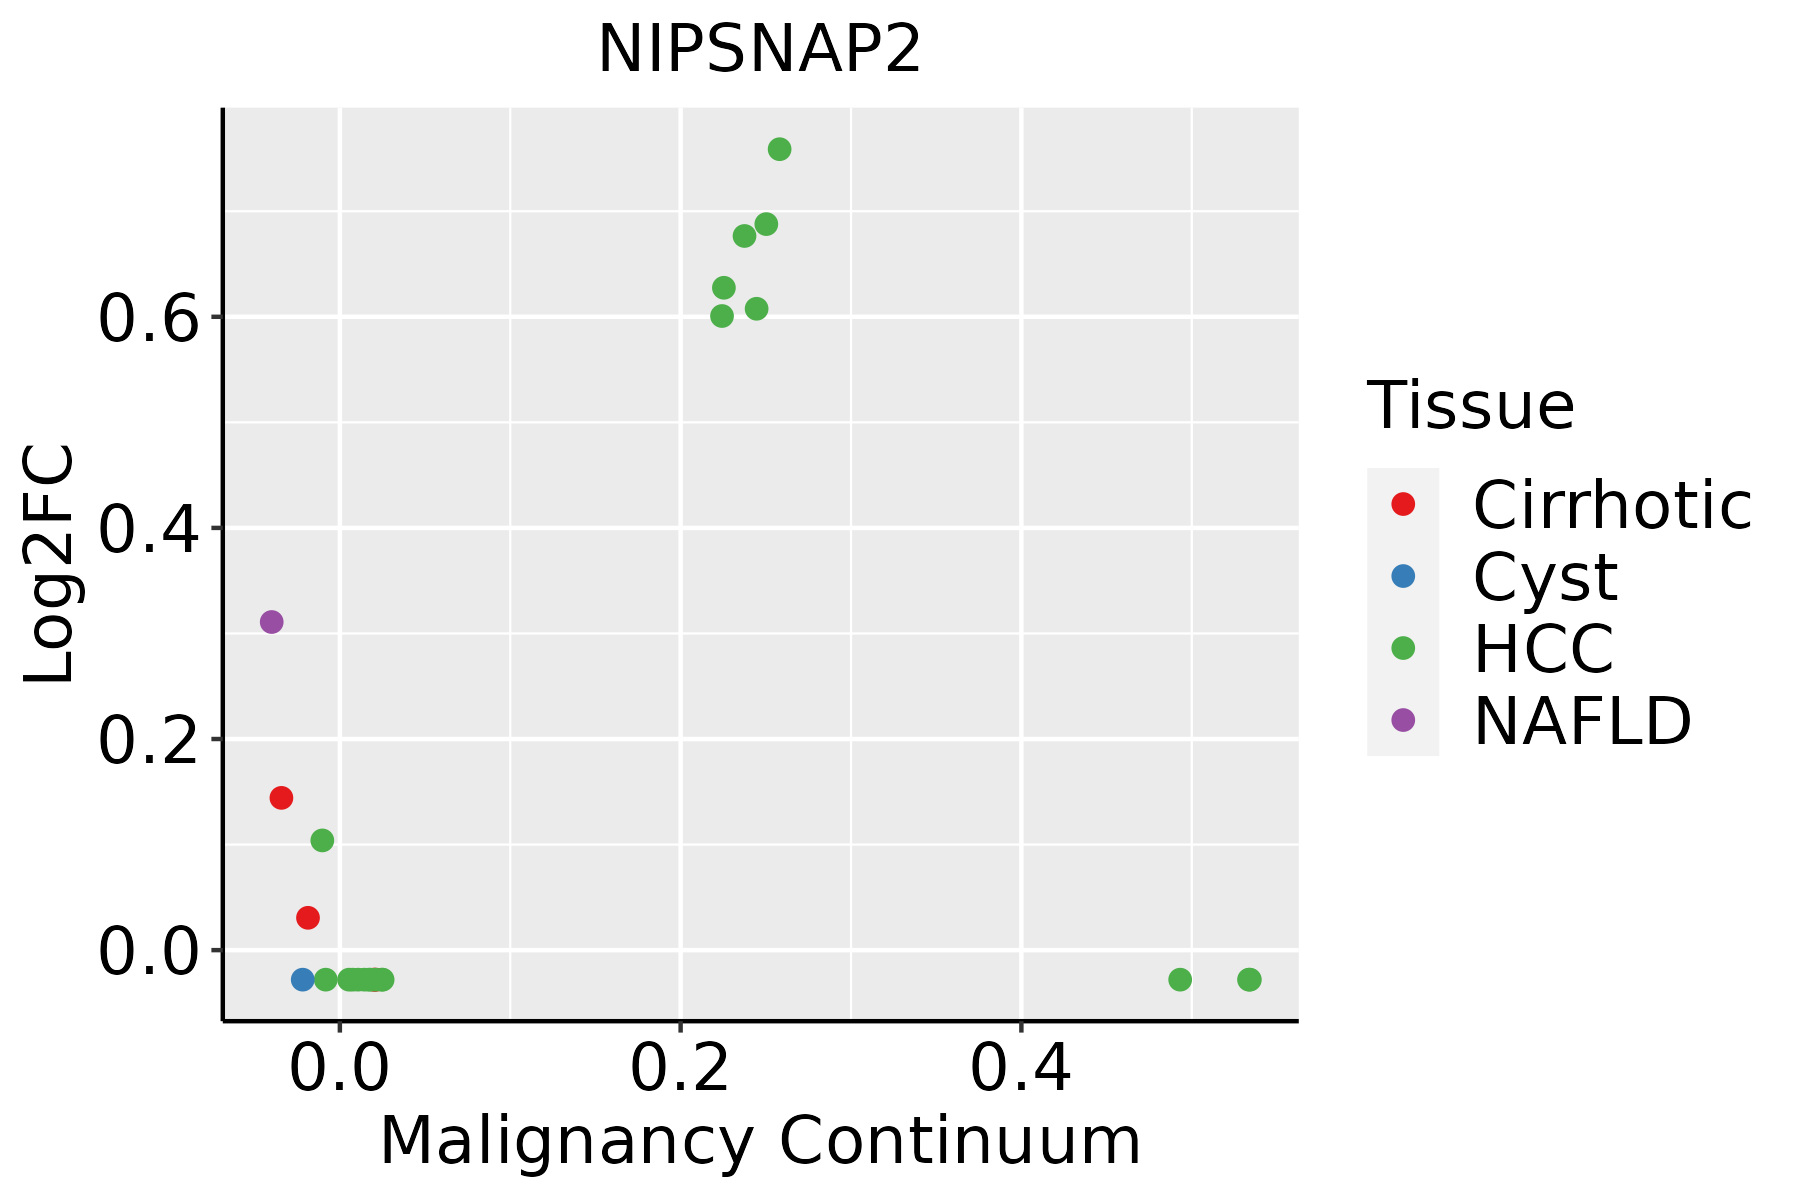 | HCC: Hepatocellular carcinoma |
| NAFLD: Non-alcoholic fatty liver disease | ||
| Lung | 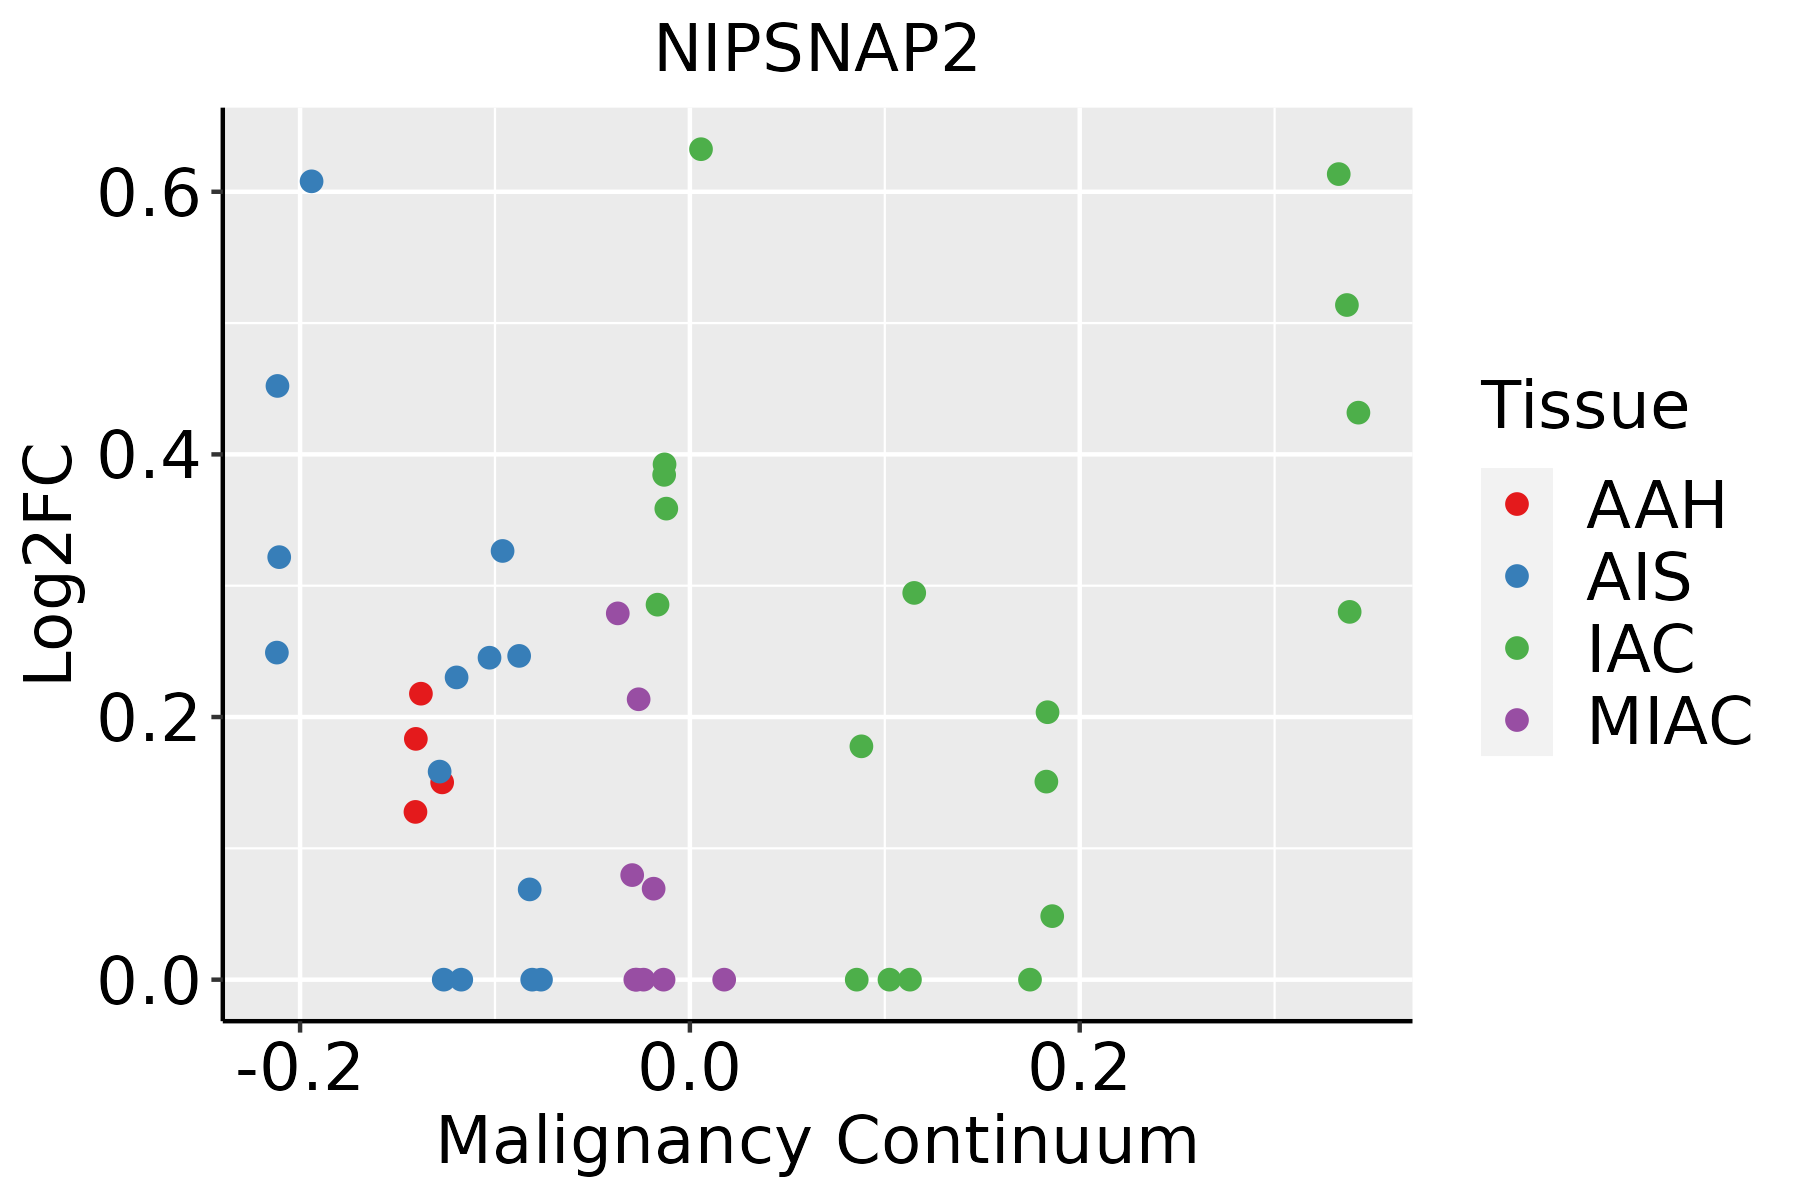 | AAH: Atypical adenomatous hyperplasia |
| AIS: Adenocarcinoma in situ | ||
| IAC: Invasive lung adenocarcinoma | ||
| MIA: Minimally invasive adenocarcinoma | ||
| Thyroid | 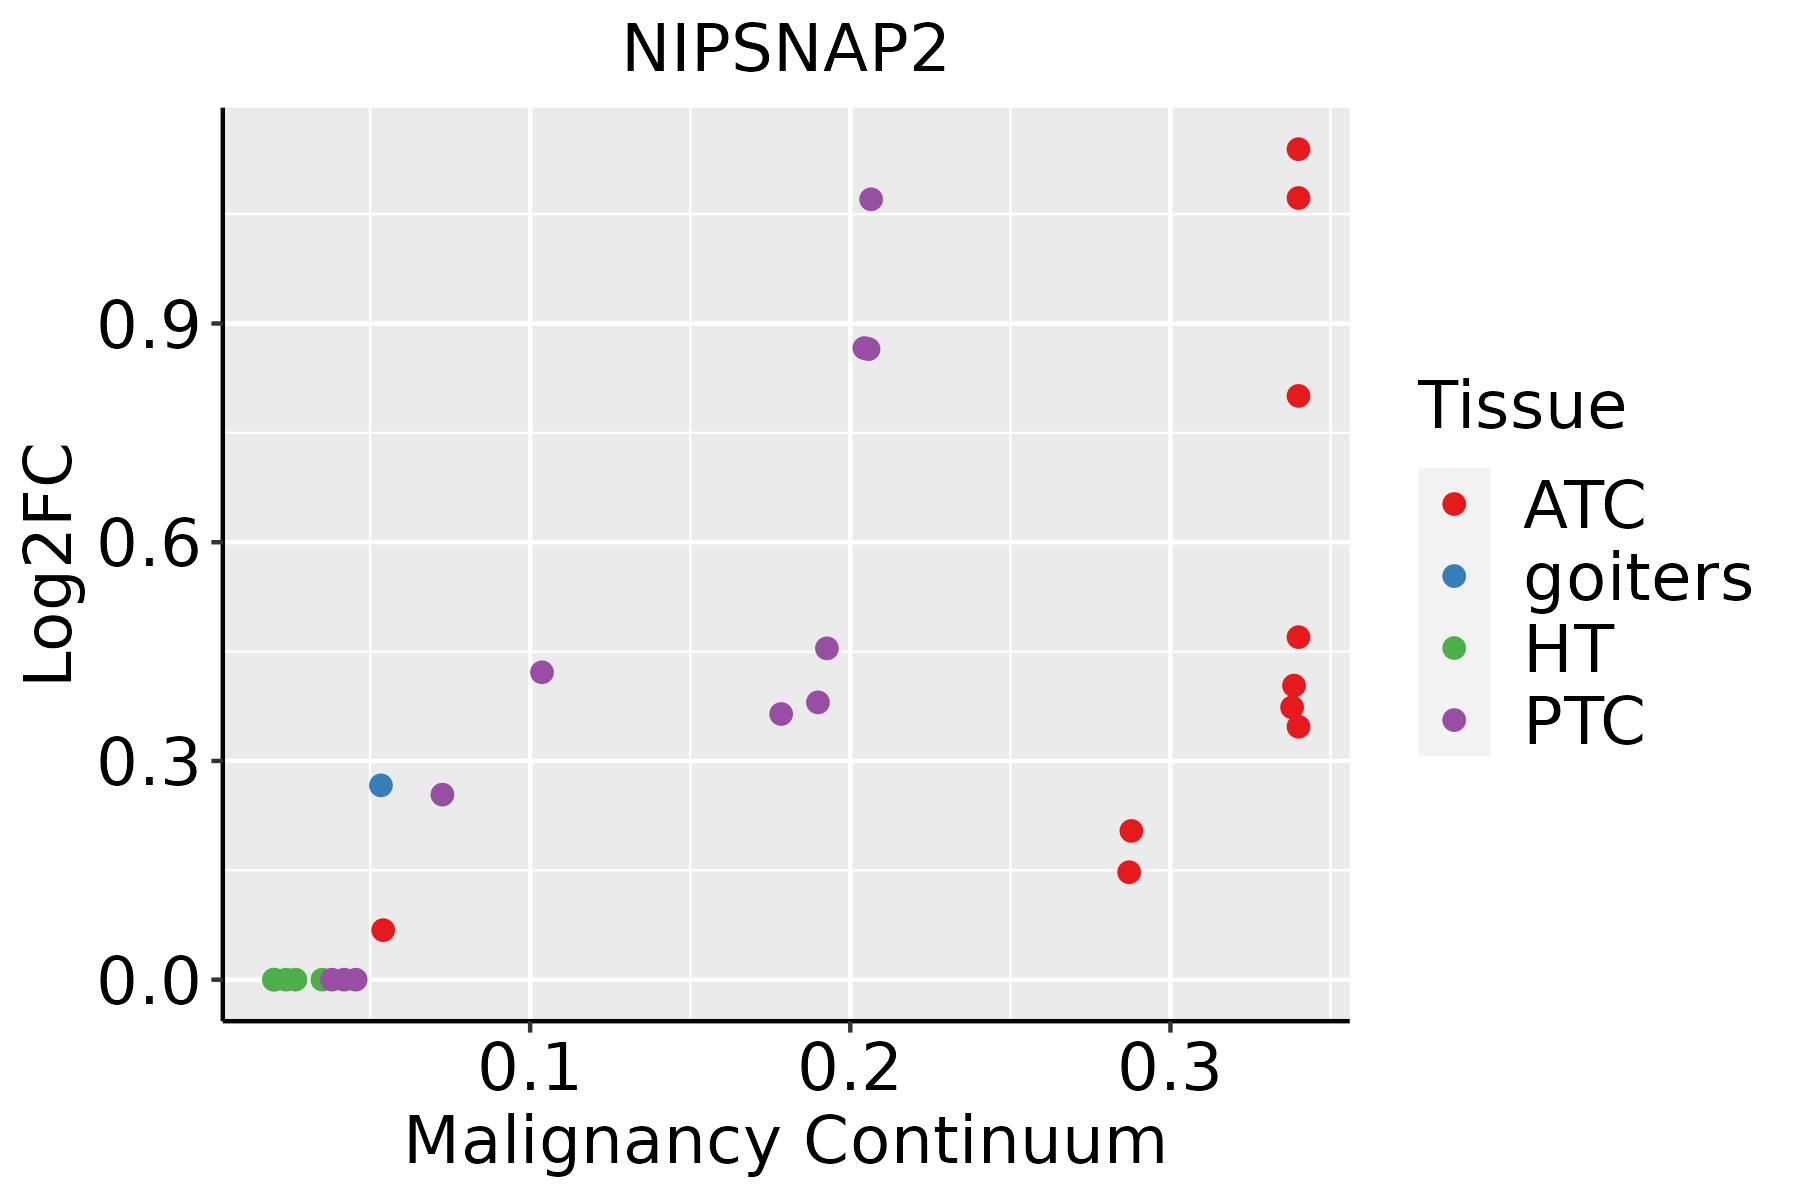 | ATC: Anaplastic thyroid cancer |
| HT: Hashimoto's thyroiditis | ||
| PTC: Papillary thyroid cancer |
| ∗log2FC in expression of this searched gene in stem-like cells from each diseased tissue sample relative to stem-like cells in normal samples in each tissue plotted against the malignancy continuum. Samples are colored based on if they are from different disease stage. |
Top |
Malignant transformation related pathway analysis |
| Find out the enriched GO biological processes and KEGG pathways involved in transition from healthy to precancer to cancer |
| Tissue | Disease Stage | Enriched GO biological Processes |
| Colorectum | AD |  |
| Colorectum | SER |  |
| Colorectum | MSS |  |
| Colorectum | MSI-H |  |
| Colorectum | FAP |  |
| ∗Top 15 enriched GO BP terms are showed in the bar plot of each disease state in each tissue. Each row represents a significant GO biological process which is colored according to the -log10(p.adjust). |
| Page: 1 2 3 4 5 6 7 8 9 |
| GO ID | Tissue | Disease Stage | Description | Gene Ratio | Bg Ratio | pvalue | p.adjust | Count |
| GO:00159804 | Colorectum | FAP | energy derivation by oxidation of organic compounds | 85/2622 | 318/18723 | 1.36e-09 | 2.77e-07 | 85 |
| GO:00090604 | Colorectum | FAP | aerobic respiration | 57/2622 | 189/18723 | 7.02e-09 | 1.02e-06 | 57 |
| GO:00453334 | Colorectum | FAP | cellular respiration | 65/2622 | 230/18723 | 1.13e-08 | 1.33e-06 | 65 |
| GO:00061194 | Colorectum | FAP | oxidative phosphorylation | 43/2622 | 141/18723 | 3.39e-07 | 1.86e-05 | 43 |
| GO:00347641 | Colorectum | FAP | positive regulation of transmembrane transport | 53/2622 | 219/18723 | 3.54e-05 | 7.75e-04 | 53 |
| GO:00228981 | Colorectum | FAP | regulation of transmembrane transporter activity | 62/2622 | 278/18723 | 1.09e-04 | 1.80e-03 | 62 |
| GO:00324121 | Colorectum | FAP | regulation of ion transmembrane transporter activity | 60/2622 | 267/18723 | 1.12e-04 | 1.84e-03 | 60 |
| GO:00324092 | Colorectum | FAP | regulation of transporter activity | 67/2622 | 310/18723 | 1.59e-04 | 2.43e-03 | 67 |
| GO:0010959 | Colorectum | FAP | regulation of metal ion transport | 83/2622 | 406/18723 | 2.06e-04 | 2.96e-03 | 83 |
| GO:0043270 | Colorectum | FAP | positive regulation of ion transport | 58/2622 | 275/18723 | 7.98e-04 | 8.36e-03 | 58 |
| GO:0032414 | Colorectum | FAP | positive regulation of ion transmembrane transporter activity | 28/2622 | 109/18723 | 8.64e-04 | 8.87e-03 | 28 |
| GO:00324113 | Colorectum | FAP | positive regulation of transporter activity | 29/2622 | 120/18723 | 1.97e-03 | 1.65e-02 | 29 |
| GO:0034767 | Colorectum | FAP | positive regulation of ion transmembrane transport | 37/2622 | 167/18723 | 2.74e-03 | 2.12e-02 | 37 |
| GO:1904062 | Colorectum | FAP | regulation of cation transmembrane transport | 69/2622 | 357/18723 | 3.06e-03 | 2.30e-02 | 69 |
| GO:00228982 | Colorectum | CRC | regulation of transmembrane transporter activity | 56/2078 | 278/18723 | 6.75e-06 | 2.58e-04 | 56 |
| GO:00324122 | Colorectum | CRC | regulation of ion transmembrane transporter activity | 54/2078 | 267/18723 | 8.67e-06 | 3.09e-04 | 54 |
| GO:00324093 | Colorectum | CRC | regulation of transporter activity | 59/2078 | 310/18723 | 2.34e-05 | 6.65e-04 | 59 |
| GO:00347642 | Colorectum | CRC | positive regulation of transmembrane transport | 44/2078 | 219/18723 | 6.68e-05 | 1.45e-03 | 44 |
| GO:00460345 | Colorectum | CRC | ATP metabolic process | 51/2078 | 277/18723 | 1.92e-04 | 3.30e-03 | 51 |
| GO:00109591 | Colorectum | CRC | regulation of metal ion transport | 69/2078 | 406/18723 | 2.05e-04 | 3.48e-03 | 69 |
| Page: 1 2 3 4 5 6 |
| Pathway ID | Tissue | Disease Stage | Description | Gene Ratio | Bg Ratio | pvalue | p.adjust | qvalue | Count |
| Page: 1 |
Top |
Cell-cell communication analysis |
| Identification of potential cell-cell interactions between two cell types and their ligand-receptor pairs for different disease states |
| Ligand | Receptor | LRpair | Pathway | Tissue | Disease Stage |
| Page: 1 |
Top |
Single-cell gene regulatory network inference analysis |
| Find out the significant the regulons (TFs) and the target genes of each regulon across cell types for different disease states |
| TF | Cell Type | Tissue | Disease Stage | Target Gene | RSS | Regulon Activity |
| ∗The dot plots of a searched regulon are shown for all cell subpopulations in each disease state of each tissue based on the regulon specific score inferred using pySCENIC and by calculating the average expression. |
| Page: 1 |
Top |
Somatic mutation of malignant transformation related genes |
| Annotation of somatic variants for genes involved in malignant transformation |
| Hugo Symbol | Variant Class | Variant Classification | dbSNP RS | HGVSc | HGVSp | HGVSp Short | SWISSPROT | BIOTYPE | SIFT | PolyPhen | Tumor Sample Barcode | Tissue | Histology | Sex | Age | Stage | Therapy Types | Drugs | Outcome |
| Page: 1 |
Top |
Related drugs of malignant transformation related genes |
| Identification of chemicals and drugs interact with genes involved in malignant transfromation |
| (DGIdb 4.0) |
| Entrez ID | Symbol | Category | Interaction Types | Drug Claim Name | Drug Name | PMIDs |
| Page: 1 |

Copyright 2023-Present -The University of Texas Health Science Center at Houston |