
|
|||||
|
 | |
| |
| |
| |
| |
| |
|
Gene: NFKBIL1 |
Gene summary for NFKBIL1 |
| Gene information | Species | Human | Gene symbol | NFKBIL1 | Gene ID | 4795 |
| Gene name | NFKB inhibitor like 1 | |
| Gene Alias | IKBL | |
| Cytomap | 6p21.33 | |
| Gene Type | protein-coding | GO ID | GO:0001816 | UniProtAcc | A0A0A0MRT5 |
Top |
Malignant transformation analysis |
| Identification of the aberrant gene expression in precancerous and cancerous lesions by comparing the gene expression of stem-like cells in diseased tissues with normal stem cells |
| Entrez ID | Symbol | Replicates | Species | Organ | Tissue | Adj P-value | Log2FC | Malignancy |
| 4795 | NFKBIL1 | LZE4T | Human | Esophagus | ESCC | 1.52e-11 | 1.68e-01 | 0.0811 |
| 4795 | NFKBIL1 | LZE7T | Human | Esophagus | ESCC | 1.16e-08 | 3.48e-01 | 0.0667 |
| 4795 | NFKBIL1 | LZE8T | Human | Esophagus | ESCC | 3.36e-02 | 1.17e-01 | 0.067 |
| 4795 | NFKBIL1 | LZE20T | Human | Esophagus | ESCC | 4.50e-08 | 2.39e-01 | 0.0662 |
| 4795 | NFKBIL1 | LZE22T | Human | Esophagus | ESCC | 1.73e-03 | 3.06e-01 | 0.068 |
| 4795 | NFKBIL1 | LZE24T | Human | Esophagus | ESCC | 1.20e-24 | 6.35e-01 | 0.0596 |
| 4795 | NFKBIL1 | LZE22D3 | Human | Esophagus | HGIN | 4.70e-03 | 5.02e-01 | 0.0653 |
| 4795 | NFKBIL1 | LZE6T | Human | Esophagus | ESCC | 4.74e-03 | 2.28e-01 | 0.0845 |
| 4795 | NFKBIL1 | P1T-E | Human | Esophagus | ESCC | 5.38e-10 | 4.87e-01 | 0.0875 |
| 4795 | NFKBIL1 | P2T-E | Human | Esophagus | ESCC | 7.18e-32 | 5.29e-01 | 0.1177 |
| 4795 | NFKBIL1 | P4T-E | Human | Esophagus | ESCC | 1.43e-29 | 6.31e-01 | 0.1323 |
| 4795 | NFKBIL1 | P5T-E | Human | Esophagus | ESCC | 6.38e-27 | 4.32e-01 | 0.1327 |
| 4795 | NFKBIL1 | P8T-E | Human | Esophagus | ESCC | 2.74e-15 | 2.16e-01 | 0.0889 |
| 4795 | NFKBIL1 | P9T-E | Human | Esophagus | ESCC | 1.36e-14 | 2.31e-01 | 0.1131 |
| 4795 | NFKBIL1 | P10T-E | Human | Esophagus | ESCC | 1.14e-23 | 5.09e-01 | 0.116 |
| 4795 | NFKBIL1 | P11T-E | Human | Esophagus | ESCC | 1.65e-16 | 5.58e-01 | 0.1426 |
| 4795 | NFKBIL1 | P12T-E | Human | Esophagus | ESCC | 3.95e-24 | 4.28e-01 | 0.1122 |
| 4795 | NFKBIL1 | P15T-E | Human | Esophagus | ESCC | 3.73e-16 | 3.08e-01 | 0.1149 |
| 4795 | NFKBIL1 | P16T-E | Human | Esophagus | ESCC | 2.83e-27 | 5.83e-01 | 0.1153 |
| 4795 | NFKBIL1 | P17T-E | Human | Esophagus | ESCC | 3.71e-21 | 5.14e-01 | 0.1278 |
| Page: 1 2 3 4 5 6 |
| Tissue | Expression Dynamics | Abbreviation |
| Esophagus | 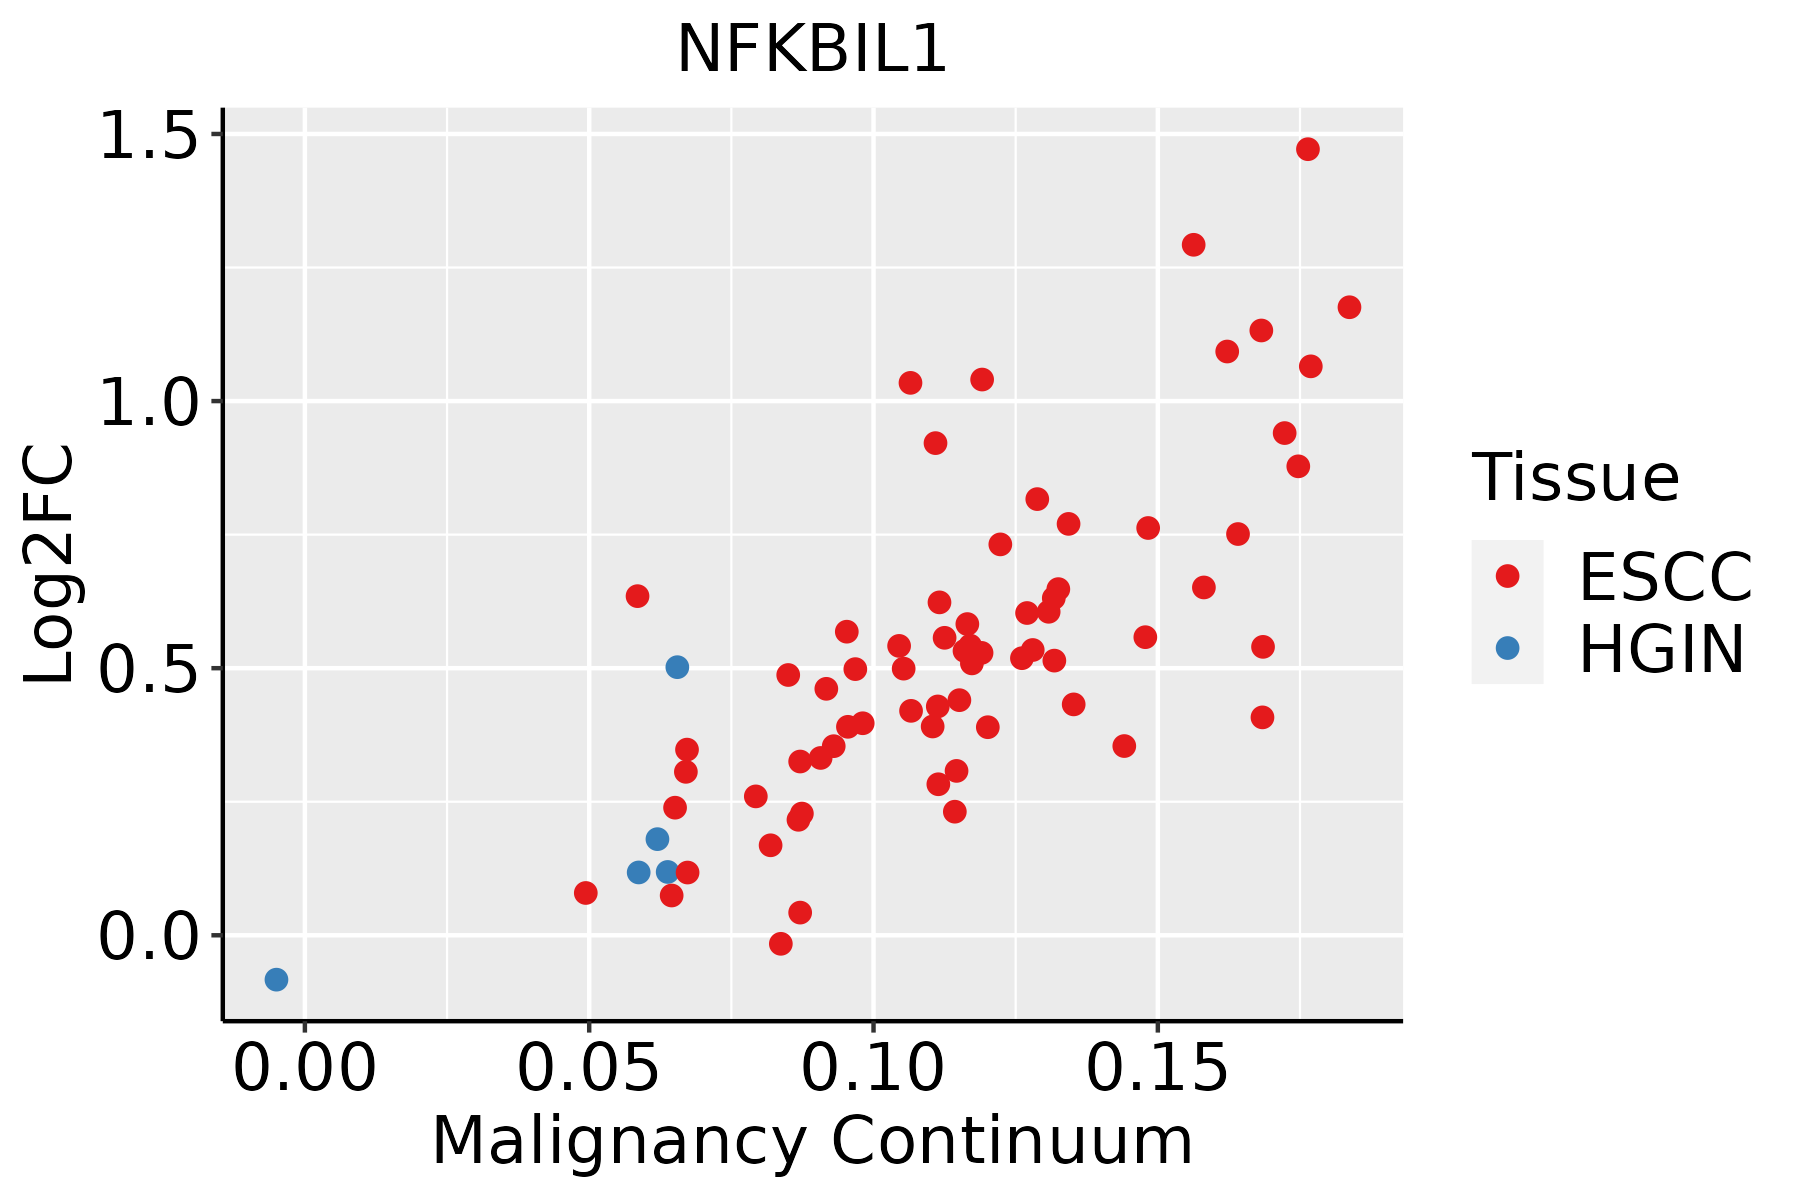 | ESCC: Esophageal squamous cell carcinoma |
| HGIN: High-grade intraepithelial neoplasias | ||
| LGIN: Low-grade intraepithelial neoplasias | ||
| Liver | 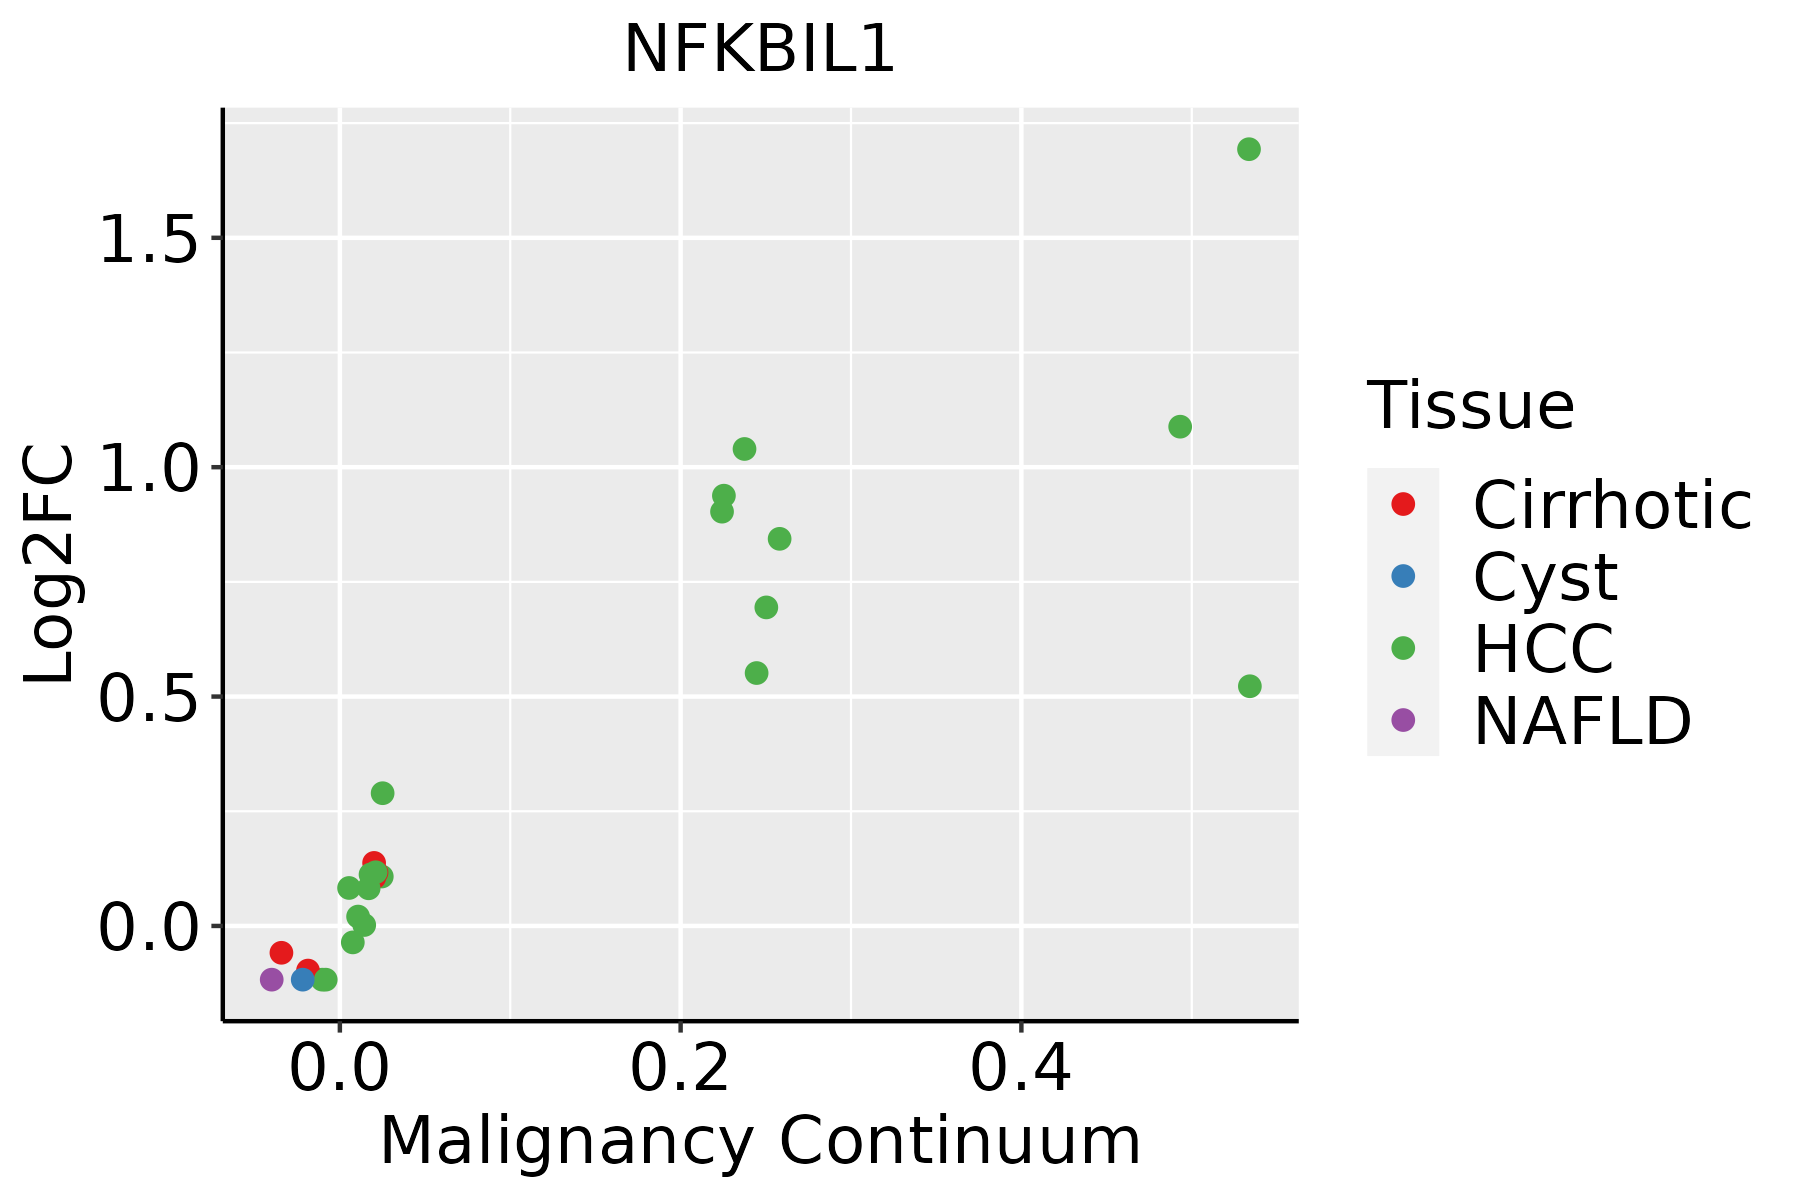 | HCC: Hepatocellular carcinoma |
| NAFLD: Non-alcoholic fatty liver disease | ||
| Oral Cavity |  | EOLP: Erosive Oral lichen planus |
| LP: leukoplakia | ||
| NEOLP: Non-erosive oral lichen planus | ||
| OSCC: Oral squamous cell carcinoma | ||
| Thyroid | 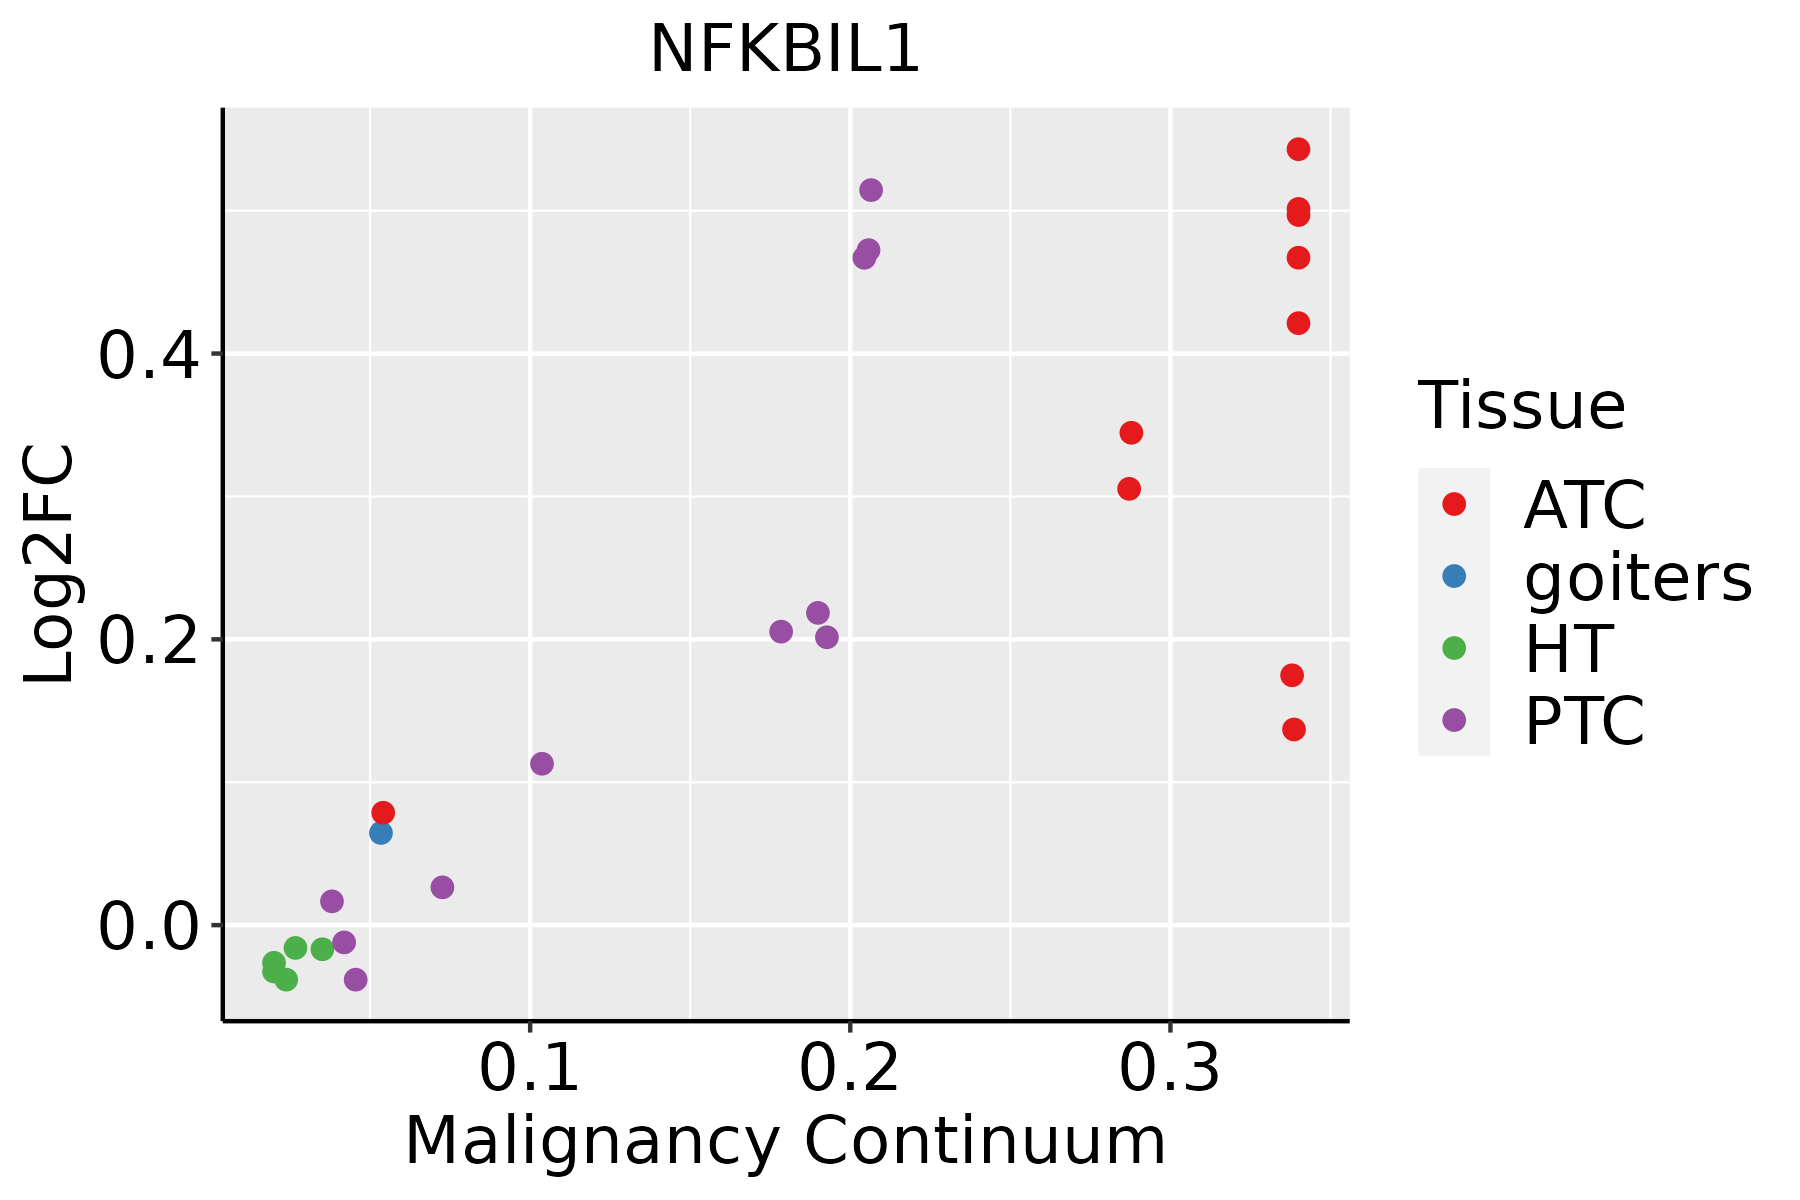 | ATC: Anaplastic thyroid cancer |
| HT: Hashimoto's thyroiditis | ||
| PTC: Papillary thyroid cancer |
| ∗log2FC in expression of this searched gene in stem-like cells from each diseased tissue sample relative to stem-like cells in normal samples in each tissue plotted against the malignancy continuum. Samples are colored based on if they are from different disease stage. |
Top |
Malignant transformation related pathway analysis |
| Find out the enriched GO biological processes and KEGG pathways involved in transition from healthy to precancer to cancer |
| Tissue | Disease Stage | Enriched GO biological Processes |
| Colorectum | AD |  |
| Colorectum | SER |  |
| Colorectum | MSS |  |
| Colorectum | MSI-H |  |
| Colorectum | FAP |  |
| ∗Top 15 enriched GO BP terms are showed in the bar plot of each disease state in each tissue. Each row represents a significant GO biological process which is colored according to the -log10(p.adjust). |
| Page: 1 2 3 4 5 6 7 8 9 |
| GO ID | Tissue | Disease Stage | Description | Gene Ratio | Bg Ratio | pvalue | p.adjust | Count |
| GO:00028321 | Liver | HCC | negative regulation of response to biotic stimulus | 66/7958 | 108/18723 | 7.24e-05 | 6.50e-04 | 66 |
| GO:00028312 | Liver | HCC | regulation of response to biotic stimulus | 173/7958 | 327/18723 | 8.55e-05 | 7.48e-04 | 173 |
| GO:00510902 | Liver | HCC | regulation of DNA-binding transcription factor activity | 220/7958 | 440/18723 | 8.04e-04 | 4.82e-03 | 220 |
| GO:003249611 | Liver | HCC | response to lipopolysaccharide | 174/7958 | 343/18723 | 1.19e-03 | 6.62e-03 | 174 |
| GO:00712166 | Liver | HCC | cellular response to biotic stimulus | 128/7958 | 246/18723 | 1.53e-03 | 8.10e-03 | 128 |
| GO:00712226 | Liver | HCC | cellular response to lipopolysaccharide | 110/7958 | 209/18723 | 1.92e-03 | 9.77e-03 | 110 |
| GO:000223711 | Liver | HCC | response to molecule of bacterial origin | 181/7958 | 363/18723 | 2.58e-03 | 1.24e-02 | 181 |
| GO:0002224 | Liver | HCC | toll-like receptor signaling pathway | 67/7958 | 121/18723 | 2.87e-03 | 1.34e-02 | 67 |
| GO:00622072 | Liver | HCC | regulation of pattern recognition receptor signaling pathway | 59/7958 | 105/18723 | 3.18e-03 | 1.47e-02 | 59 |
| GO:0031663 | Liver | HCC | lipopolysaccharide-mediated signaling pathway | 36/7958 | 60/18723 | 4.68e-03 | 2.01e-02 | 36 |
| GO:00712196 | Liver | HCC | cellular response to molecule of bacterial origin | 113/7958 | 221/18723 | 5.73e-03 | 2.38e-02 | 113 |
| GO:000724910 | Oral cavity | OSCC | I-kappaB kinase/NF-kappaB signaling | 169/7305 | 281/18723 | 4.69e-13 | 2.25e-11 | 169 |
| GO:00028317 | Oral cavity | OSCC | regulation of response to biotic stimulus | 177/7305 | 327/18723 | 1.73e-08 | 3.43e-07 | 177 |
| GO:003249617 | Oral cavity | OSCC | response to lipopolysaccharide | 178/7305 | 343/18723 | 7.27e-07 | 1.03e-05 | 178 |
| GO:00510907 | Oral cavity | OSCC | regulation of DNA-binding transcription factor activity | 221/7305 | 440/18723 | 9.06e-07 | 1.23e-05 | 221 |
| GO:00028324 | Oral cavity | OSCC | negative regulation of response to biotic stimulus | 65/7305 | 108/18723 | 6.62e-06 | 7.29e-05 | 65 |
| GO:00022214 | Oral cavity | OSCC | pattern recognition receptor signaling pathway | 95/7305 | 172/18723 | 1.11e-05 | 1.15e-04 | 95 |
| GO:007121615 | Oral cavity | OSCC | cellular response to biotic stimulus | 129/7305 | 246/18723 | 1.20e-05 | 1.23e-04 | 129 |
| GO:000223717 | Oral cavity | OSCC | response to molecule of bacterial origin | 181/7305 | 363/18723 | 1.48e-05 | 1.49e-04 | 181 |
| GO:007122210 | Oral cavity | OSCC | cellular response to lipopolysaccharide | 110/7305 | 209/18723 | 4.15e-05 | 3.60e-04 | 110 |
| Page: 1 2 3 4 |
| Pathway ID | Tissue | Disease Stage | Description | Gene Ratio | Bg Ratio | pvalue | p.adjust | qvalue | Count |
| Page: 1 |
Top |
Cell-cell communication analysis |
| Identification of potential cell-cell interactions between two cell types and their ligand-receptor pairs for different disease states |
| Ligand | Receptor | LRpair | Pathway | Tissue | Disease Stage |
| Page: 1 |
Top |
Single-cell gene regulatory network inference analysis |
| Find out the significant the regulons (TFs) and the target genes of each regulon across cell types for different disease states |
| TF | Cell Type | Tissue | Disease Stage | Target Gene | RSS | Regulon Activity |
| ∗The dot plots of a searched regulon are shown for all cell subpopulations in each disease state of each tissue based on the regulon specific score inferred using pySCENIC and by calculating the average expression. |
| Page: 1 |
Top |
Somatic mutation of malignant transformation related genes |
| Annotation of somatic variants for genes involved in malignant transformation |
| Hugo Symbol | Variant Class | Variant Classification | dbSNP RS | HGVSc | HGVSp | HGVSp Short | SWISSPROT | BIOTYPE | SIFT | PolyPhen | Tumor Sample Barcode | Tissue | Histology | Sex | Age | Stage | Therapy Types | Drugs | Outcome |
| NFKBIL1 | SNV | Missense_Mutation | novel | c.766N>C | p.Glu256Gln | p.E256Q | Q9UBC1 | protein_coding | tolerated(0.05) | probably_damaging(0.92) | TCGA-VS-A8QM-01 | Cervix | cervical & endocervical cancer | Female | <65 | I/II | Chemotherapy | cisplatin | PD |
| NFKBIL1 | SNV | Missense_Mutation | c.434N>A | p.Gly145Glu | p.G145E | Q9UBC1 | protein_coding | tolerated(1) | benign(0.075) | TCGA-AA-3811-01 | Colorectum | colon adenocarcinoma | Female | >=65 | III/IV | Unknown | Unknown | PD | |
| NFKBIL1 | SNV | Missense_Mutation | c.648G>T | p.Gln216His | p.Q216H | Q9UBC1 | protein_coding | tolerated(0.1) | benign(0.435) | TCGA-AZ-4615-01 | Colorectum | colon adenocarcinoma | Male | >=65 | III/IV | Chemotherapy | xeloda | PD | |
| NFKBIL1 | SNV | Missense_Mutation | c.857N>G | p.Pro286Arg | p.P286R | Q9UBC1 | protein_coding | tolerated(0.5) | benign(0.197) | TCGA-F5-6863-01 | Colorectum | rectum adenocarcinoma | Female | >=65 | III/IV | Chemotherapy | etoposide | SD | |
| NFKBIL1 | SNV | Missense_Mutation | novel | c.368N>A | p.Arg123His | p.R123H | Q9UBC1 | protein_coding | tolerated(0.45) | benign(0.203) | TCGA-AP-A0LS-01 | Endometrium | uterine corpus endometrioid carcinoma | Female | <65 | I/II | Unknown | Unknown | SD |
| NFKBIL1 | SNV | Missense_Mutation | novel | c.172N>T | p.Gly58Cys | p.G58C | Q9UBC1 | protein_coding | deleterious(0.03) | possibly_damaging(0.68) | TCGA-AP-A1DK-01 | Endometrium | uterine corpus endometrioid carcinoma | Female | <65 | I/II | Unknown | Unknown | SD |
| NFKBIL1 | SNV | Missense_Mutation | rs776864117 | c.653N>A | p.Arg218Gln | p.R218Q | Q9UBC1 | protein_coding | tolerated(0.38) | benign(0.005) | TCGA-AX-A2HD-01 | Endometrium | uterine corpus endometrioid carcinoma | Female | >=65 | III/IV | Unknown | Unknown | SD |
| NFKBIL1 | SNV | Missense_Mutation | rs771750904 | c.610C>T | p.Arg204Cys | p.R204C | Q9UBC1 | protein_coding | tolerated(0.06) | benign(0.245) | TCGA-B5-A3FA-01 | Endometrium | uterine corpus endometrioid carcinoma | Female | >=65 | I/II | Unknown | Unknown | SD |
| NFKBIL1 | SNV | Missense_Mutation | rs544896018 | c.367N>T | p.Arg123Cys | p.R123C | Q9UBC1 | protein_coding | deleterious(0) | probably_damaging(0.921) | TCGA-D1-A176-01 | Endometrium | uterine corpus endometrioid carcinoma | Female | >=65 | I/II | Unknown | Unknown | SD |
| NFKBIL1 | SNV | Missense_Mutation | rs199596929 | c.772N>T | p.Arg258Cys | p.R258C | Q9UBC1 | protein_coding | tolerated(0.06) | benign(0.044) | TCGA-EO-A22U-01 | Endometrium | uterine corpus endometrioid carcinoma | Female | >=65 | I/II | Unknown | Unknown | SD |
| Page: 1 2 3 |
Top |
Related drugs of malignant transformation related genes |
| Identification of chemicals and drugs interact with genes involved in malignant transfromation |
| (DGIdb 4.0) |
| Entrez ID | Symbol | Category | Interaction Types | Drug Claim Name | Drug Name | PMIDs |
| 4795 | NFKBIL1 | NA | IFN | 16362817 |
| Page: 1 |

Copyright 2023-Present -The University of Texas Health Science Center at Houston |