
|
|||||
|
 | |
| |
| |
| |
| |
| |
|
Gene: NES |
Gene summary for NES |
| Gene information | Species | Human | Gene symbol | NES | Gene ID | 10763 |
| Gene name | nestin | |
| Gene Alias | Nbla00170 | |
| Cytomap | 1q23.1 | |
| Gene Type | protein-coding | GO ID | GO:0000086 | UniProtAcc | P48681 |
Top |
Malignant transformation analysis |
| Identification of the aberrant gene expression in precancerous and cancerous lesions by comparing the gene expression of stem-like cells in diseased tissues with normal stem cells |
| Entrez ID | Symbol | Replicates | Species | Organ | Tissue | Adj P-value | Log2FC | Malignancy |
| 10763 | NES | P4T-E | Human | Esophagus | ESCC | 6.87e-03 | 3.93e-01 | 0.1323 |
| 10763 | NES | P11T-E | Human | Esophagus | ESCC | 1.74e-16 | 1.44e+00 | 0.1426 |
| 10763 | NES | P12T-E | Human | Esophagus | ESCC | 1.15e-02 | 1.45e-01 | 0.1122 |
| 10763 | NES | P15T-E | Human | Esophagus | ESCC | 3.26e-02 | 1.65e-01 | 0.1149 |
| 10763 | NES | P19T-E | Human | Esophagus | ESCC | 1.65e-09 | 1.55e+00 | 0.1662 |
| 10763 | NES | P24T-E | Human | Esophagus | ESCC | 7.68e-19 | 9.49e-01 | 0.1287 |
| 10763 | NES | P26T-E | Human | Esophagus | ESCC | 1.78e-11 | 1.97e-01 | 0.1276 |
| 10763 | NES | P28T-E | Human | Esophagus | ESCC | 7.62e-30 | 6.51e-01 | 0.1149 |
| 10763 | NES | P30T-E | Human | Esophagus | ESCC | 8.72e-05 | 3.14e-01 | 0.137 |
| 10763 | NES | P32T-E | Human | Esophagus | ESCC | 3.10e-12 | 8.51e-01 | 0.1666 |
| 10763 | NES | P36T-E | Human | Esophagus | ESCC | 2.23e-14 | 6.92e-01 | 0.1187 |
| 10763 | NES | P37T-E | Human | Esophagus | ESCC | 2.92e-23 | 6.69e-01 | 0.1371 |
| 10763 | NES | P44T-E | Human | Esophagus | ESCC | 8.95e-05 | 3.08e-01 | 0.1096 |
| 10763 | NES | P47T-E | Human | Esophagus | ESCC | 6.33e-03 | 4.81e-02 | 0.1067 |
| 10763 | NES | P49T-E | Human | Esophagus | ESCC | 2.03e-09 | 1.20e+00 | 0.1768 |
| 10763 | NES | P56T-E | Human | Esophagus | ESCC | 3.52e-04 | 7.00e-01 | 0.1613 |
| 10763 | NES | P61T-E | Human | Esophagus | ESCC | 3.60e-08 | 2.92e-01 | 0.099 |
| 10763 | NES | P74T-E | Human | Esophagus | ESCC | 4.99e-08 | 2.81e-01 | 0.1479 |
| 10763 | NES | P76T-E | Human | Esophagus | ESCC | 1.14e-06 | 3.15e-01 | 0.1207 |
| 10763 | NES | P79T-E | Human | Esophagus | ESCC | 1.63e-09 | 2.77e-01 | 0.1154 |
| Page: 1 2 3 |
| Tissue | Expression Dynamics | Abbreviation |
| Esophagus | 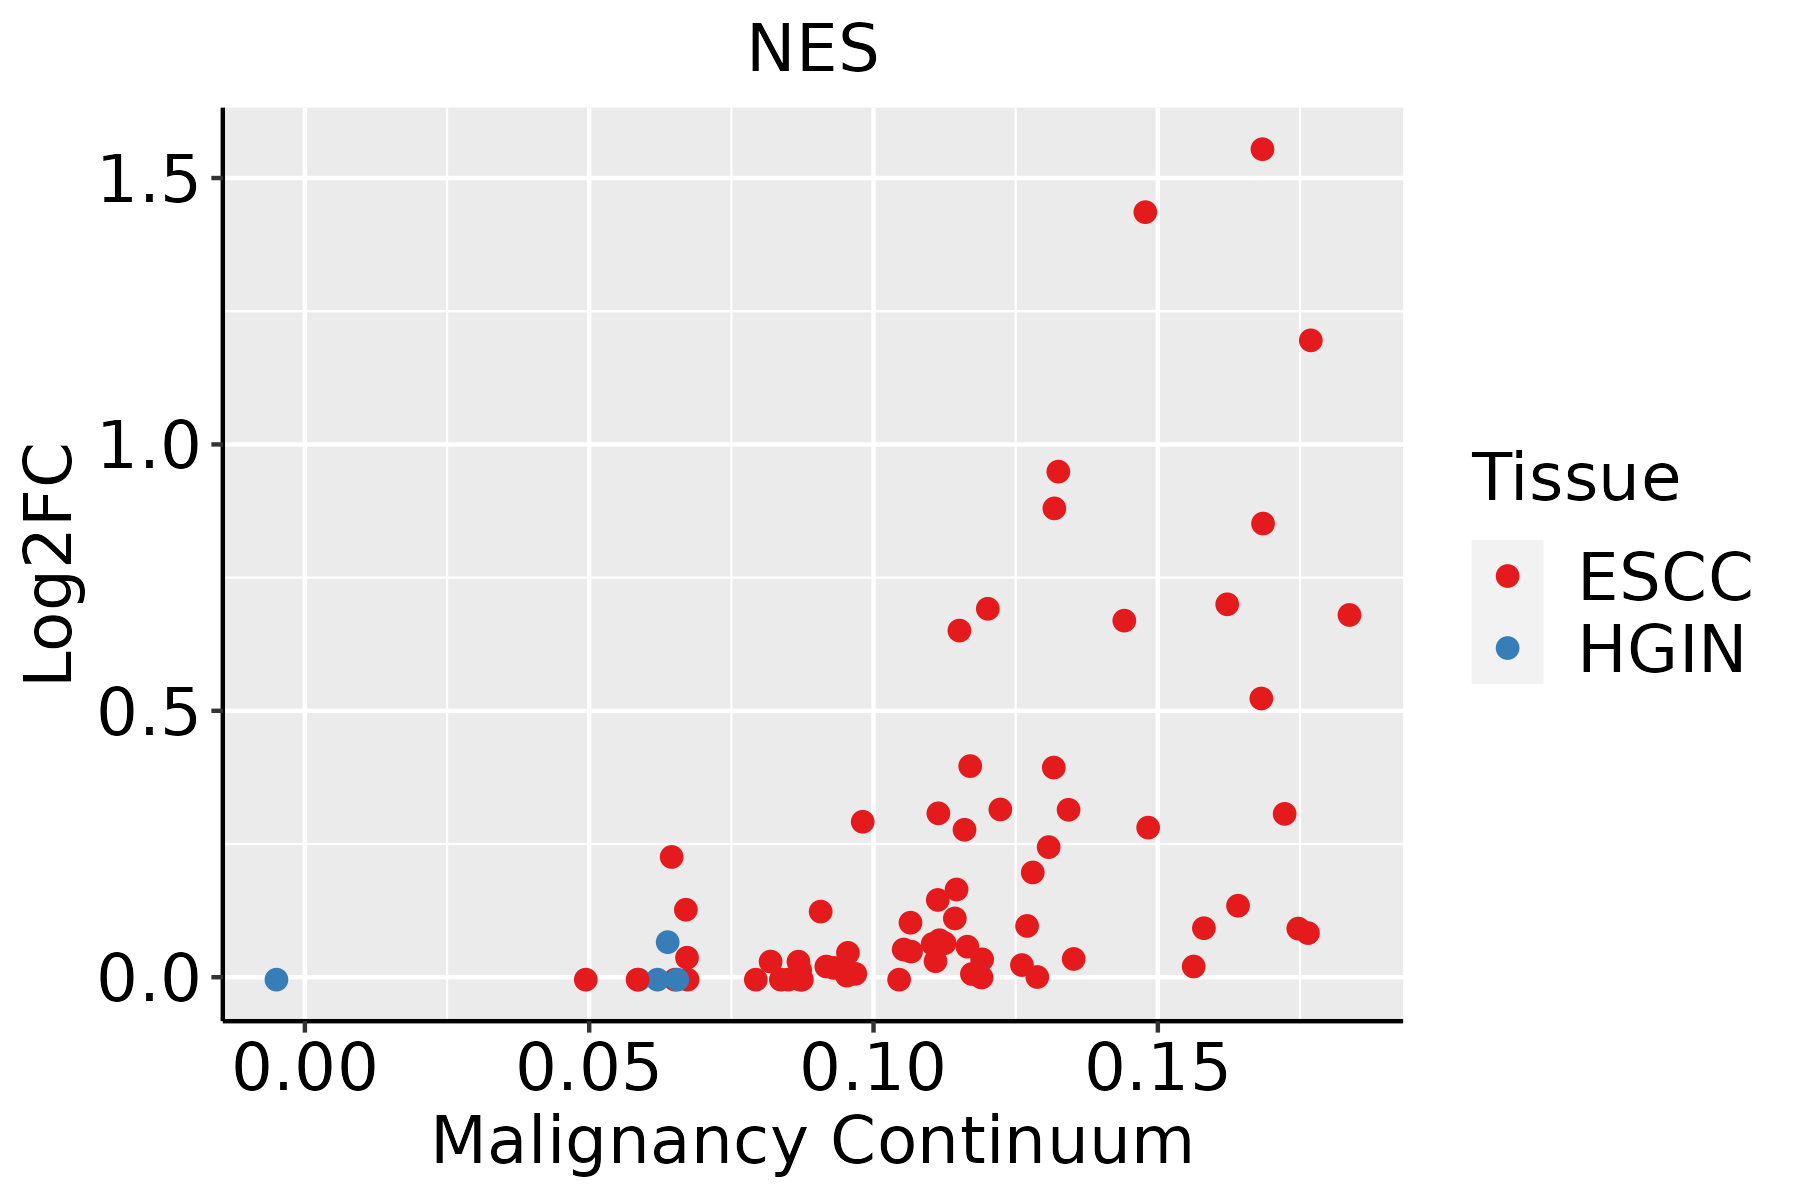 | ESCC: Esophageal squamous cell carcinoma |
| HGIN: High-grade intraepithelial neoplasias | ||
| LGIN: Low-grade intraepithelial neoplasias | ||
| Liver |  | HCC: Hepatocellular carcinoma |
| NAFLD: Non-alcoholic fatty liver disease | ||
| Oral Cavity |  | EOLP: Erosive Oral lichen planus |
| LP: leukoplakia | ||
| NEOLP: Non-erosive oral lichen planus | ||
| OSCC: Oral squamous cell carcinoma | ||
| Thyroid | 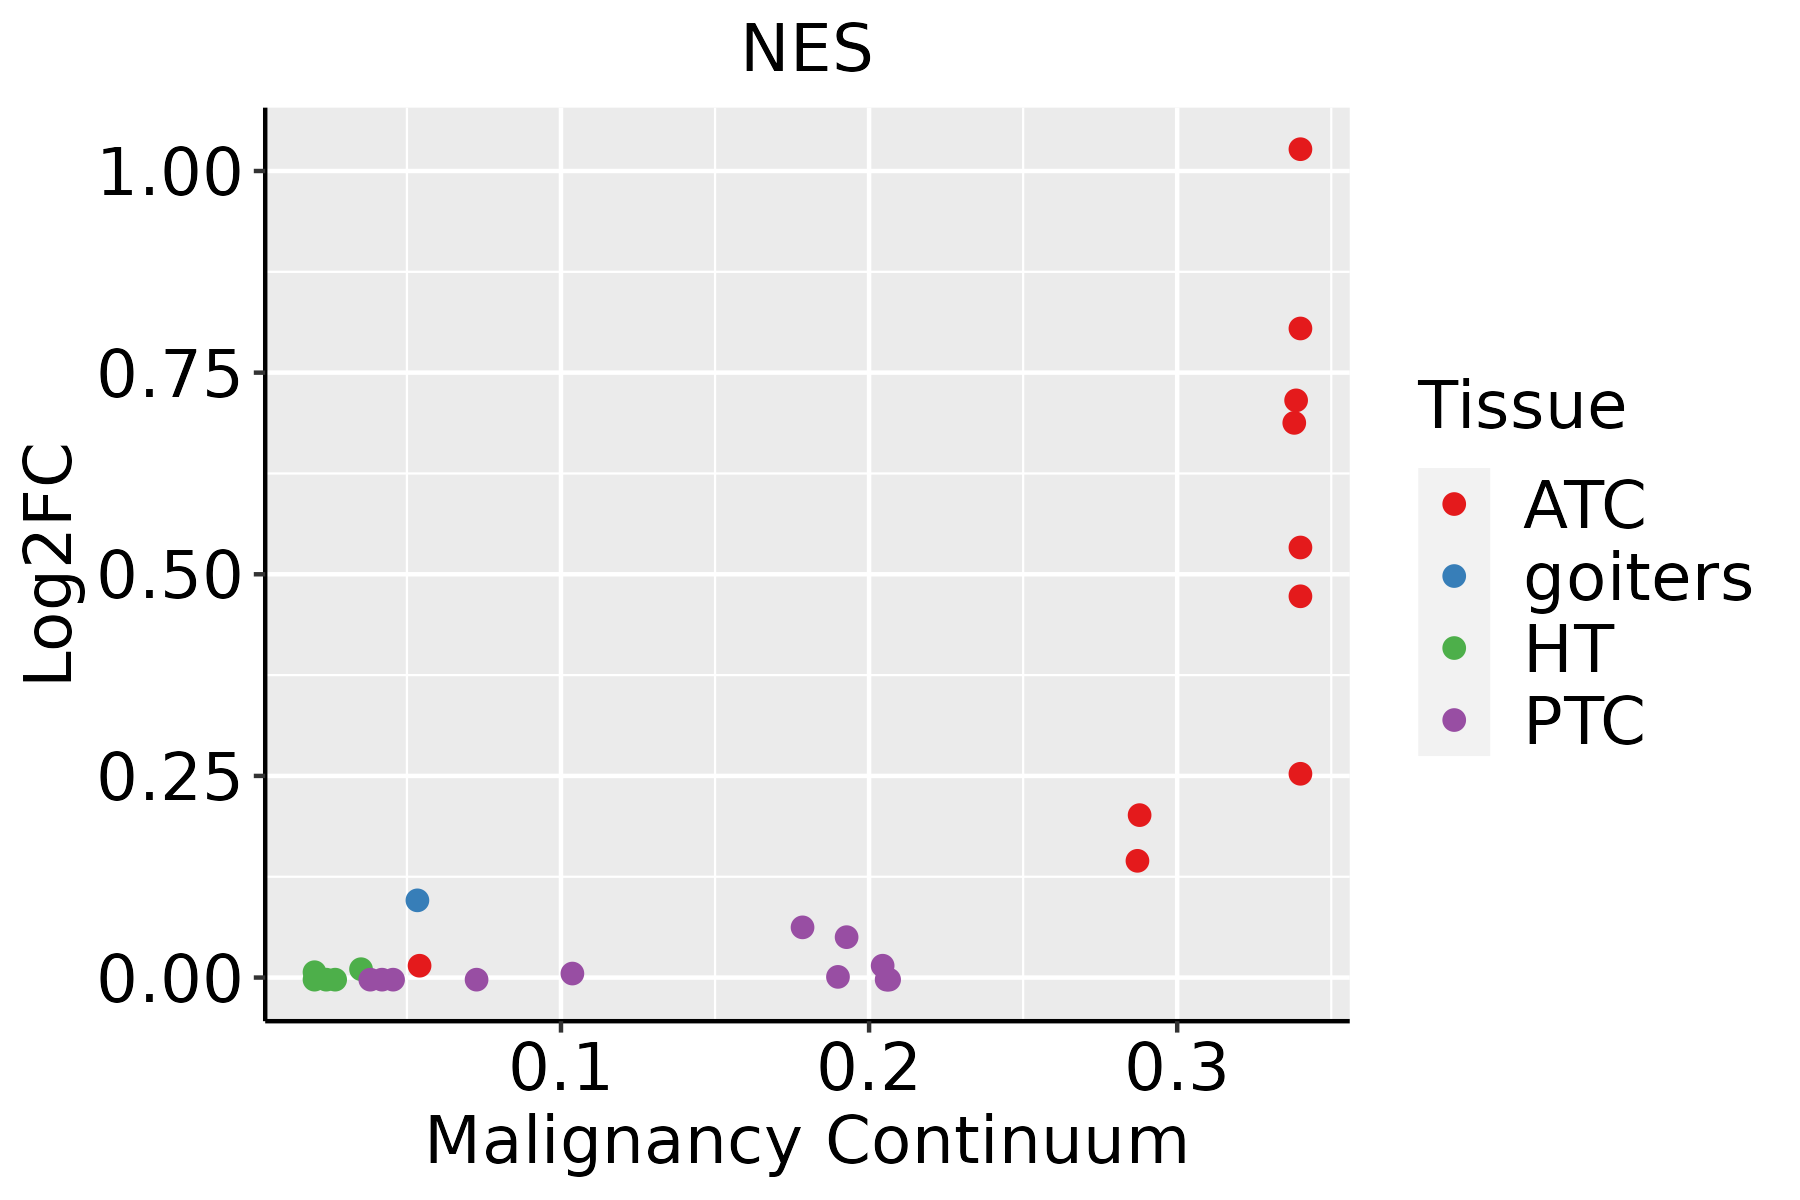 | ATC: Anaplastic thyroid cancer |
| HT: Hashimoto's thyroiditis | ||
| PTC: Papillary thyroid cancer |
| ∗log2FC in expression of this searched gene in stem-like cells from each diseased tissue sample relative to stem-like cells in normal samples in each tissue plotted against the malignancy continuum. Samples are colored based on if they are from different disease stage. |
Top |
Malignant transformation related pathway analysis |
| Find out the enriched GO biological processes and KEGG pathways involved in transition from healthy to precancer to cancer |
| Tissue | Disease Stage | Enriched GO biological Processes |
| Colorectum | AD |  |
| Colorectum | SER |  |
| Colorectum | MSS |  |
| Colorectum | MSI-H |  |
| Colorectum | FAP |  |
| ∗Top 15 enriched GO BP terms are showed in the bar plot of each disease state in each tissue. Each row represents a significant GO biological process which is colored according to the -log10(p.adjust). |
| Page: 1 2 3 4 5 6 7 8 9 |
| GO ID | Tissue | Disease Stage | Description | Gene Ratio | Bg Ratio | pvalue | p.adjust | Count |
| GO:005109812 | Liver | Cirrhotic | regulation of binding | 148/4634 | 363/18723 | 9.14e-12 | 5.97e-10 | 148 |
| GO:007099712 | Liver | Cirrhotic | neuron death | 141/4634 | 361/18723 | 9.56e-10 | 4.38e-08 | 141 |
| GO:004339312 | Liver | Cirrhotic | regulation of protein binding | 83/4634 | 196/18723 | 4.44e-08 | 1.42e-06 | 83 |
| GO:19012147 | Liver | Cirrhotic | regulation of neuron death | 122/4634 | 319/18723 | 5.17e-08 | 1.62e-06 | 122 |
| GO:005149512 | Liver | Cirrhotic | positive regulation of cytoskeleton organization | 87/4634 | 226/18723 | 2.96e-06 | 5.25e-05 | 87 |
| GO:19012156 | Liver | Cirrhotic | negative regulation of neuron death | 80/4634 | 208/18723 | 7.55e-06 | 1.15e-04 | 80 |
| GO:00514027 | Liver | Cirrhotic | neuron apoptotic process | 91/4634 | 246/18723 | 1.18e-05 | 1.68e-04 | 91 |
| GO:00511006 | Liver | Cirrhotic | negative regulation of binding | 63/4634 | 162/18723 | 4.54e-05 | 5.31e-04 | 63 |
| GO:00329846 | Liver | Cirrhotic | protein-containing complex disassembly | 82/4634 | 224/18723 | 4.78e-05 | 5.54e-04 | 82 |
| GO:00447721 | Liver | Cirrhotic | mitotic cell cycle phase transition | 139/4634 | 424/18723 | 1.02e-04 | 1.06e-03 | 139 |
| GO:00435236 | Liver | Cirrhotic | regulation of neuron apoptotic process | 77/4634 | 212/18723 | 1.08e-04 | 1.10e-03 | 77 |
| GO:00320914 | Liver | Cirrhotic | negative regulation of protein binding | 40/4634 | 94/18723 | 1.14e-04 | 1.14e-03 | 40 |
| GO:00435242 | Liver | Cirrhotic | negative regulation of neuron apoptotic process | 51/4634 | 145/18723 | 3.15e-03 | 1.78e-02 | 51 |
| GO:002241112 | Liver | HCC | cellular component disassembly | 282/7958 | 443/18723 | 1.02e-19 | 1.38e-17 | 282 |
| GO:005109822 | Liver | HCC | regulation of binding | 225/7958 | 363/18723 | 3.78e-14 | 2.37e-12 | 225 |
| GO:004339322 | Liver | HCC | regulation of protein binding | 129/7958 | 196/18723 | 3.27e-11 | 1.26e-09 | 129 |
| GO:00447722 | Liver | HCC | mitotic cell cycle phase transition | 240/7958 | 424/18723 | 2.47e-09 | 6.84e-08 | 240 |
| GO:003298411 | Liver | HCC | protein-containing complex disassembly | 138/7958 | 224/18723 | 5.59e-09 | 1.46e-07 | 138 |
| GO:005149522 | Liver | HCC | positive regulation of cytoskeleton organization | 138/7958 | 226/18723 | 1.26e-08 | 3.12e-07 | 138 |
| GO:007099722 | Liver | HCC | neuron death | 202/7958 | 361/18723 | 1.44e-07 | 2.70e-06 | 202 |
| Page: 1 2 3 4 5 6 |
| Pathway ID | Tissue | Disease Stage | Description | Gene Ratio | Bg Ratio | pvalue | p.adjust | qvalue | Count |
| Page: 1 |
Top |
Cell-cell communication analysis |
| Identification of potential cell-cell interactions between two cell types and their ligand-receptor pairs for different disease states |
| Ligand | Receptor | LRpair | Pathway | Tissue | Disease Stage |
| Page: 1 |
Top |
Single-cell gene regulatory network inference analysis |
| Find out the significant the regulons (TFs) and the target genes of each regulon across cell types for different disease states |
| TF | Cell Type | Tissue | Disease Stage | Target Gene | RSS | Regulon Activity |
| ∗The dot plots of a searched regulon are shown for all cell subpopulations in each disease state of each tissue based on the regulon specific score inferred using pySCENIC and by calculating the average expression. |
| Page: 1 |
Top |
Somatic mutation of malignant transformation related genes |
| Annotation of somatic variants for genes involved in malignant transformation |
| Hugo Symbol | Variant Class | Variant Classification | dbSNP RS | HGVSc | HGVSp | HGVSp Short | SWISSPROT | BIOTYPE | SIFT | PolyPhen | Tumor Sample Barcode | Tissue | Histology | Sex | Age | Stage | Therapy Types | Drugs | Outcome |
| NES | SNV | Missense_Mutation | novel | c.2434G>A | p.Glu812Lys | p.E812K | P48681 | protein_coding | tolerated(0.08) | benign(0.074) | TCGA-AN-A046-01 | Breast | breast invasive carcinoma | Female | >=65 | I/II | Unknown | Unknown | SD |
| NES | SNV | Missense_Mutation | novel | c.1913C>A | p.Ser638Tyr | p.S638Y | P48681 | protein_coding | deleterious(0) | possibly_damaging(0.694) | TCGA-AN-A046-01 | Breast | breast invasive carcinoma | Female | >=65 | I/II | Unknown | Unknown | SD |
| NES | SNV | Missense_Mutation | c.3695N>T | p.Ala1232Val | p.A1232V | P48681 | protein_coding | tolerated(0.07) | benign(0.051) | TCGA-BH-A1EV-01 | Breast | breast invasive carcinoma | Female | <65 | III/IV | Unknown | Unknown | PD | |
| NES | SNV | Missense_Mutation | c.4662G>T | p.Met1554Ile | p.M1554I | P48681 | protein_coding | tolerated(0.09) | benign(0) | TCGA-C8-A1HM-01 | Breast | breast invasive carcinoma | Female | >=65 | I/II | Chemotherapy | doxorubicin | CR | |
| NES | SNV | Missense_Mutation | c.2374G>C | p.Asp792His | p.D792H | P48681 | protein_coding | deleterious(0) | probably_damaging(0.972) | TCGA-C8-A1HM-01 | Breast | breast invasive carcinoma | Female | >=65 | I/II | Chemotherapy | doxorubicin | CR | |
| NES | SNV | Missense_Mutation | novel | c.2275G>A | p.Glu759Lys | p.E759K | P48681 | protein_coding | deleterious(0.02) | possibly_damaging(0.787) | TCGA-C8-A1HM-01 | Breast | breast invasive carcinoma | Female | >=65 | I/II | Chemotherapy | doxorubicin | CR |
| NES | SNV | Missense_Mutation | c.1908N>A | p.Met636Ile | p.M636I | P48681 | protein_coding | tolerated(0.25) | benign(0.003) | TCGA-C8-A274-01 | Breast | breast invasive carcinoma | Female | <65 | I/II | Hormone Therapy | tamoxiphen | SD | |
| NES | SNV | Missense_Mutation | c.3241G>C | p.Glu1081Gln | p.E1081Q | P48681 | protein_coding | tolerated(0.26) | benign(0.006) | TCGA-D8-A1J8-01 | Breast | breast invasive carcinoma | Female | >=65 | I/II | Hormone Therapy | nolvadex | SD | |
| NES | SNV | Missense_Mutation | c.4159N>A | p.Ala1387Thr | p.A1387T | P48681 | protein_coding | tolerated(0.17) | benign(0.009) | TCGA-D8-A1XK-01 | Breast | breast invasive carcinoma | Female | <65 | I/II | Chemotherapy | doxorubicine+cyclophosphamide | SD | |
| NES | SNV | Missense_Mutation | novel | c.2557N>A | p.Glu853Lys | p.E853K | P48681 | protein_coding | deleterious(0.01) | possibly_damaging(0.888) | TCGA-E2-A2P6-01 | Breast | breast invasive carcinoma | Female | >=65 | I/II | Hormone Therapy | anastrozole | SD |
| Page: 1 2 3 4 5 6 7 8 9 10 11 12 13 14 15 16 17 18 19 20 21 |
Top |
Related drugs of malignant transformation related genes |
| Identification of chemicals and drugs interact with genes involved in malignant transfromation |
| (DGIdb 4.0) |
| Entrez ID | Symbol | Category | Interaction Types | Drug Claim Name | Drug Name | PMIDs |
| Page: 1 |

Copyright 2023-Present -The University of Texas Health Science Center at Houston |