| Tissue | Expression Dynamics | Abbreviation |
| Cervix | 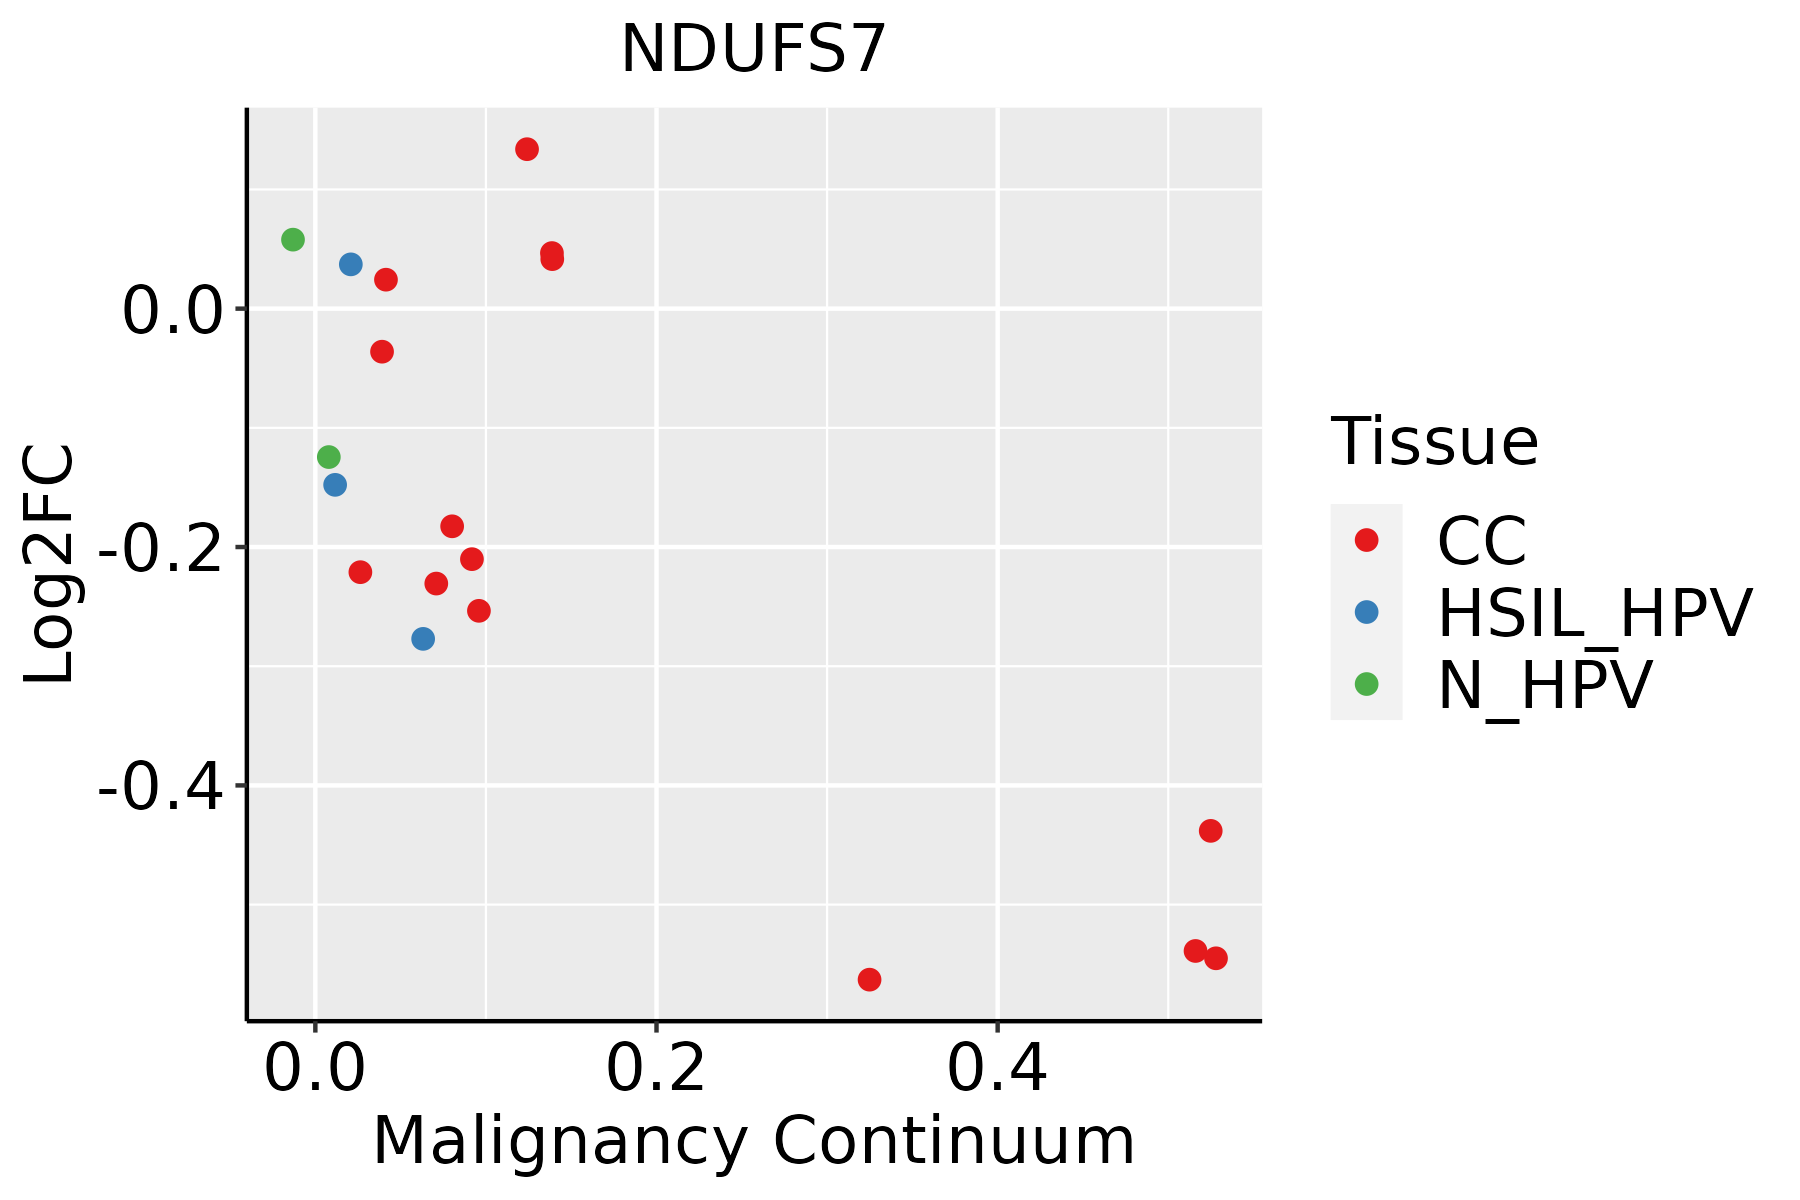 | CC: Cervix cancer |
| HSIL_HPV: HPV-infected high-grade squamous intraepithelial lesions |
| N_HPV: HPV-infected normal cervix |
| Esophagus | 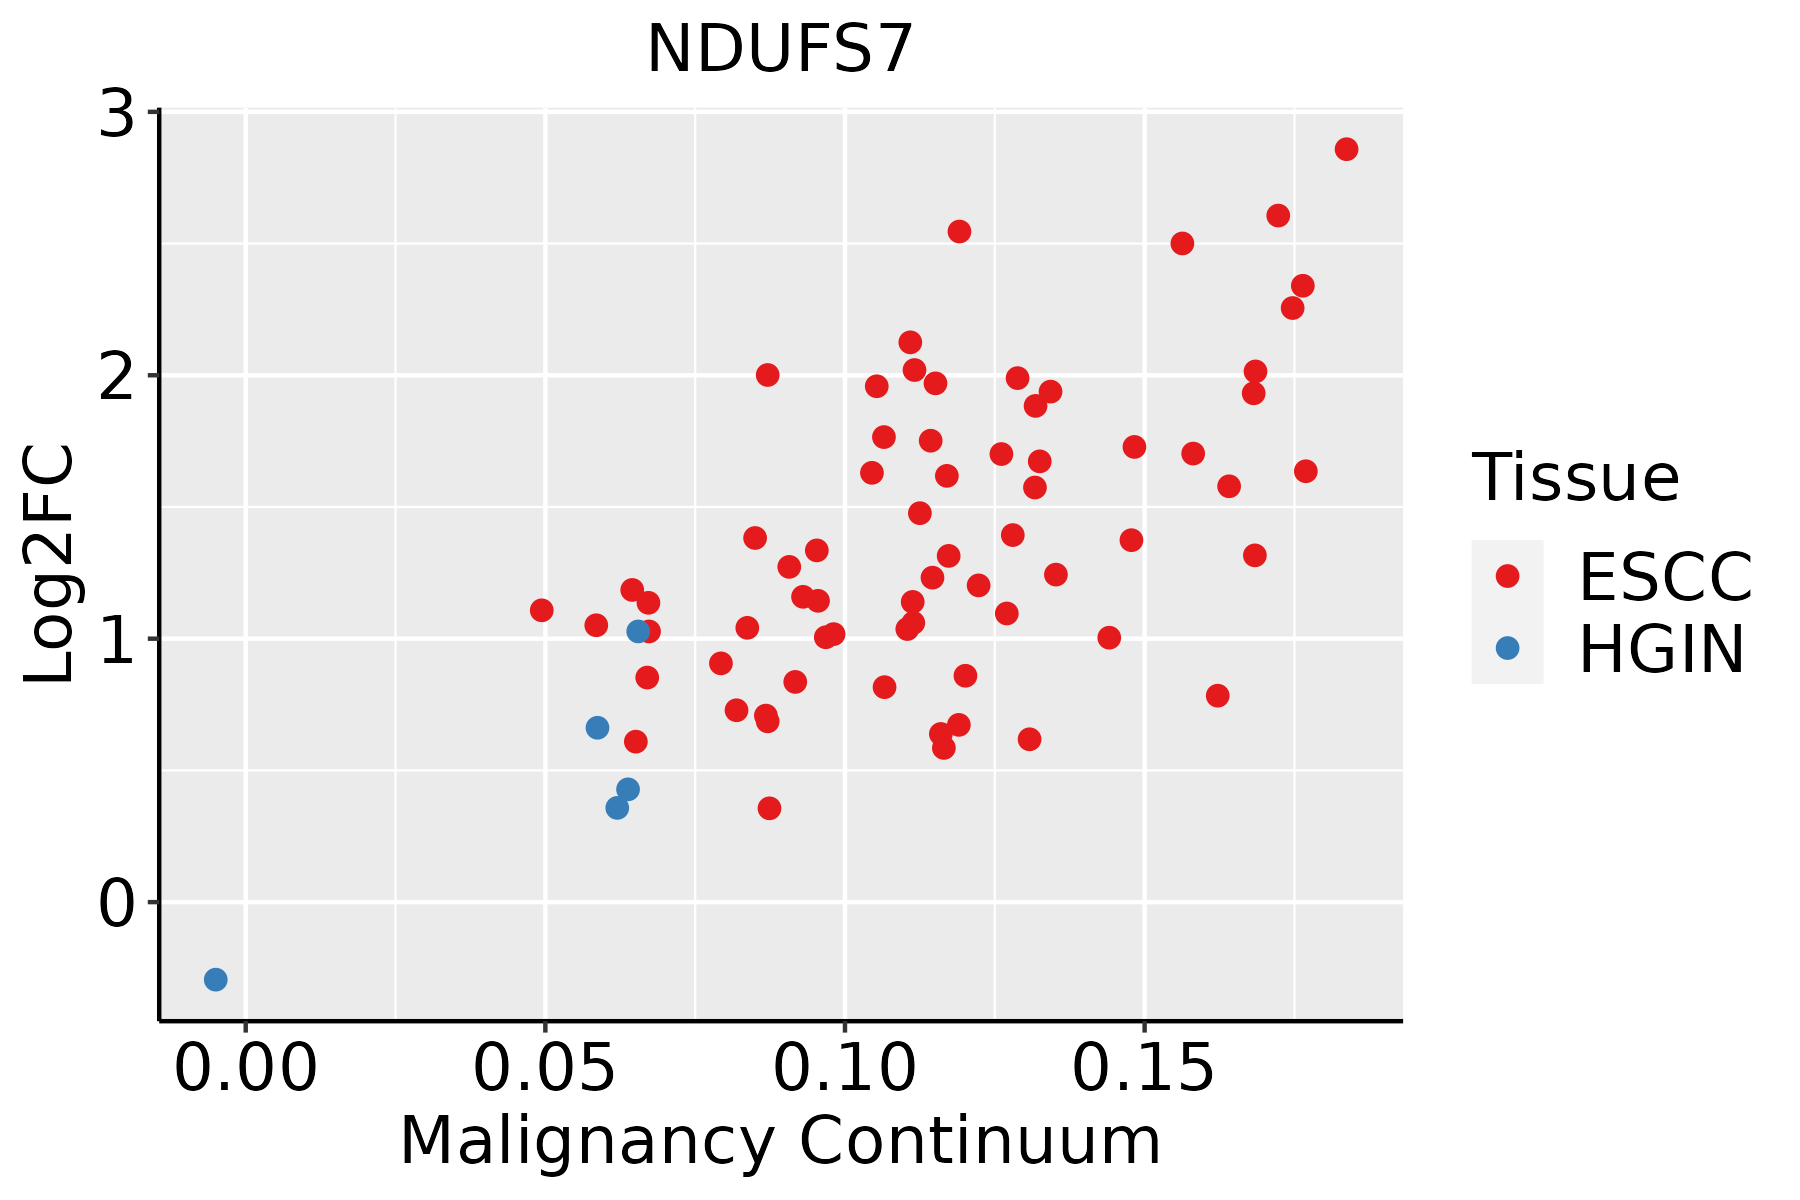 | ESCC: Esophageal squamous cell carcinoma |
| HGIN: High-grade intraepithelial neoplasias |
| LGIN: Low-grade intraepithelial neoplasias |
| GC | 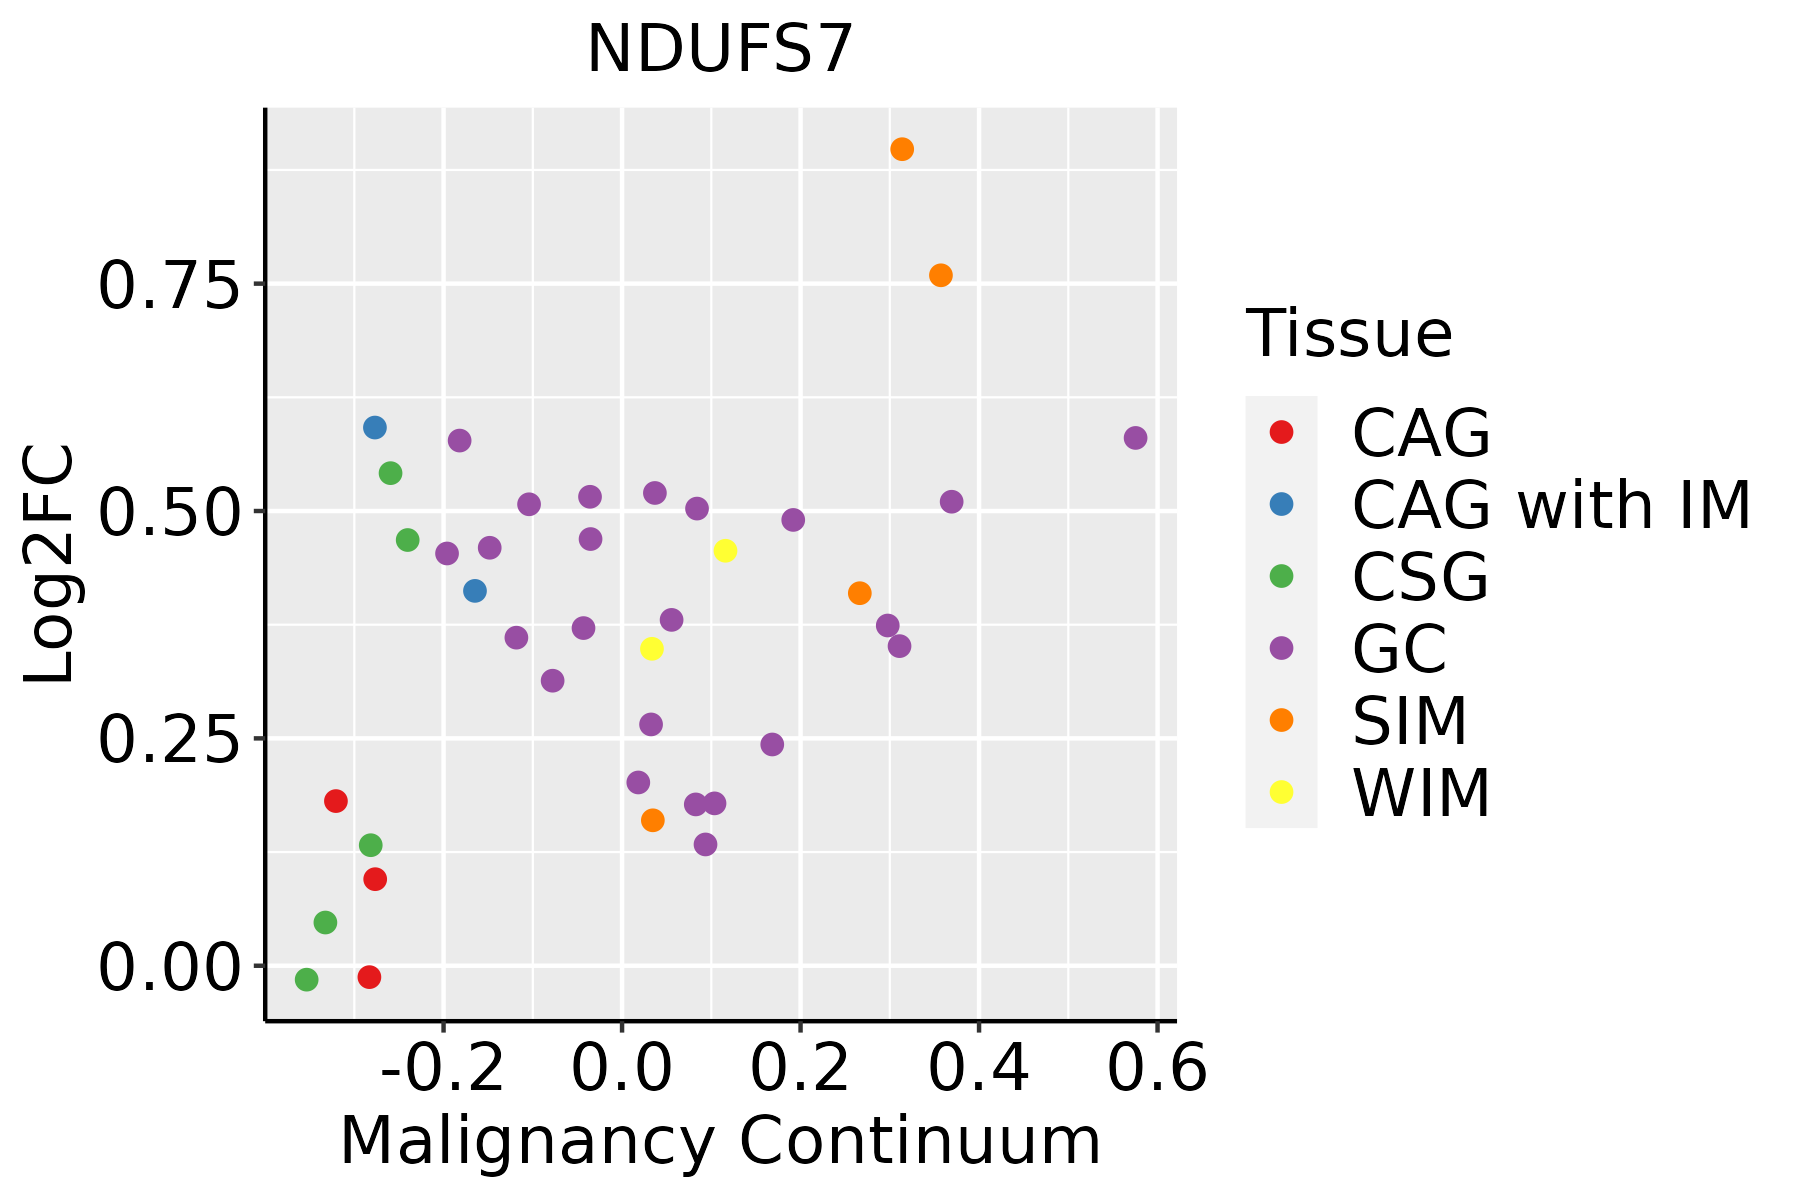 | CAG: Chronic atrophic gastritis |
| CAG with IM: Chronic atrophic gastritis with intestinal metaplasia |
| CSG: Chronic superficial gastritis |
| GC: Gastric cancer |
| SIM: Severe intestinal metaplasia |
| WIM: Wild intestinal metaplasia |
| Liver | 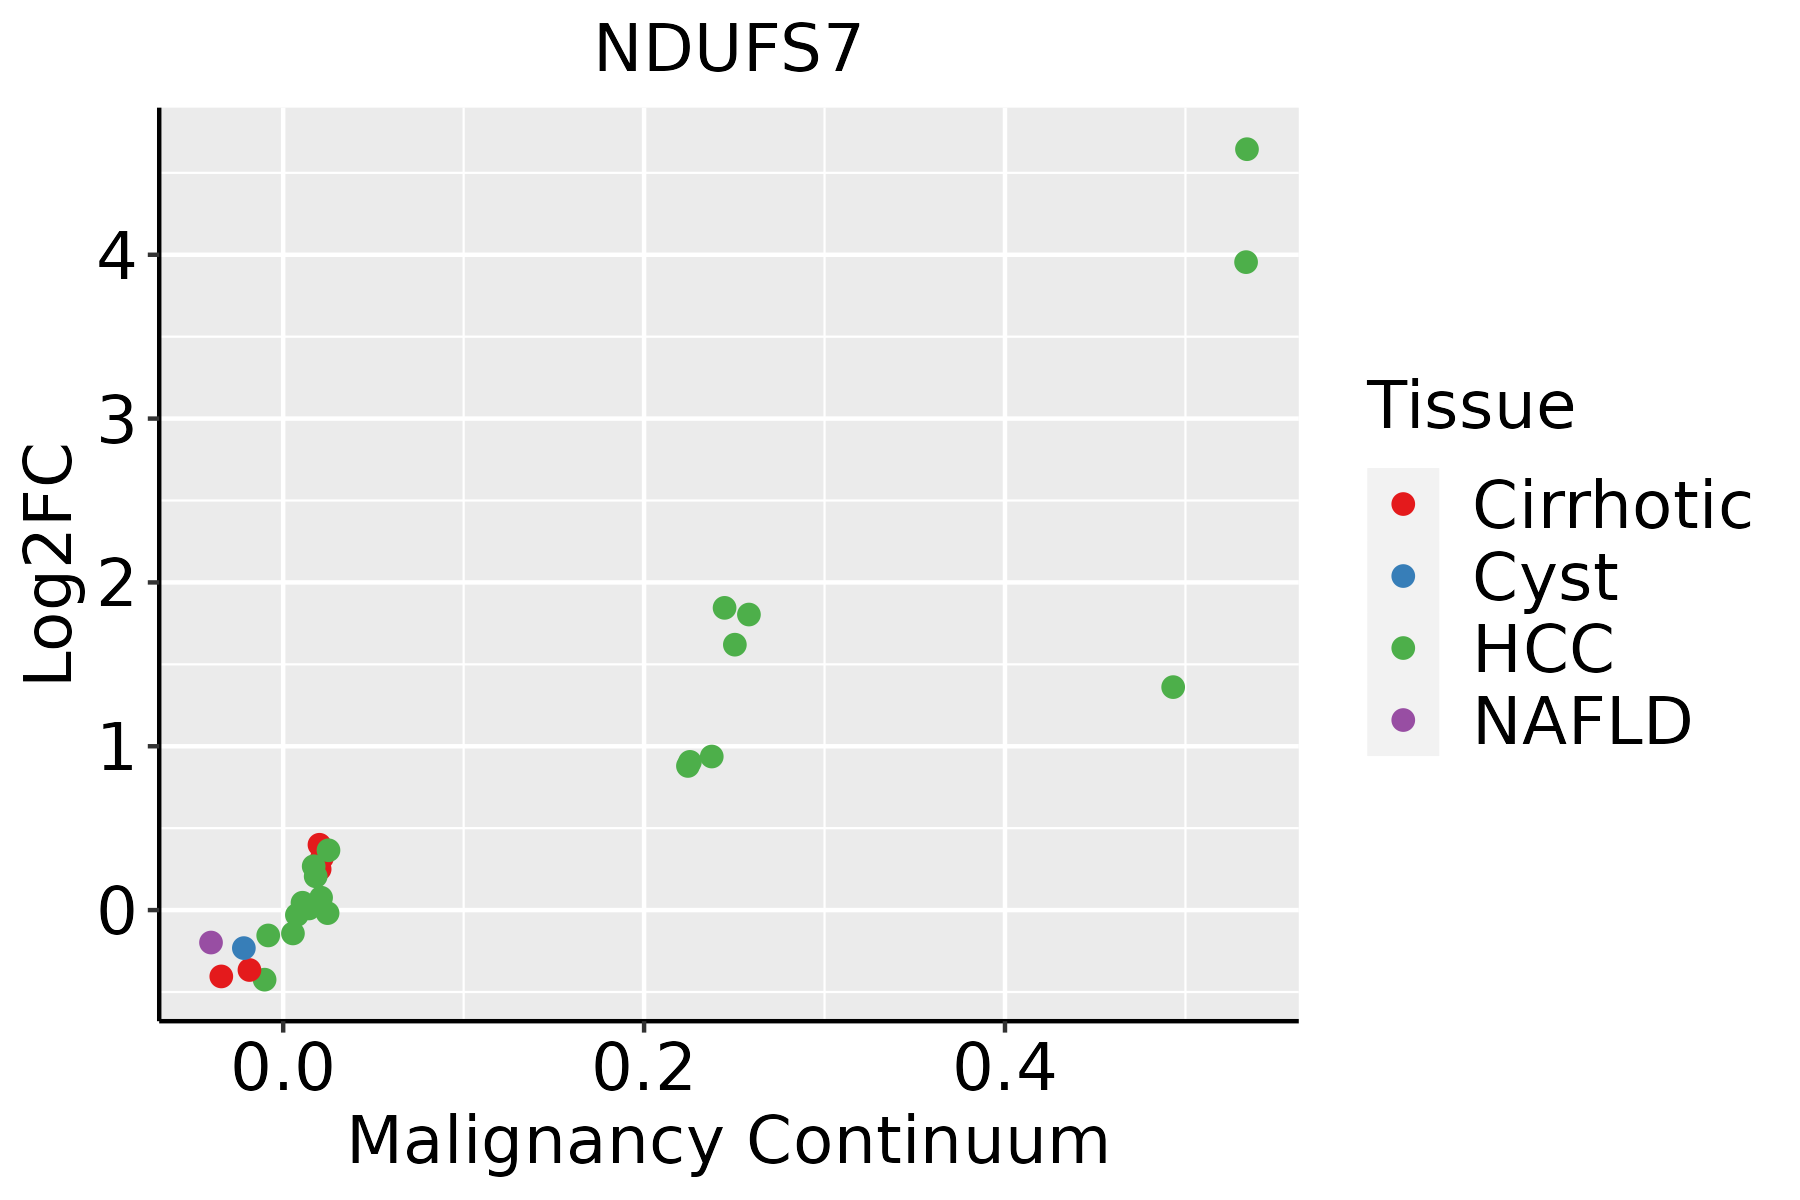 | HCC: Hepatocellular carcinoma |
| NAFLD: Non-alcoholic fatty liver disease |
| Oral Cavity |  | EOLP: Erosive Oral lichen planus |
| LP: leukoplakia |
| NEOLP: Non-erosive oral lichen planus |
| OSCC: Oral squamous cell carcinoma |
| Prostate |  | BPH: Benign Prostatic Hyperplasia |
| Skin | 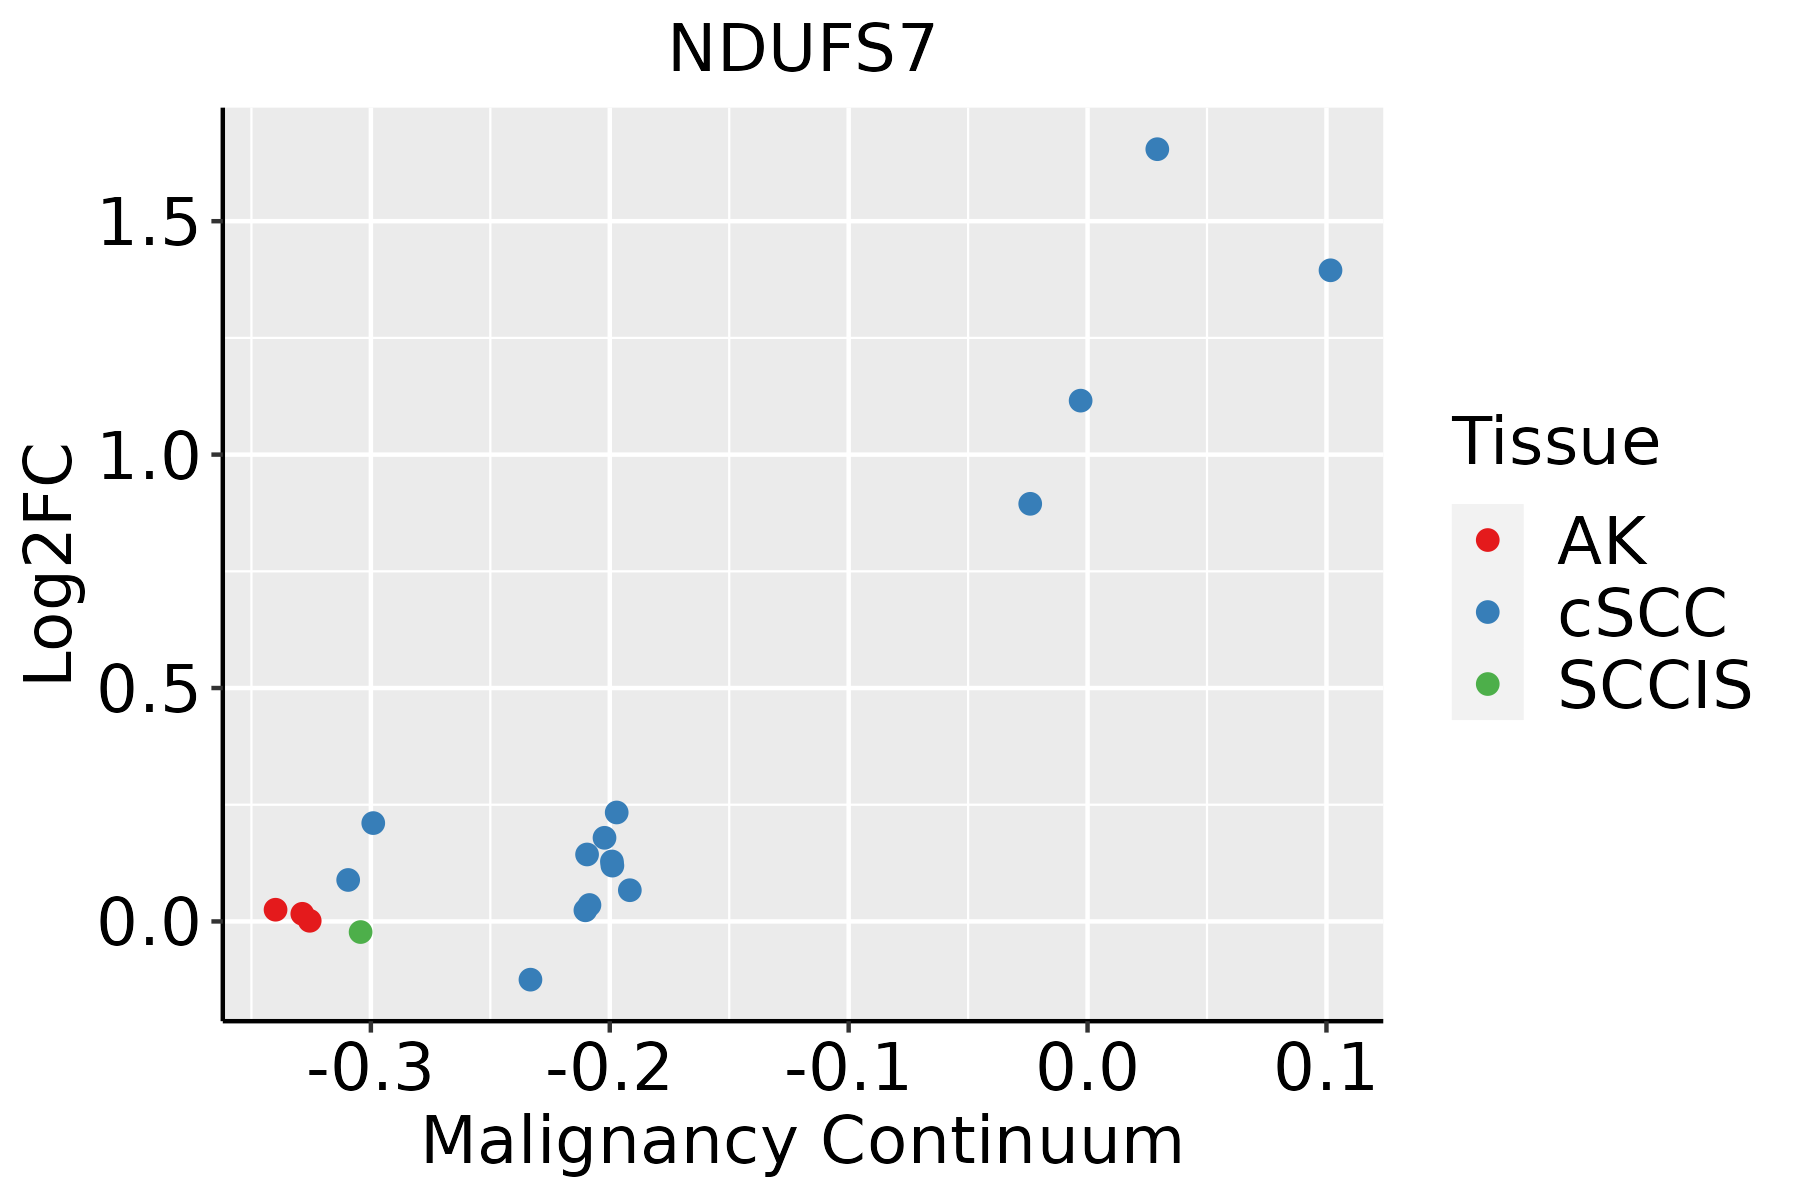 | AK: Actinic keratosis |
| cSCC: Cutaneous squamous cell carcinoma |
| SCCIS:squamous cell carcinoma in situ |
| Thyroid |  | ATC: Anaplastic thyroid cancer |
| HT: Hashimoto's thyroiditis |
| PTC: Papillary thyroid cancer |
| GO ID | Tissue | Disease Stage | Description | Gene Ratio | Bg Ratio | pvalue | p.adjust | Count |
| GO:190260013 | Cervix | HSIL_HPV | proton transmembrane transport | 20/737 | 157/18723 | 3.73e-06 | 1.51e-04 | 20 |
| GO:004277314 | Cervix | HSIL_HPV | ATP synthesis coupled electron transport | 15/737 | 95/18723 | 4.31e-06 | 1.70e-04 | 15 |
| GO:004277514 | Cervix | HSIL_HPV | mitochondrial ATP synthesis coupled electron transport | 15/737 | 95/18723 | 4.31e-06 | 1.70e-04 | 15 |
| GO:002290414 | Cervix | HSIL_HPV | respiratory electron transport chain | 15/737 | 114/18723 | 4.08e-05 | 1.08e-03 | 15 |
| GO:004533314 | Cervix | HSIL_HPV | cellular respiration | 23/737 | 230/18723 | 4.13e-05 | 1.09e-03 | 23 |
| GO:002290014 | Cervix | HSIL_HPV | electron transport chain | 18/737 | 175/18723 | 1.93e-04 | 3.56e-03 | 18 |
| GO:000612014 | Cervix | HSIL_HPV | mitochondrial electron transport, NADH to ubiquinone | 8/737 | 51/18723 | 7.89e-04 | 1.04e-02 | 8 |
| GO:001598014 | Cervix | HSIL_HPV | energy derivation by oxidation of organic compounds | 24/737 | 318/18723 | 1.84e-03 | 1.96e-02 | 24 |
| GO:000609114 | Cervix | HSIL_HPV | generation of precursor metabolites and energy | 32/737 | 490/18723 | 3.69e-03 | 3.27e-02 | 32 |
| GO:000611920 | Esophagus | HGIN | oxidative phosphorylation | 69/2587 | 141/18723 | 1.37e-23 | 2.05e-20 | 69 |
| GO:000906020 | Esophagus | HGIN | aerobic respiration | 81/2587 | 189/18723 | 1.07e-22 | 9.26e-20 | 81 |
| GO:004603427 | Esophagus | HGIN | ATP metabolic process | 101/2587 | 277/18723 | 1.53e-21 | 1.02e-18 | 101 |
| GO:000609120 | Esophagus | HGIN | generation of precursor metabolites and energy | 145/2587 | 490/18723 | 3.41e-20 | 2.04e-17 | 145 |
| GO:004533320 | Esophagus | HGIN | cellular respiration | 86/2587 | 230/18723 | 2.41e-19 | 1.20e-16 | 86 |
| GO:001598020 | Esophagus | HGIN | energy derivation by oxidation of organic compounds | 105/2587 | 318/18723 | 1.16e-18 | 4.99e-16 | 105 |
| GO:004277320 | Esophagus | HGIN | ATP synthesis coupled electron transport | 49/2587 | 95/18723 | 2.21e-18 | 7.36e-16 | 49 |
| GO:004277520 | Esophagus | HGIN | mitochondrial ATP synthesis coupled electron transport | 49/2587 | 95/18723 | 2.21e-18 | 7.36e-16 | 49 |
| GO:003310820 | Esophagus | HGIN | mitochondrial respiratory chain complex assembly | 47/2587 | 93/18723 | 3.15e-17 | 8.60e-15 | 47 |
| GO:002290420 | Esophagus | HGIN | respiratory electron transport chain | 51/2587 | 114/18723 | 9.63e-16 | 2.41e-13 | 51 |
| GO:001964620 | Esophagus | HGIN | aerobic electron transport chain | 43/2587 | 87/18723 | 1.98e-15 | 4.41e-13 | 43 |
| Pathway ID | Tissue | Disease Stage | Description | Gene Ratio | Bg Ratio | pvalue | p.adjust | qvalue | Count |
| hsa0520820 | Cervix | CC | Chemical carcinogenesis - reactive oxygen species | 92/1267 | 223/8465 | 4.71e-22 | 5.09e-20 | 3.01e-20 | 92 |
| hsa0501220 | Cervix | CC | Parkinson disease | 102/1267 | 266/8465 | 1.81e-21 | 1.47e-19 | 8.66e-20 | 102 |
| hsa0019018 | Cervix | CC | Oxidative phosphorylation | 64/1267 | 134/8465 | 1.25e-19 | 8.07e-18 | 4.77e-18 | 64 |
| hsa0502018 | Cervix | CC | Prion disease | 98/1267 | 273/8465 | 2.64e-18 | 1.42e-16 | 8.42e-17 | 98 |
| hsa0541520 | Cervix | CC | Diabetic cardiomyopathy | 76/1267 | 203/8465 | 1.40e-15 | 6.46e-14 | 3.82e-14 | 76 |
| hsa0501018 | Cervix | CC | Alzheimer disease | 113/1267 | 384/8465 | 9.67e-14 | 3.92e-12 | 2.32e-12 | 113 |
| hsa0501618 | Cervix | CC | Huntington disease | 94/1267 | 306/8465 | 8.49e-13 | 3.06e-11 | 1.81e-11 | 94 |
| hsa0502218 | Cervix | CC | Pathways of neurodegeneration - multiple diseases | 128/1267 | 476/8465 | 2.87e-12 | 9.29e-11 | 5.50e-11 | 128 |
| hsa0493218 | Cervix | CC | Non-alcoholic fatty liver disease | 58/1267 | 155/8465 | 3.58e-12 | 1.05e-10 | 6.23e-11 | 58 |
| hsa0471420 | Cervix | CC | Thermogenesis | 76/1267 | 232/8465 | 4.29e-12 | 1.16e-10 | 6.85e-11 | 76 |
| hsa0501418 | Cervix | CC | Amyotrophic lateral sclerosis | 103/1267 | 364/8465 | 1.79e-11 | 4.47e-10 | 2.64e-10 | 103 |
| hsa0472318 | Cervix | CC | Retrograde endocannabinoid signaling | 42/1267 | 148/8465 | 1.79e-05 | 1.42e-04 | 8.40e-05 | 42 |
| hsa05208110 | Cervix | CC | Chemical carcinogenesis - reactive oxygen species | 92/1267 | 223/8465 | 4.71e-22 | 5.09e-20 | 3.01e-20 | 92 |
| hsa05012110 | Cervix | CC | Parkinson disease | 102/1267 | 266/8465 | 1.81e-21 | 1.47e-19 | 8.66e-20 | 102 |
| hsa0019019 | Cervix | CC | Oxidative phosphorylation | 64/1267 | 134/8465 | 1.25e-19 | 8.07e-18 | 4.77e-18 | 64 |
| hsa0502019 | Cervix | CC | Prion disease | 98/1267 | 273/8465 | 2.64e-18 | 1.42e-16 | 8.42e-17 | 98 |
| hsa05415110 | Cervix | CC | Diabetic cardiomyopathy | 76/1267 | 203/8465 | 1.40e-15 | 6.46e-14 | 3.82e-14 | 76 |
| hsa0501019 | Cervix | CC | Alzheimer disease | 113/1267 | 384/8465 | 9.67e-14 | 3.92e-12 | 2.32e-12 | 113 |
| hsa0501619 | Cervix | CC | Huntington disease | 94/1267 | 306/8465 | 8.49e-13 | 3.06e-11 | 1.81e-11 | 94 |
| hsa0502219 | Cervix | CC | Pathways of neurodegeneration - multiple diseases | 128/1267 | 476/8465 | 2.87e-12 | 9.29e-11 | 5.50e-11 | 128 |
| Hugo Symbol | Variant Class | Variant Classification | dbSNP RS | HGVSc | HGVSp | HGVSp Short | SWISSPROT | BIOTYPE | SIFT | PolyPhen | Tumor Sample Barcode | Tissue | Histology | Sex | Age | Stage | Therapy Types | Drugs | Outcome |
| NDUFS7 | deletion | Frame_Shift_Del | novel | c.625delN | p.Ile209SerfsTer? | p.I209Sfs*? | O75251 | protein_coding | | | TCGA-EW-A2FV-01 | Breast | breast invasive carcinoma | Female | <65 | III/IV | Chemotherapy | docetaxel | SD |
| NDUFS7 | SNV | Missense_Mutation | | c.627N>G | p.Ile209Met | p.I209M | O75251 | protein_coding | tolerated_low_confidence(0.74) | benign(0.003) | TCGA-CK-4951-01 | Colorectum | colon adenocarcinoma | Female | >=65 | I/II | Unknown | Unknown | PD |
| NDUFS7 | SNV | Missense_Mutation | | c.332N>A | p.Arg111His | p.R111H | O75251 | protein_coding | deleterious_low_confidence(0.03) | probably_damaging(1) | TCGA-F4-6703-01 | Colorectum | colon adenocarcinoma | Male | <65 | I/II | Unknown | Unknown | SD |
| NDUFS7 | SNV | Missense_Mutation | rs778260862 | c.29N>A | p.Arg10His | p.R10H | O75251 | protein_coding | tolerated_low_confidence(0.14) | benign(0.13) | TCGA-G4-6320-01 | Colorectum | colon adenocarcinoma | Male | >=65 | III/IV | Chemotherapy | oxaliplatin | SD |
| NDUFS7 | SNV | Missense_Mutation | rs769398012 | c.614N>A | p.Arg205Gln | p.R205Q | O75251 | protein_coding | tolerated_low_confidence(0.13) | benign(0.001) | TCGA-EI-6882-01 | Colorectum | rectum adenocarcinoma | Male | <65 | I/II | Unknown | Unknown | SD |
| NDUFS7 | SNV | Missense_Mutation | rs745768565 | c.466N>A | p.Gly156Arg | p.G156R | O75251 | protein_coding | tolerated_low_confidence(0.06) | probably_damaging(0.999) | TCGA-AJ-A3NF-01 | Endometrium | uterine corpus endometrioid carcinoma | Female | <65 | III/IV | Chemotherapy | chemo | CR |
| NDUFS7 | SNV | Missense_Mutation | novel | c.403C>T | p.Arg135Cys | p.R135C | O75251 | protein_coding | deleterious_low_confidence(0.03) | probably_damaging(1) | TCGA-D1-A15X-01 | Endometrium | uterine corpus endometrioid carcinoma | Female | <65 | I/II | Unknown | Unknown | SD |
| NDUFS7 | SNV | Missense_Mutation | | c.530A>G | p.Asp177Gly | p.D177G | O75251 | protein_coding | tolerated_low_confidence(0.06) | probably_damaging(1) | TCGA-D1-A15X-01 | Endometrium | uterine corpus endometrioid carcinoma | Female | <65 | I/II | Unknown | Unknown | SD |
| NDUFS7 | SNV | Missense_Mutation | novel | c.479N>G | p.Tyr160Cys | p.Y160C | O75251 | protein_coding | deleterious_low_confidence(0) | probably_damaging(1) | TCGA-D1-A175-01 | Endometrium | uterine corpus endometrioid carcinoma | Female | <65 | I/II | Chemotherapy | paclitaxel | SD |
| NDUFS7 | SNV | Missense_Mutation | novel | c.550C>T | p.Pro184Ser | p.P184S | O75251 | protein_coding | deleterious_low_confidence(0) | probably_damaging(0.997) | TCGA-D1-A1NZ-01 | Endometrium | uterine corpus endometrioid carcinoma | Female | <65 | I/II | Unknown | Unknown | SD |


