
|
|||||
|
 | |
| |
| |
| |
| |
| |
|
Gene: NCLN |
Gene summary for NCLN |
| Gene information | Species | Human | Gene symbol | NCLN | Gene ID | 56926 |
| Gene name | nicalin | |
| Gene Alias | NET59 | |
| Cytomap | 19p13.3 | |
| Gene Type | protein-coding | GO ID | GO:0006508 | UniProtAcc | Q969V3 |
Top |
Malignant transformation analysis |
| Identification of the aberrant gene expression in precancerous and cancerous lesions by comparing the gene expression of stem-like cells in diseased tissues with normal stem cells |
| Entrez ID | Symbol | Replicates | Species | Organ | Tissue | Adj P-value | Log2FC | Malignancy |
| 56926 | NCLN | HTA11_2487_2000001011 | Human | Colorectum | SER | 2.33e-07 | 4.98e-01 | -0.1808 |
| 56926 | NCLN | HTA11_1938_2000001011 | Human | Colorectum | AD | 9.90e-08 | 5.78e-01 | -0.0811 |
| 56926 | NCLN | HTA11_347_2000001011 | Human | Colorectum | AD | 6.04e-16 | 4.96e-01 | -0.1954 |
| 56926 | NCLN | HTA11_83_2000001011 | Human | Colorectum | SER | 4.03e-09 | 5.94e-01 | -0.1526 |
| 56926 | NCLN | HTA11_696_2000001011 | Human | Colorectum | AD | 3.15e-05 | 4.04e-01 | -0.1464 |
| 56926 | NCLN | HTA11_1391_2000001011 | Human | Colorectum | AD | 3.51e-10 | 6.57e-01 | -0.059 |
| 56926 | NCLN | HTA11_2992_2000001011 | Human | Colorectum | SER | 1.45e-02 | 5.34e-01 | -0.1706 |
| 56926 | NCLN | HTA11_866_3004761011 | Human | Colorectum | AD | 4.63e-02 | 2.83e-01 | 0.096 |
| 56926 | NCLN | HTA11_6801_2000001011 | Human | Colorectum | SER | 1.01e-02 | 6.73e-01 | 0.0171 |
| 56926 | NCLN | HTA11_7696_3000711011 | Human | Colorectum | AD | 9.17e-09 | 5.04e-01 | 0.0674 |
| 56926 | NCLN | HTA11_99999971662_82457 | Human | Colorectum | MSS | 6.09e-21 | 8.99e-01 | 0.3859 |
| 56926 | NCLN | HTA11_99999974143_84620 | Human | Colorectum | MSS | 4.79e-09 | 4.44e-01 | 0.3005 |
| 56926 | NCLN | A015-C-203 | Human | Colorectum | FAP | 4.75e-02 | 8.40e-02 | -0.1294 |
| 56926 | NCLN | A002-C-205 | Human | Colorectum | FAP | 3.63e-02 | -3.80e-02 | -0.1236 |
| 56926 | NCLN | A015-C-006 | Human | Colorectum | FAP | 1.16e-02 | 2.01e-01 | -0.0994 |
| 56926 | NCLN | A015-C-104 | Human | Colorectum | FAP | 2.28e-02 | -3.94e-02 | -0.1899 |
| 56926 | NCLN | A002-C-116 | Human | Colorectum | FAP | 1.84e-03 | -8.48e-02 | -0.0452 |
| 56926 | NCLN | LZE4T | Human | Esophagus | ESCC | 1.22e-06 | 1.84e-01 | 0.0811 |
| 56926 | NCLN | LZE8T | Human | Esophagus | ESCC | 6.23e-04 | 7.89e-02 | 0.067 |
| 56926 | NCLN | LZE22T | Human | Esophagus | ESCC | 3.90e-02 | 2.59e-01 | 0.068 |
| Page: 1 2 3 4 5 6 7 |
| Tissue | Expression Dynamics | Abbreviation |
| Colorectum (GSE201348) |  | FAP: Familial adenomatous polyposis |
| CRC: Colorectal cancer | ||
| Colorectum (HTA11) |  | AD: Adenomas |
| SER: Sessile serrated lesions | ||
| MSI-H: Microsatellite-high colorectal cancer | ||
| MSS: Microsatellite stable colorectal cancer | ||
| Esophagus |  | ESCC: Esophageal squamous cell carcinoma |
| HGIN: High-grade intraepithelial neoplasias | ||
| LGIN: Low-grade intraepithelial neoplasias | ||
| Liver |  | HCC: Hepatocellular carcinoma |
| NAFLD: Non-alcoholic fatty liver disease | ||
| Oral Cavity | 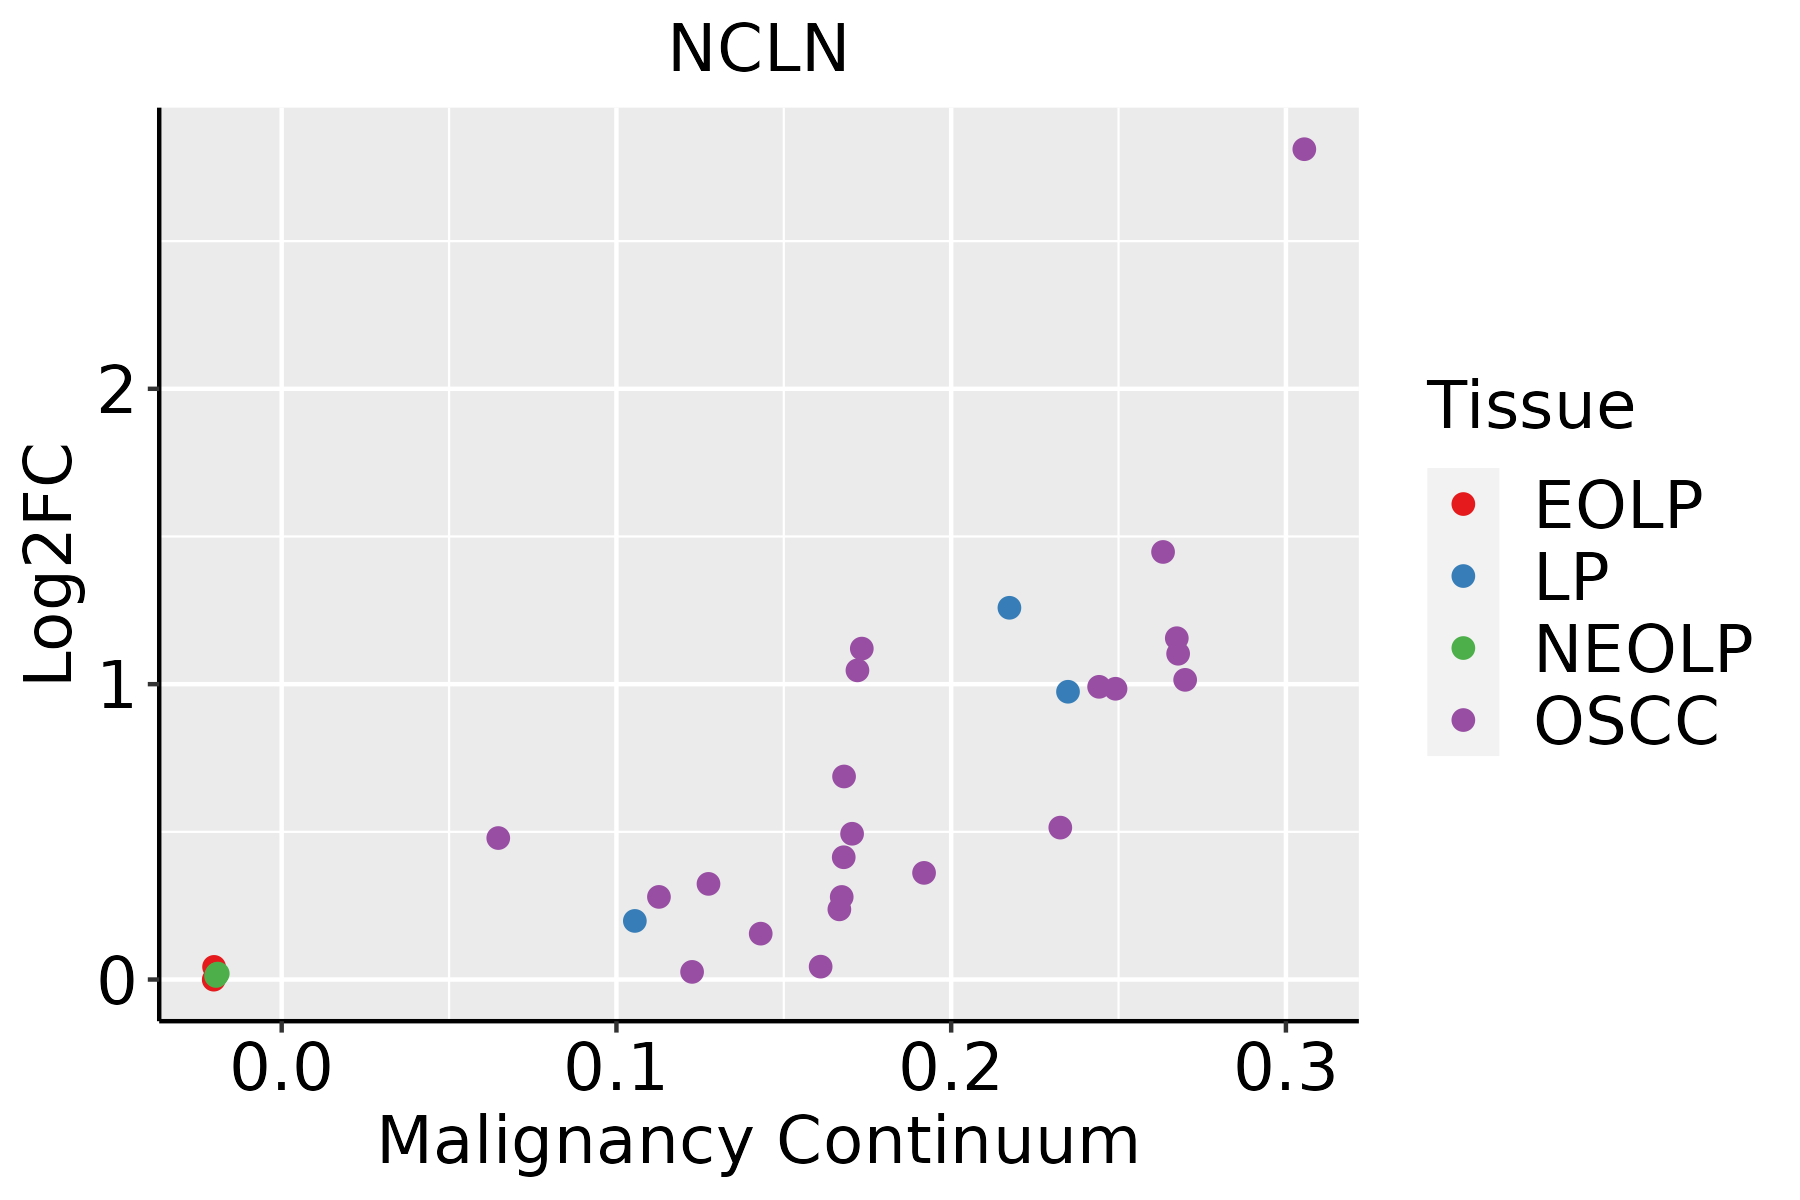 | EOLP: Erosive Oral lichen planus |
| LP: leukoplakia | ||
| NEOLP: Non-erosive oral lichen planus | ||
| OSCC: Oral squamous cell carcinoma | ||
| Skin |  | AK: Actinic keratosis |
| cSCC: Cutaneous squamous cell carcinoma | ||
| SCCIS:squamous cell carcinoma in situ | ||
| Thyroid | 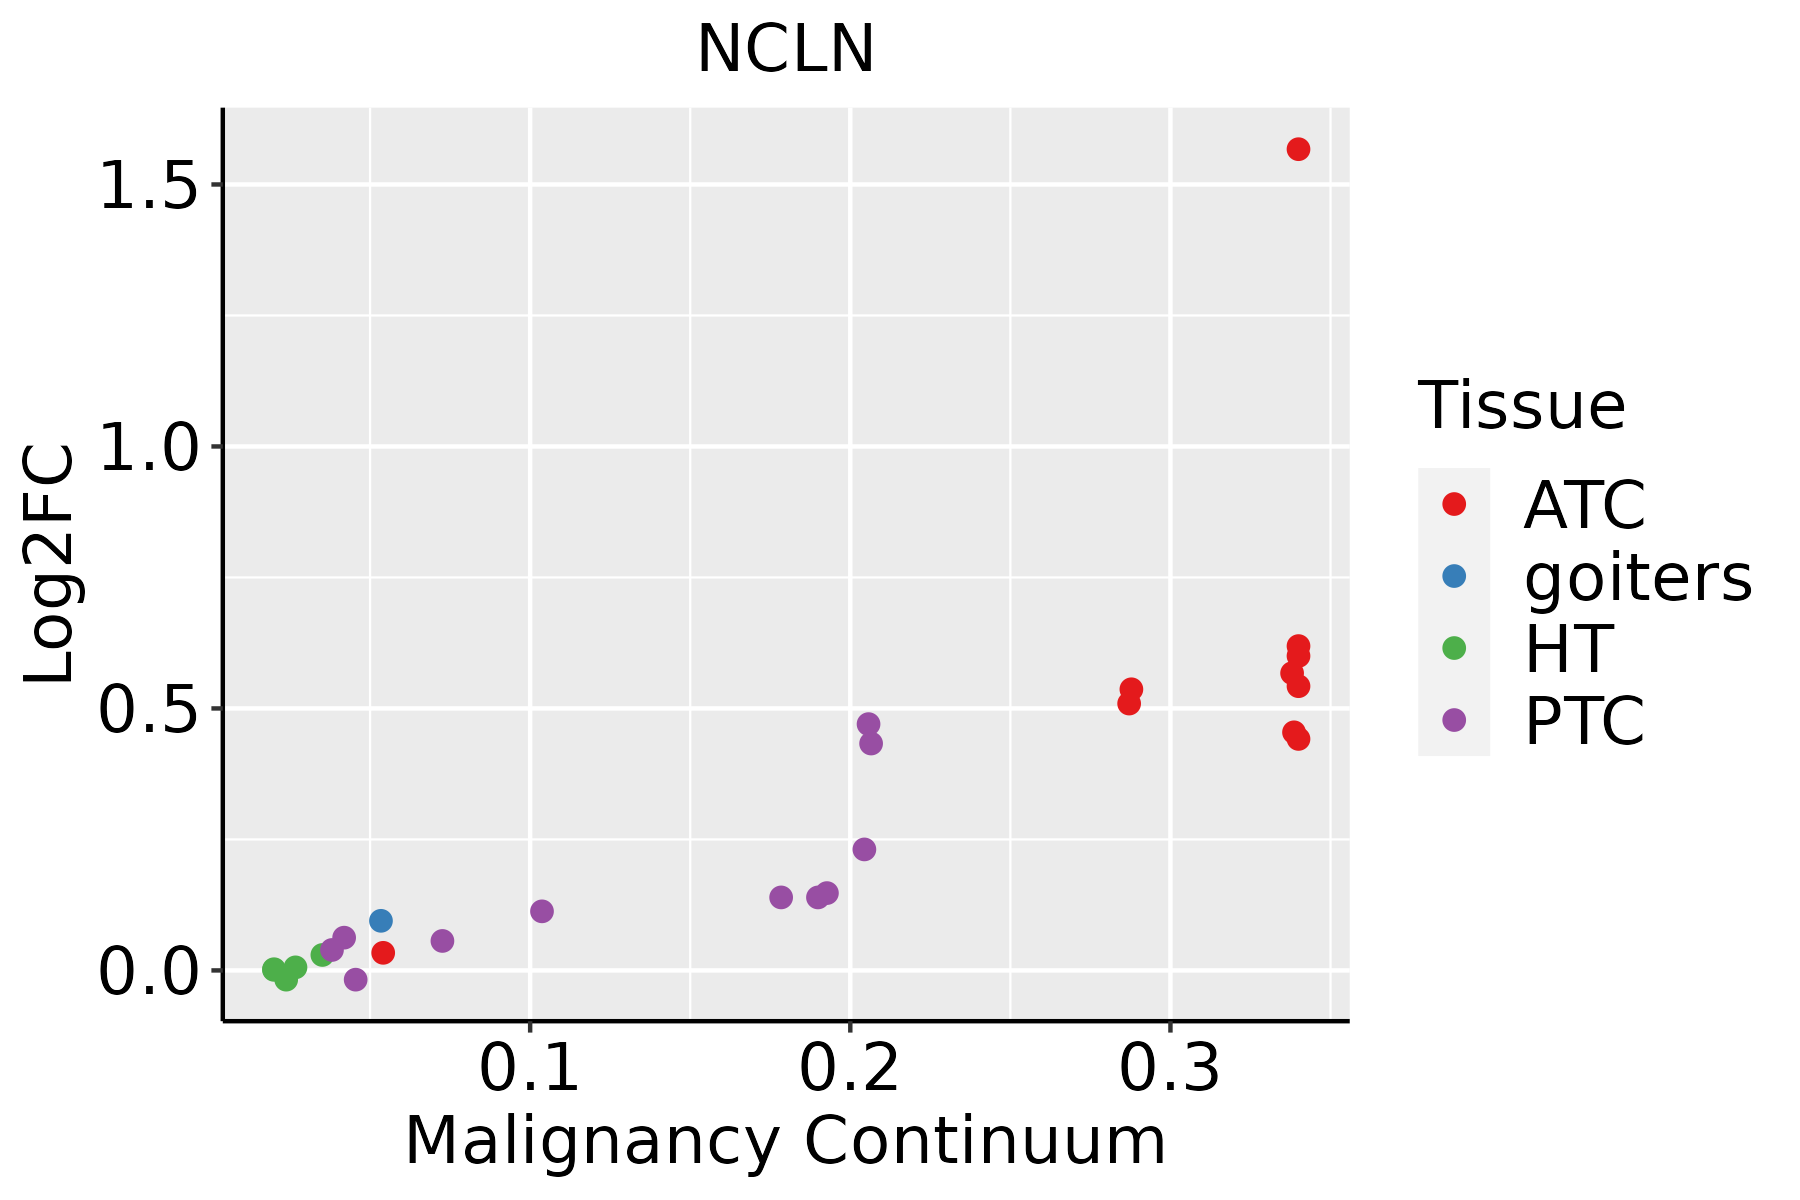 | ATC: Anaplastic thyroid cancer |
| HT: Hashimoto's thyroiditis | ||
| PTC: Papillary thyroid cancer |
| ∗log2FC in expression of this searched gene in stem-like cells from each diseased tissue sample relative to stem-like cells in normal samples in each tissue plotted against the malignancy continuum. Samples are colored based on if they are from different disease stage. |
Top |
Malignant transformation related pathway analysis |
| Find out the enriched GO biological processes and KEGG pathways involved in transition from healthy to precancer to cancer |
| Tissue | Disease Stage | Enriched GO biological Processes |
| Colorectum | AD |  |
| Colorectum | SER |  |
| Colorectum | MSS |  |
| Colorectum | MSI-H |  |
| Colorectum | FAP |  |
| ∗Top 15 enriched GO BP terms are showed in the bar plot of each disease state in each tissue. Each row represents a significant GO biological process which is colored according to the -log10(p.adjust). |
| Page: 1 2 3 4 5 6 7 8 9 |
| GO ID | Tissue | Disease Stage | Description | Gene Ratio | Bg Ratio | pvalue | p.adjust | Count |
| GO:005082120 | Oral cavity | OSCC | protein stabilization | 122/7305 | 191/18723 | 2.69e-12 | 1.09e-10 | 122 |
| GO:0031647110 | Oral cavity | LP | regulation of protein stability | 132/4623 | 298/18723 | 8.16e-14 | 7.99e-12 | 132 |
| GO:0050821110 | Oral cavity | LP | protein stabilization | 88/4623 | 191/18723 | 9.15e-11 | 5.51e-09 | 88 |
| GO:0043254110 | Oral cavity | LP | regulation of protein-containing complex assembly | 163/4623 | 428/18723 | 3.72e-10 | 1.92e-08 | 163 |
| GO:003164729 | Skin | cSCC | regulation of protein stability | 144/4864 | 298/18723 | 6.51e-17 | 6.80e-15 | 144 |
| GO:0050821112 | Skin | cSCC | protein stabilization | 96/4864 | 191/18723 | 5.00e-13 | 2.93e-11 | 96 |
| GO:004325429 | Skin | cSCC | regulation of protein-containing complex assembly | 167/4864 | 428/18723 | 1.60e-09 | 5.97e-08 | 167 |
| GO:0061635 | Skin | cSCC | regulation of protein complex stability | 7/4864 | 11/18723 | 9.45e-03 | 4.25e-02 | 7 |
| GO:0031647113 | Thyroid | PTC | regulation of protein stability | 174/5968 | 298/18723 | 2.05e-21 | 4.05e-19 | 174 |
| GO:0050821113 | Thyroid | PTC | protein stabilization | 115/5968 | 191/18723 | 5.67e-16 | 4.31e-14 | 115 |
| GO:0043254113 | Thyroid | PTC | regulation of protein-containing complex assembly | 215/5968 | 428/18723 | 1.23e-15 | 9.09e-14 | 215 |
| GO:003164734 | Thyroid | ATC | regulation of protein stability | 177/6293 | 298/18723 | 4.08e-20 | 6.46e-18 | 177 |
| GO:0043254210 | Thyroid | ATC | regulation of protein-containing complex assembly | 225/6293 | 428/18723 | 2.72e-16 | 2.33e-14 | 225 |
| GO:005082134 | Thyroid | ATC | protein stabilization | 117/6293 | 191/18723 | 3.98e-15 | 2.71e-13 | 117 |
| Page: 1 2 |
| Pathway ID | Tissue | Disease Stage | Description | Gene Ratio | Bg Ratio | pvalue | p.adjust | qvalue | Count |
| Page: 1 |
Top |
Cell-cell communication analysis |
| Identification of potential cell-cell interactions between two cell types and their ligand-receptor pairs for different disease states |
| Ligand | Receptor | LRpair | Pathway | Tissue | Disease Stage |
| Page: 1 |
Top |
Single-cell gene regulatory network inference analysis |
| Find out the significant the regulons (TFs) and the target genes of each regulon across cell types for different disease states |
| TF | Cell Type | Tissue | Disease Stage | Target Gene | RSS | Regulon Activity |
| ∗The dot plots of a searched regulon are shown for all cell subpopulations in each disease state of each tissue based on the regulon specific score inferred using pySCENIC and by calculating the average expression. |
| Page: 1 |
Top |
Somatic mutation of malignant transformation related genes |
| Annotation of somatic variants for genes involved in malignant transformation |
| Hugo Symbol | Variant Class | Variant Classification | dbSNP RS | HGVSc | HGVSp | HGVSp Short | SWISSPROT | BIOTYPE | SIFT | PolyPhen | Tumor Sample Barcode | Tissue | Histology | Sex | Age | Stage | Therapy Types | Drugs | Outcome |
| NCLN | deletion | Frame_Shift_Del | novel | c.1623delN | p.Ala542LeufsTer17 | p.A542Lfs*17 | Q969V3 | protein_coding | TCGA-D8-A27V-01 | Breast | breast invasive carcinoma | Female | <65 | I/II | Hormone Therapy | tamoxiphen | SD | ||
| NCLN | SNV | Missense_Mutation | c.52C>G | p.Leu18Val | p.L18V | Q969V3 | protein_coding | tolerated(0.13) | benign(0.012) | TCGA-JW-A5VL-01 | Cervix | cervical & endocervical cancer | Female | <65 | I/II | Unknown | Unknown | SD | |
| NCLN | SNV | Missense_Mutation | c.248N>A | p.Arg83His | p.R83H | Q969V3 | protein_coding | tolerated(0.18) | possibly_damaging(0.482) | TCGA-CK-4951-01 | Colorectum | colon adenocarcinoma | Female | >=65 | I/II | Unknown | Unknown | PD | |
| NCLN | SNV | Missense_Mutation | c.1207C>T | p.Arg403Trp | p.R403W | Q969V3 | protein_coding | deleterious(0.02) | probably_damaging(0.923) | TCGA-CM-6171-01 | Colorectum | colon adenocarcinoma | Female | >=65 | I/II | Unknown | Unknown | SD | |
| NCLN | SNV | Missense_Mutation | c.791N>T | p.Thr264Met | p.T264M | Q969V3 | protein_coding | deleterious(0) | probably_damaging(1) | TCGA-D5-6924-01 | Colorectum | colon adenocarcinoma | Male | >=65 | I/II | Unknown | Unknown | SD | |
| NCLN | SNV | Missense_Mutation | c.802T>A | p.Tyr268Asn | p.Y268N | Q969V3 | protein_coding | deleterious(0.01) | possibly_damaging(0.837) | TCGA-G4-6314-01 | Colorectum | colon adenocarcinoma | Female | >=65 | III/IV | Ancillary | leucovorin | SD | |
| NCLN | SNV | Missense_Mutation | novel | c.1660C>A | p.Gln554Lys | p.Q554K | Q969V3 | protein_coding | tolerated(1) | benign(0.086) | TCGA-A5-A0G1-01 | Endometrium | uterine corpus endometrioid carcinoma | Female | >=65 | I/II | Unknown | Unknown | SD |
| NCLN | SNV | Missense_Mutation | rs564407893 | c.637N>A | p.Gly213Arg | p.G213R | Q969V3 | protein_coding | tolerated(0.37) | benign(0.081) | TCGA-AP-A051-01 | Endometrium | uterine corpus endometrioid carcinoma | Female | >=65 | I/II | Unknown | Unknown | SD |
| NCLN | SNV | Missense_Mutation | c.1120C>T | p.Arg374Cys | p.R374C | Q969V3 | protein_coding | deleterious(0) | probably_damaging(0.91) | TCGA-AX-A1CE-01 | Endometrium | uterine corpus endometrioid carcinoma | Female | <65 | I/II | Unspecific | Paclitaxel | SD | |
| NCLN | SNV | Missense_Mutation | novel | c.1144N>A | p.Ala382Thr | p.A382T | Q969V3 | protein_coding | deleterious(0) | possibly_damaging(0.84) | TCGA-AX-A2HD-01 | Endometrium | uterine corpus endometrioid carcinoma | Female | >=65 | III/IV | Unknown | Unknown | SD |
| Page: 1 2 3 |
Top |
Related drugs of malignant transformation related genes |
| Identification of chemicals and drugs interact with genes involved in malignant transfromation |
| (DGIdb 4.0) |
| Entrez ID | Symbol | Category | Interaction Types | Drug Claim Name | Drug Name | PMIDs |
| Page: 1 |

Copyright 2023-Present -The University of Texas Health Science Center at Houston |