| Tissue | Expression Dynamics | Abbreviation |
| Breast |  | IDC: Invasive ductal carcinoma |
| DCIS: Ductal carcinoma in situ |
| Precancer(BRCA1-mut): Precancerous lesion from BRCA1 mutation carriers |
| Cervix | 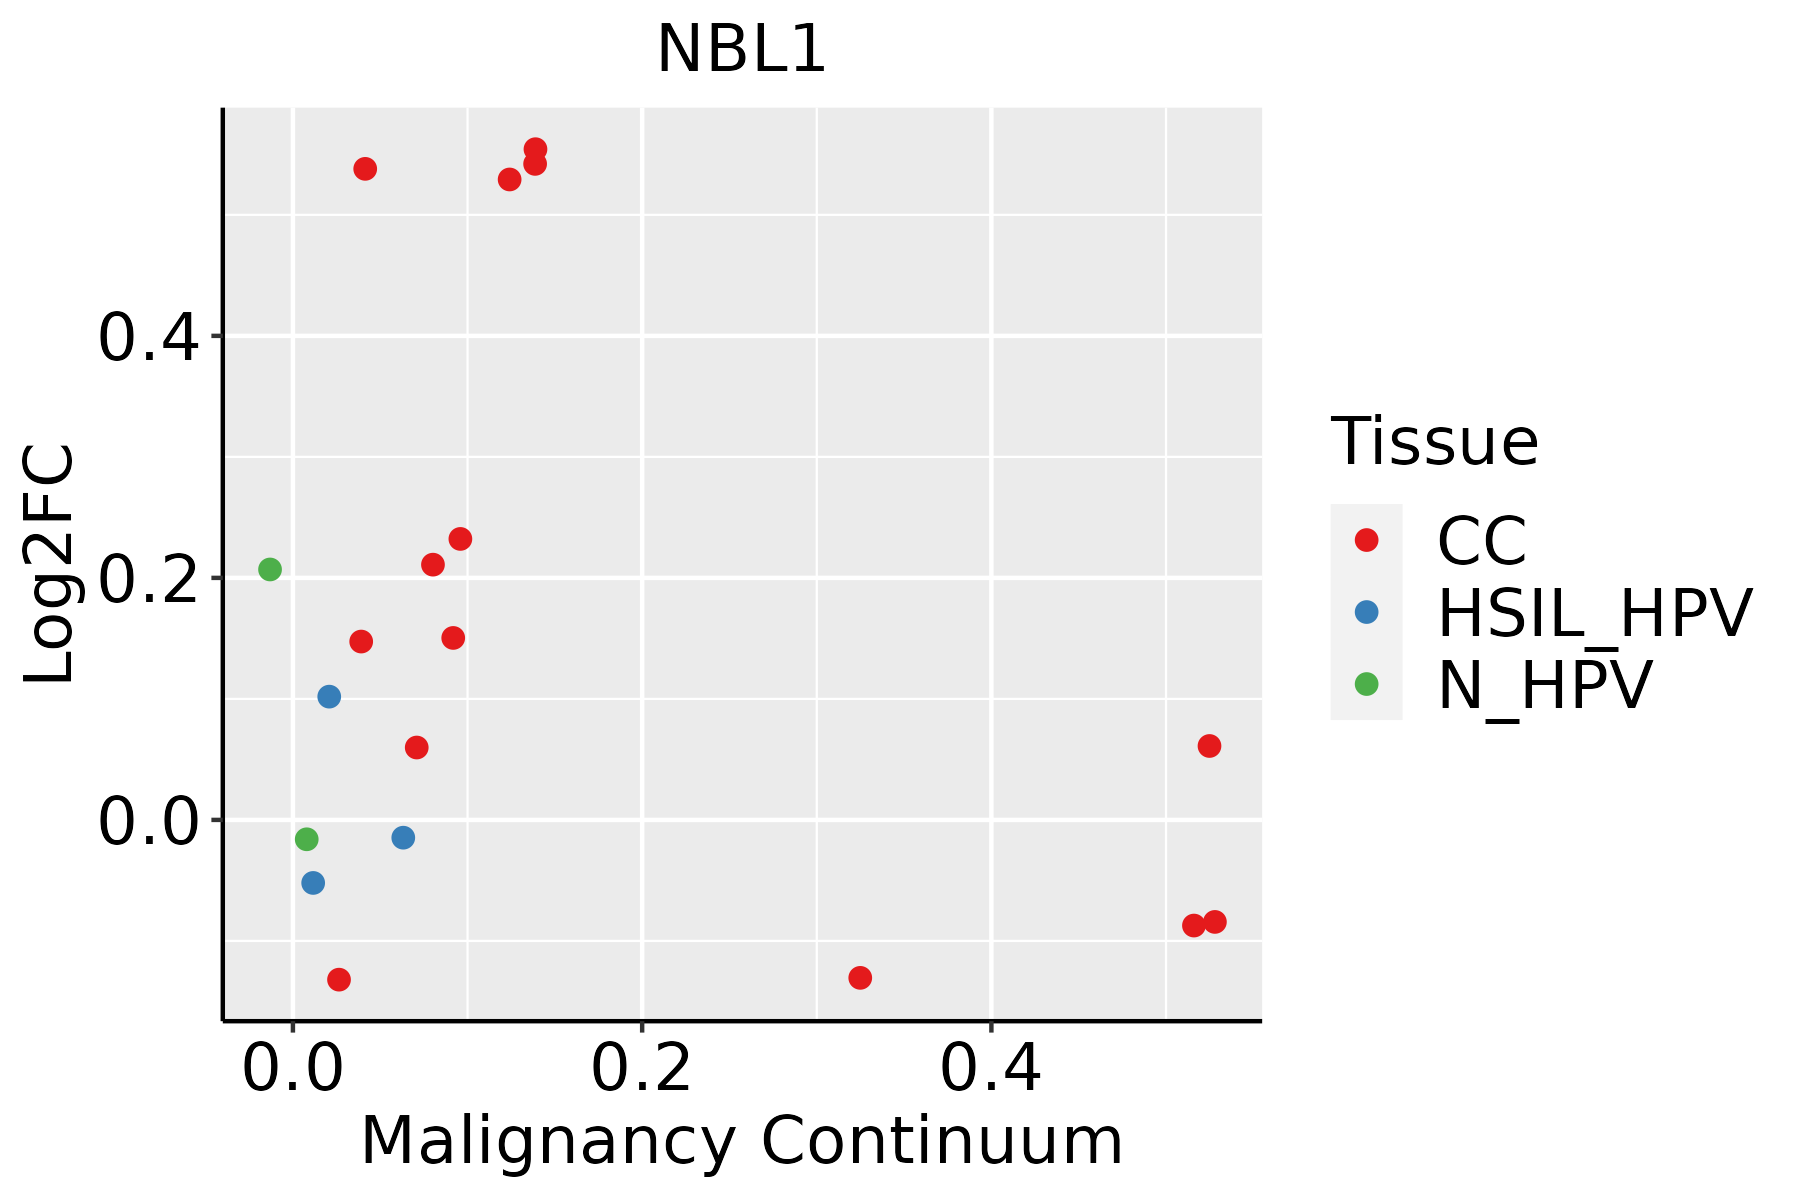 | CC: Cervix cancer |
| HSIL_HPV: HPV-infected high-grade squamous intraepithelial lesions |
| N_HPV: HPV-infected normal cervix |
| Colorectum (GSE201348) |  | FAP: Familial adenomatous polyposis |
| CRC: Colorectal cancer |
| Colorectum (HTA11) | 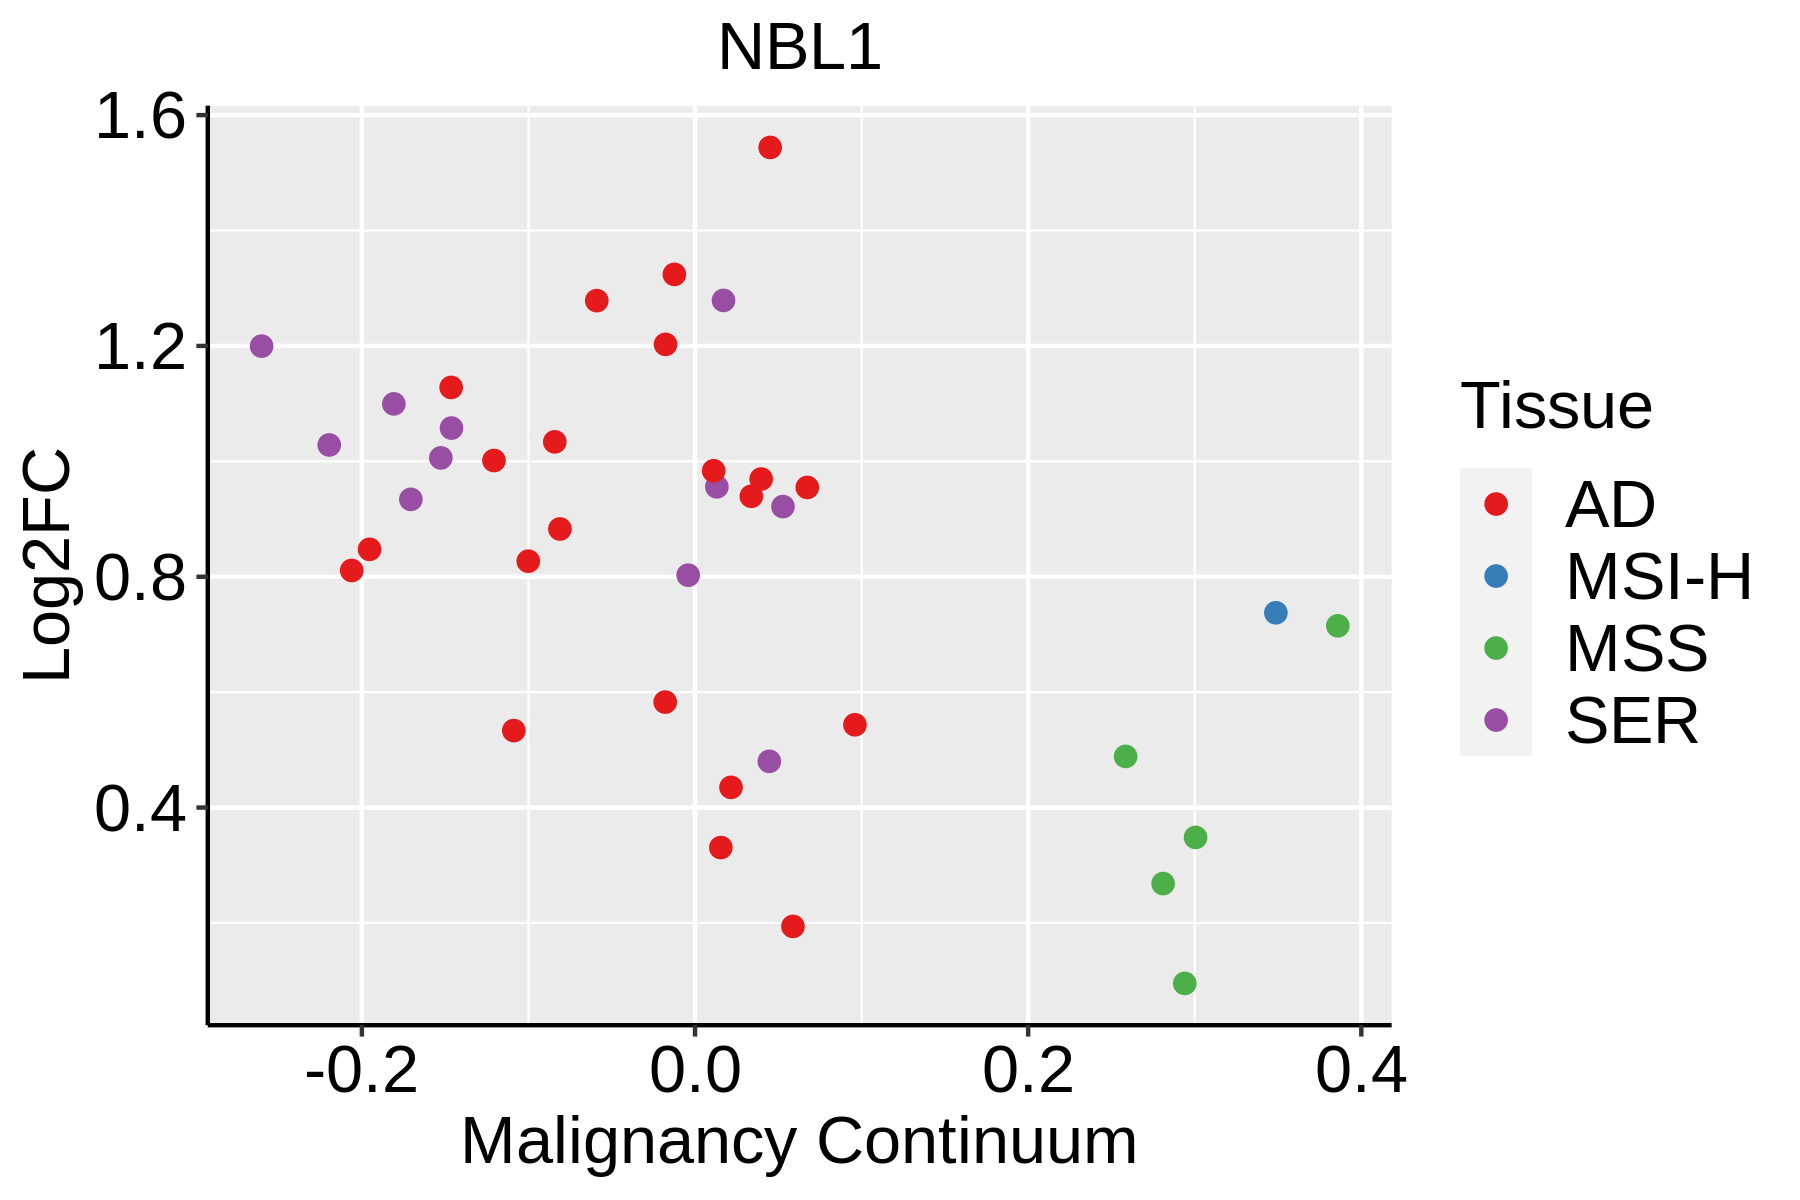 | AD: Adenomas |
| SER: Sessile serrated lesions |
| MSI-H: Microsatellite-high colorectal cancer |
| MSS: Microsatellite stable colorectal cancer |
| Endometrium | 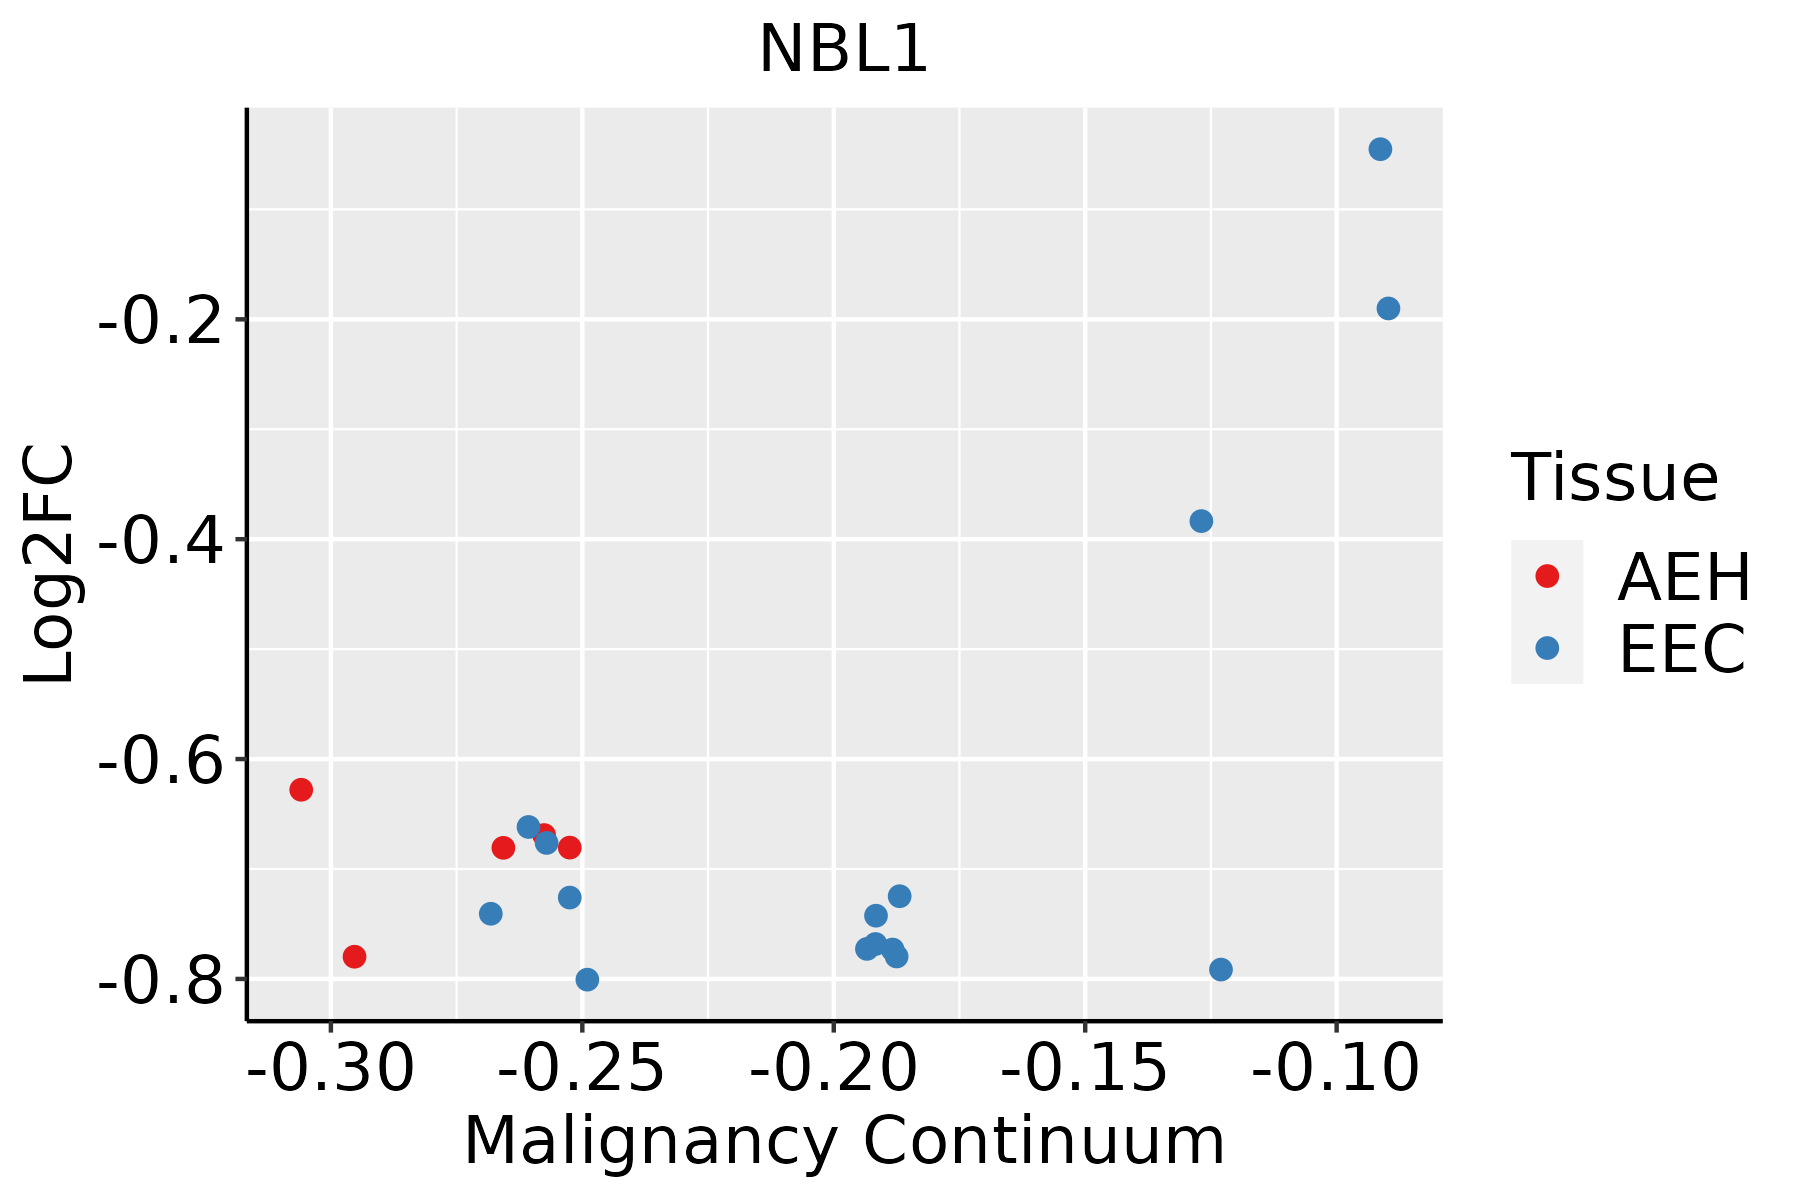 | AEH: Atypical endometrial hyperplasia |
| EEC: Endometrioid Cancer |
| Esophagus | 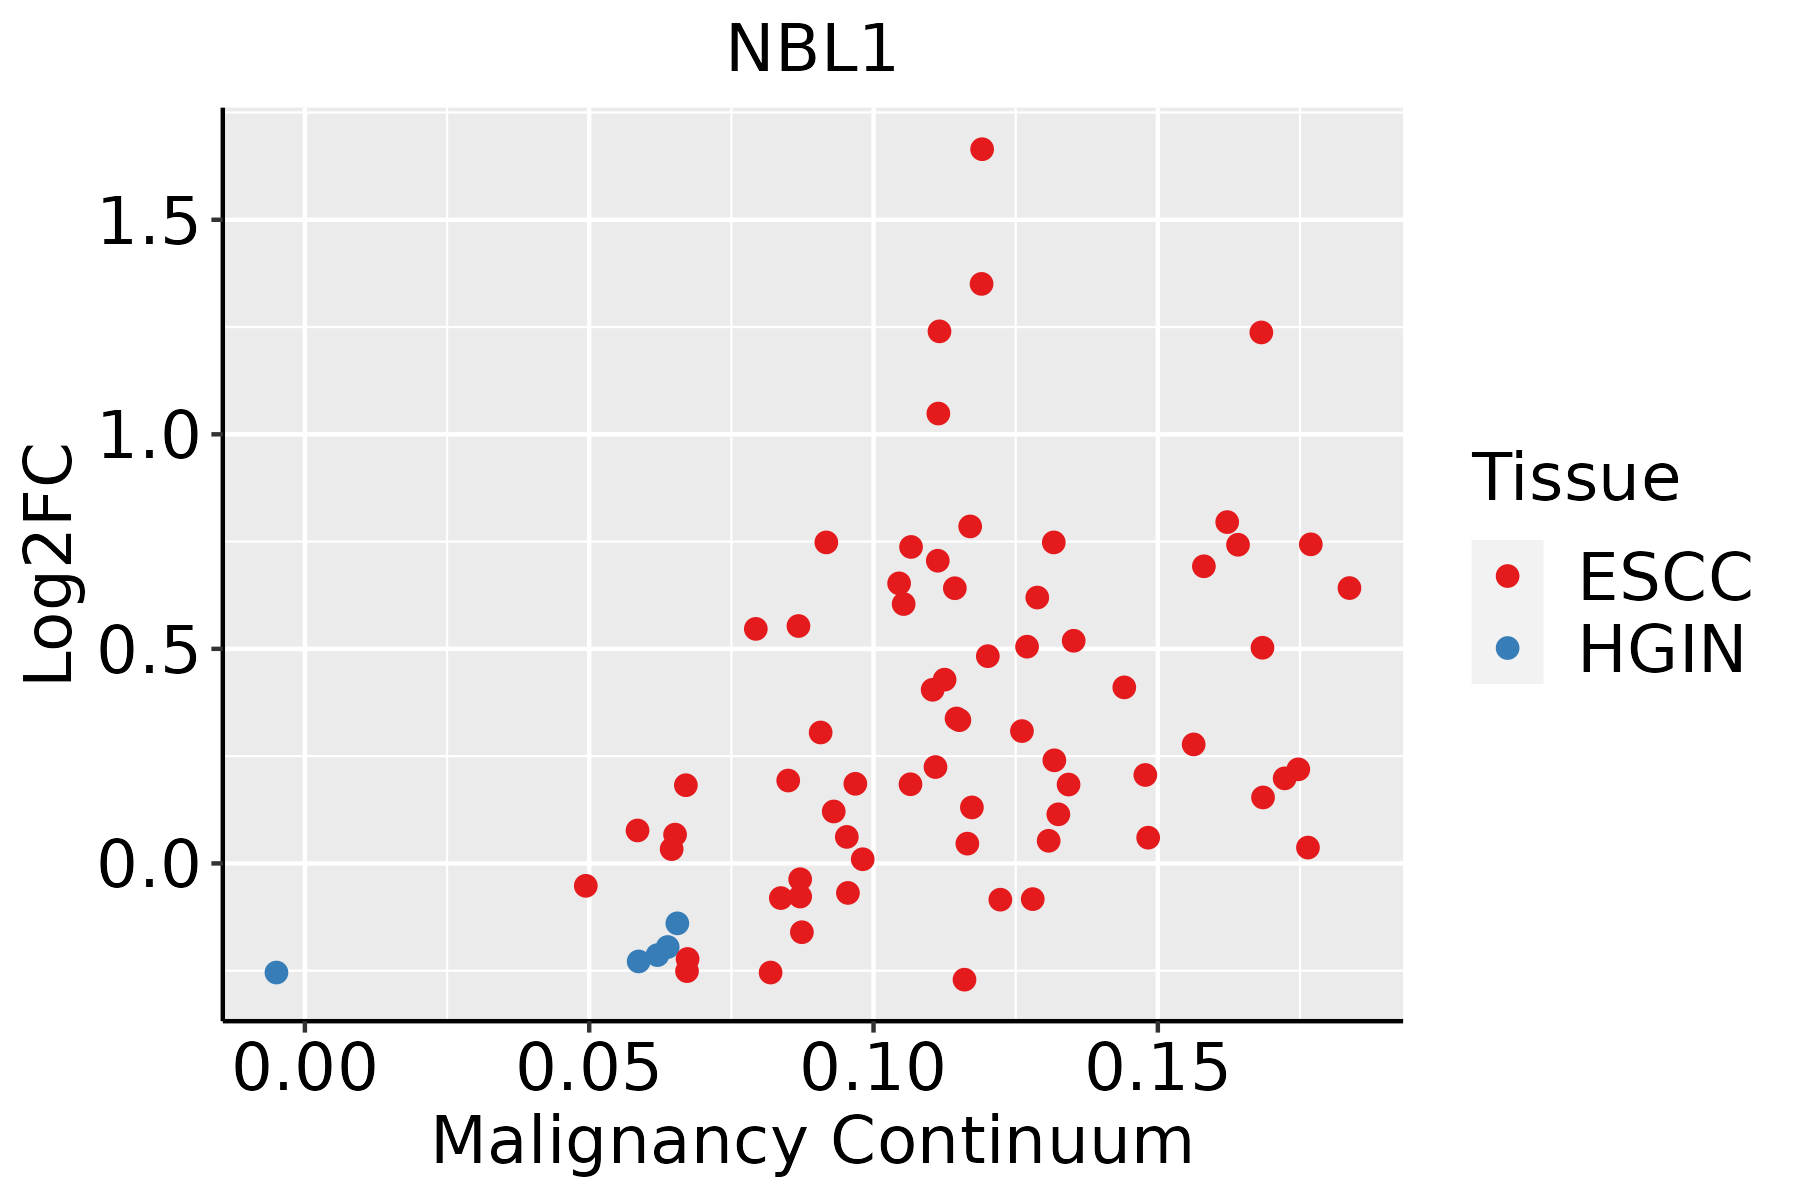 | ESCC: Esophageal squamous cell carcinoma |
| HGIN: High-grade intraepithelial neoplasias |
| LGIN: Low-grade intraepithelial neoplasias |
| GC | 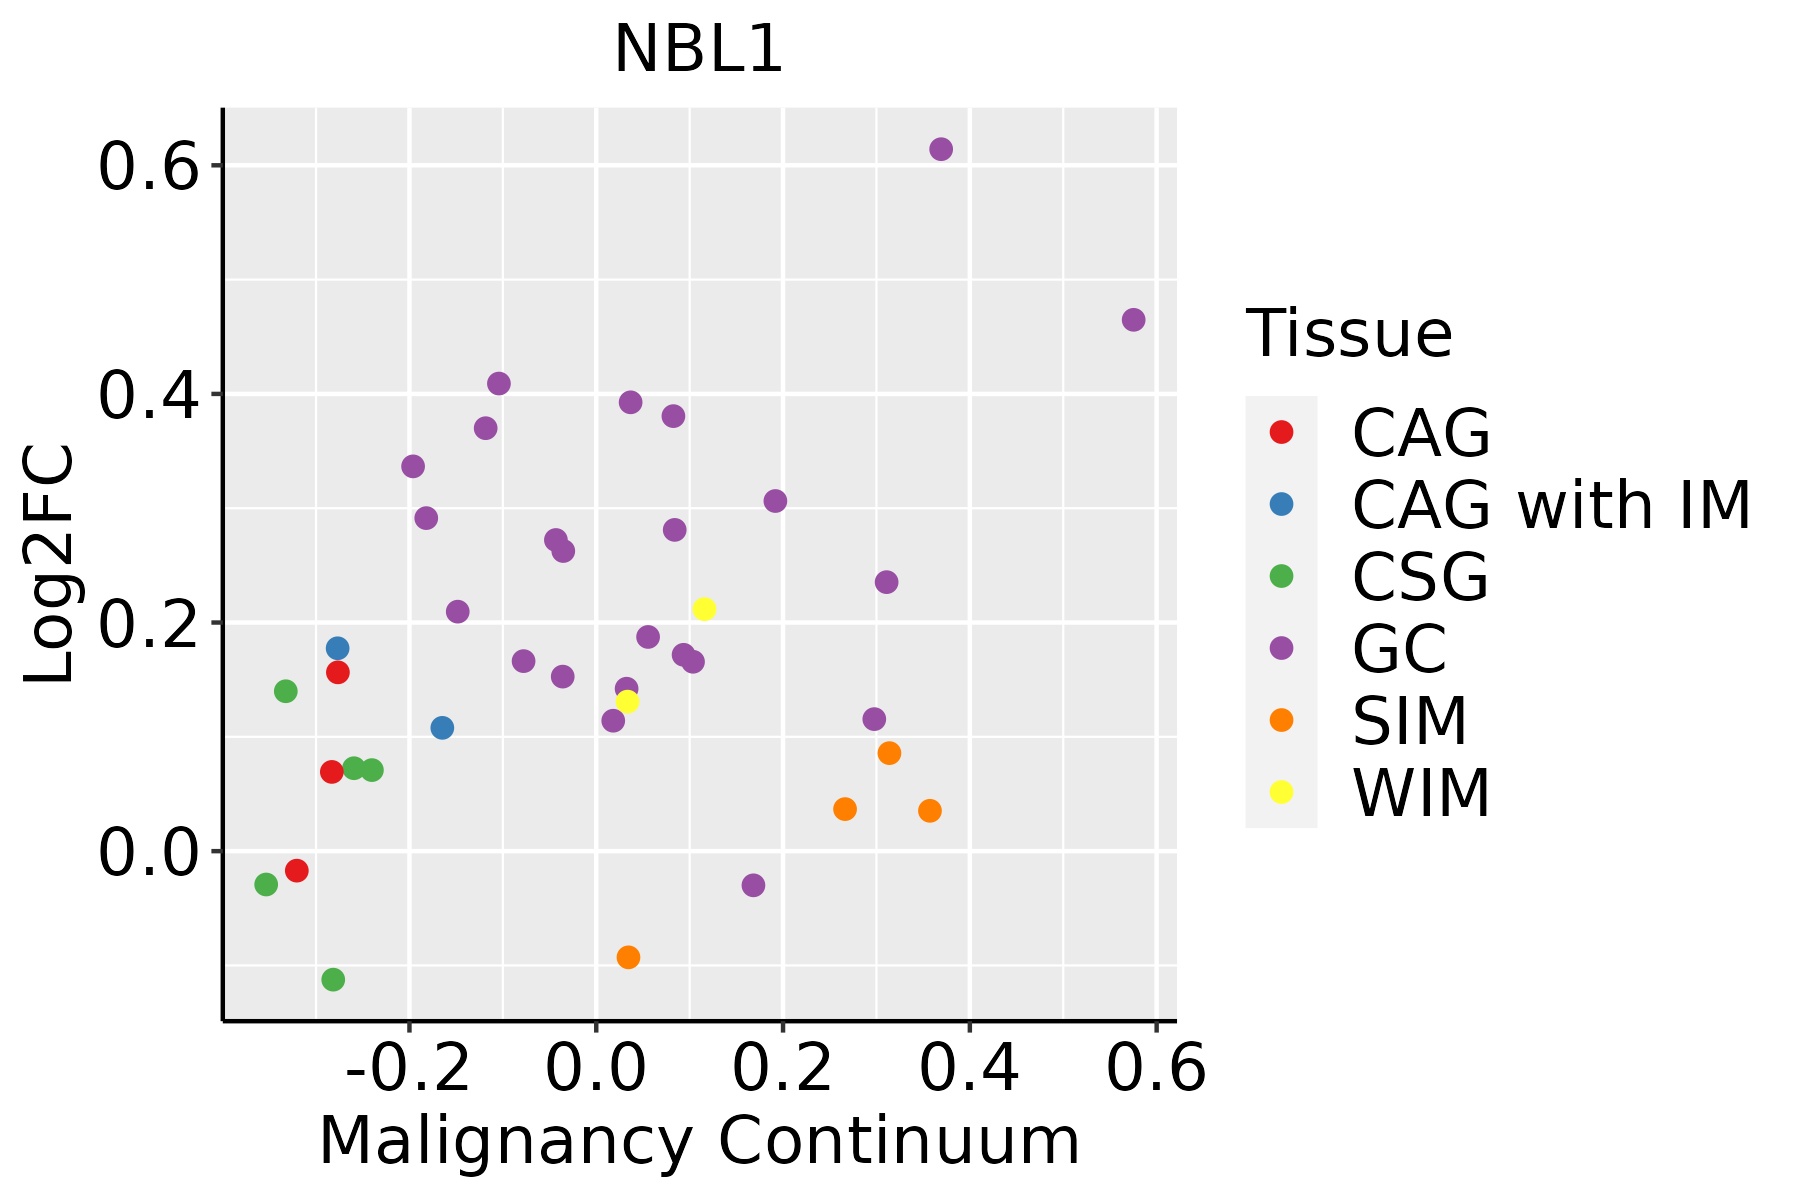 | CAG: Chronic atrophic gastritis |
| CAG with IM: Chronic atrophic gastritis with intestinal metaplasia |
| CSG: Chronic superficial gastritis |
| GC: Gastric cancer |
| SIM: Severe intestinal metaplasia |
| WIM: Wild intestinal metaplasia |
| Oral Cavity | 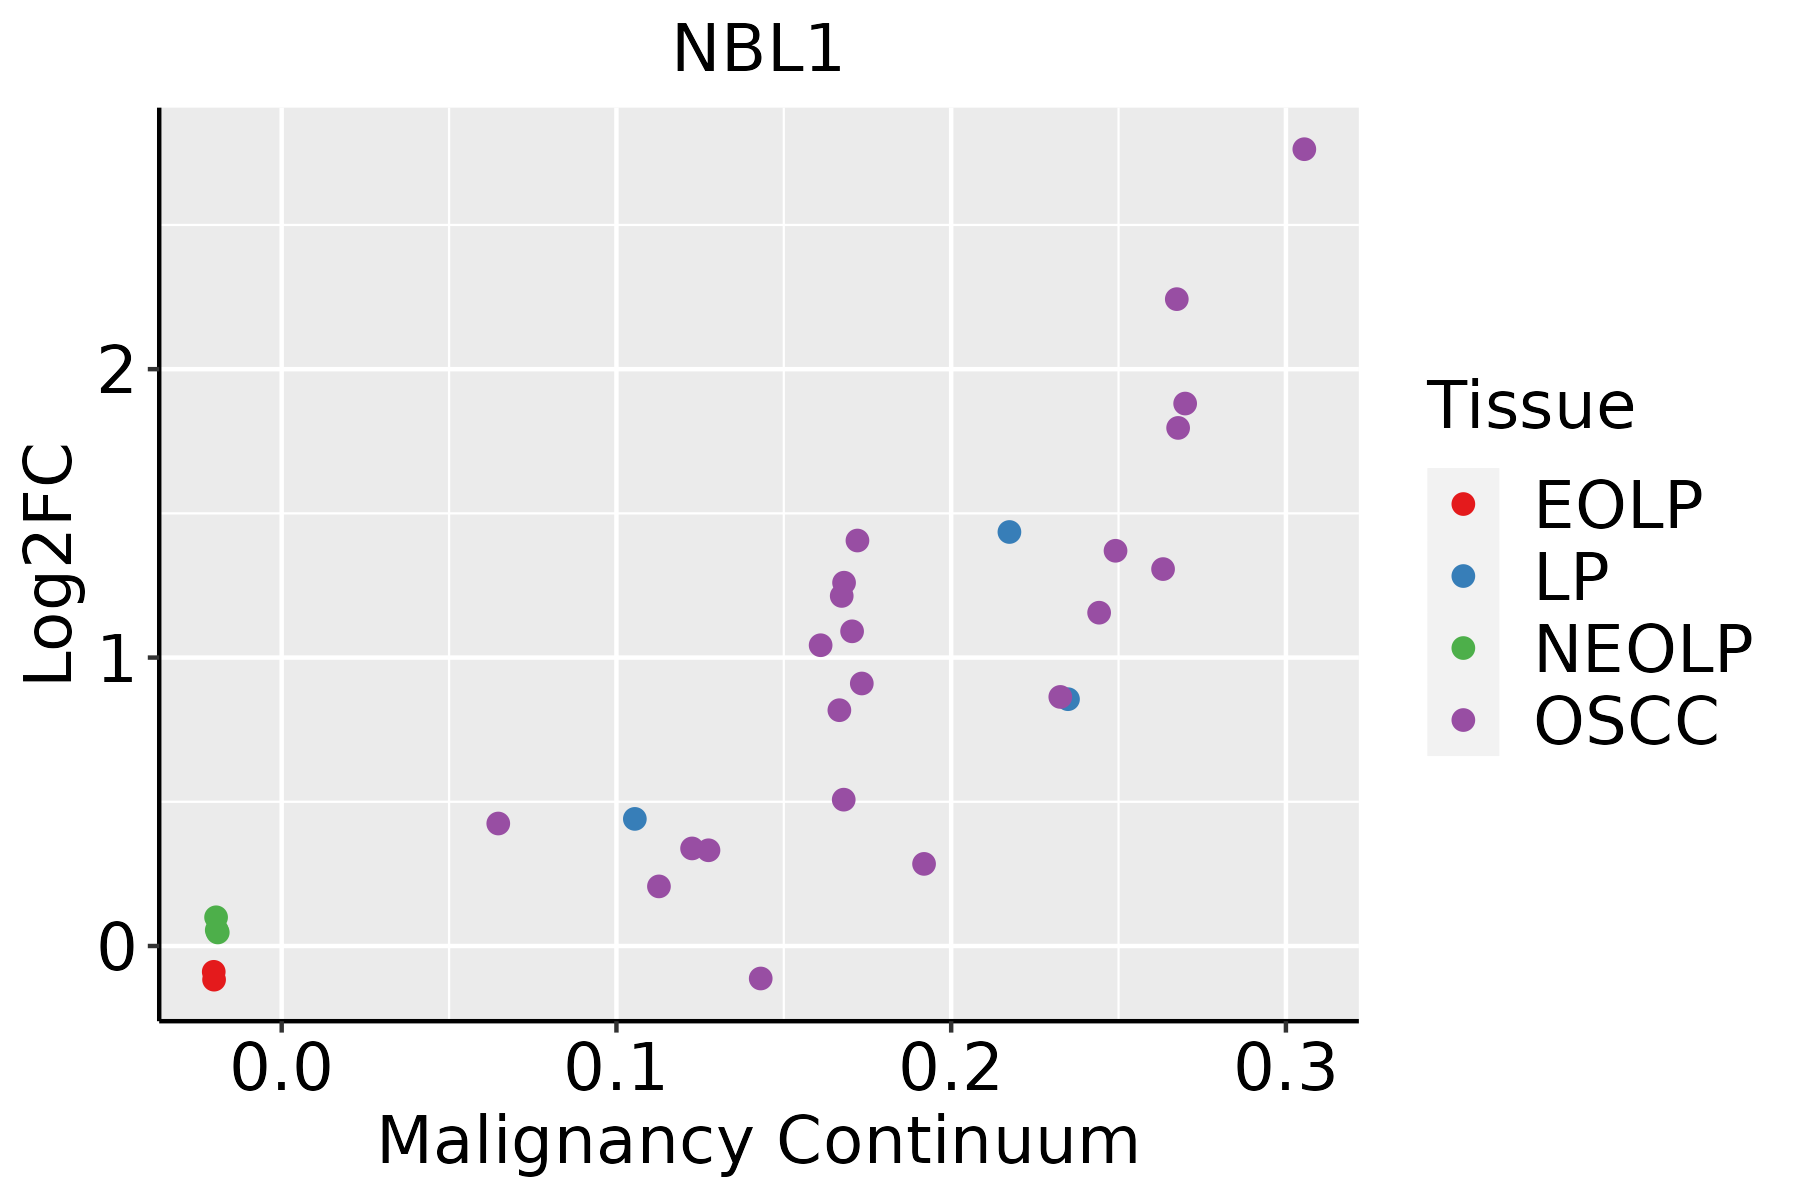 | EOLP: Erosive Oral lichen planus |
| LP: leukoplakia |
| NEOLP: Non-erosive oral lichen planus |
| OSCC: Oral squamous cell carcinoma |
| Prostate | 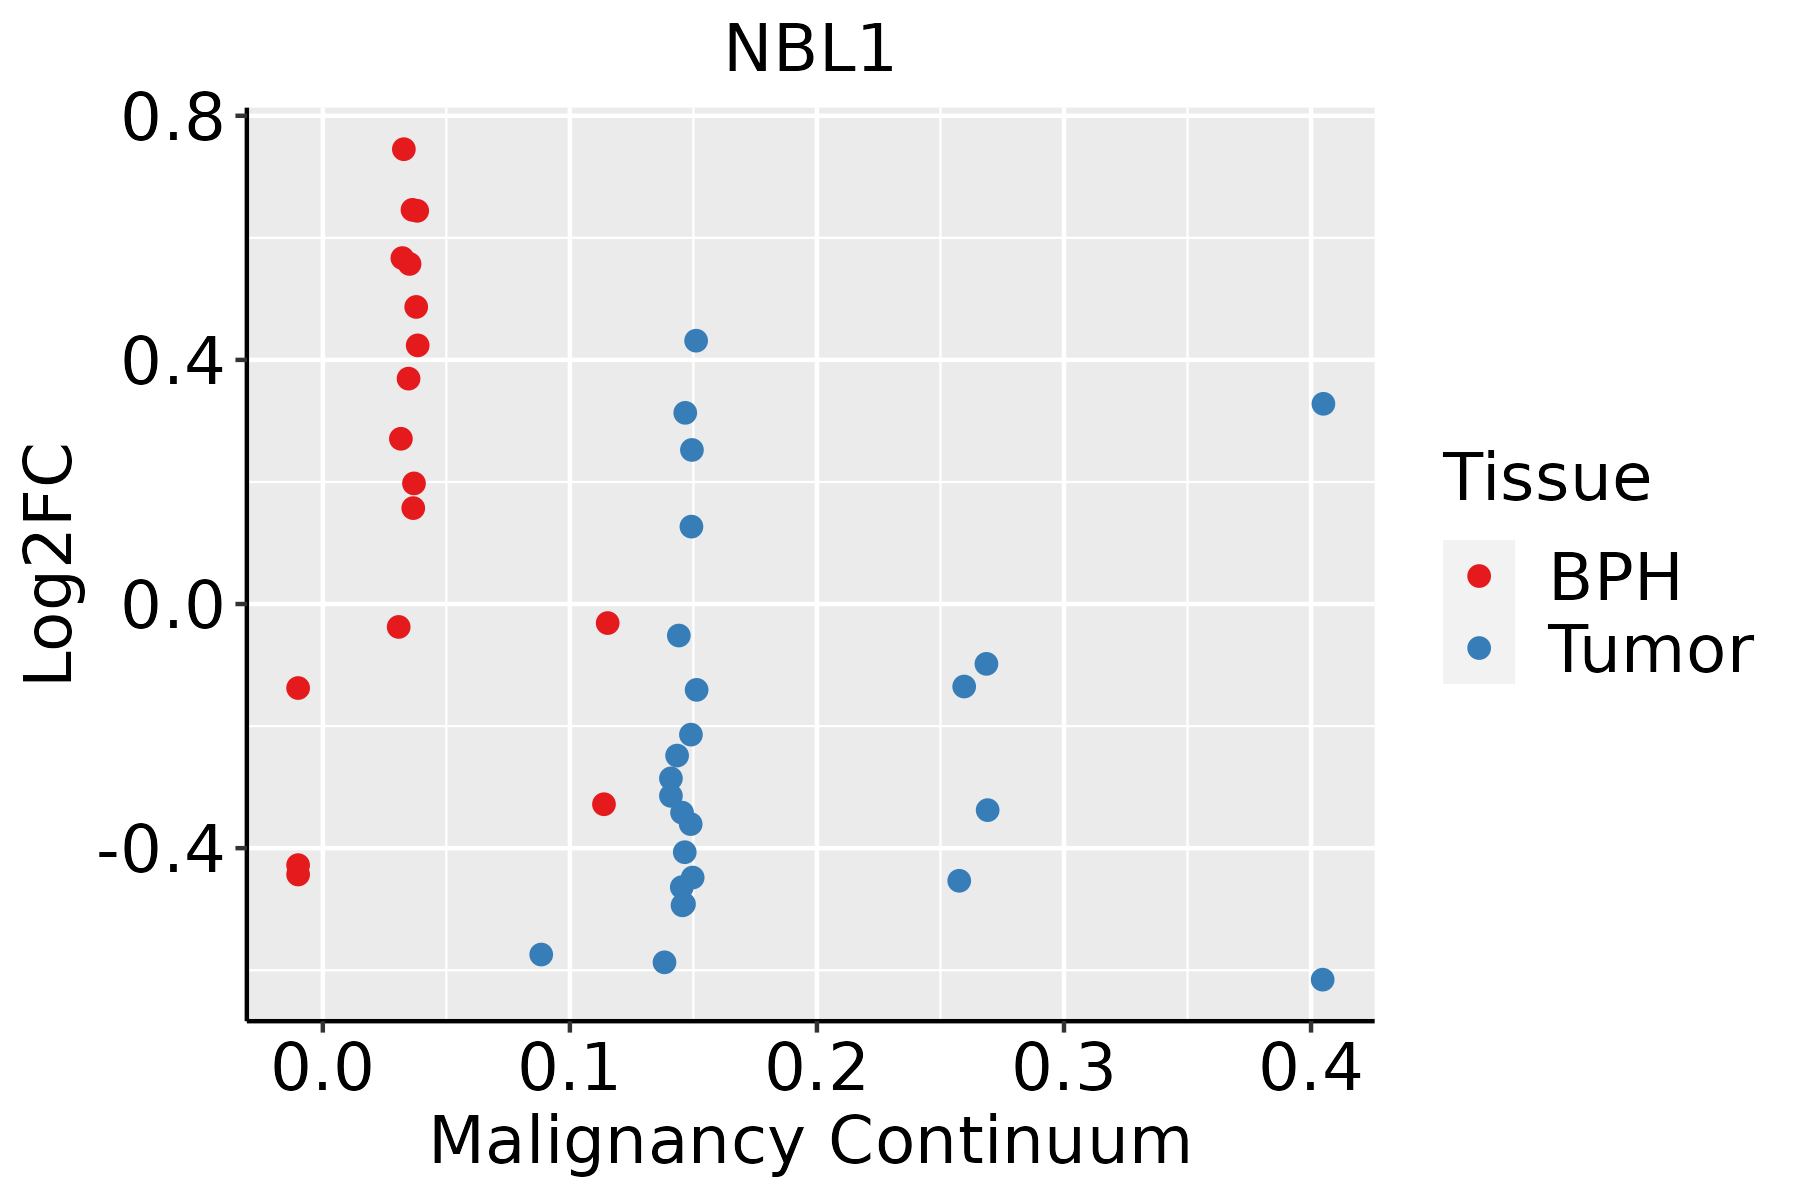 | BPH: Benign Prostatic Hyperplasia |
| Skin | 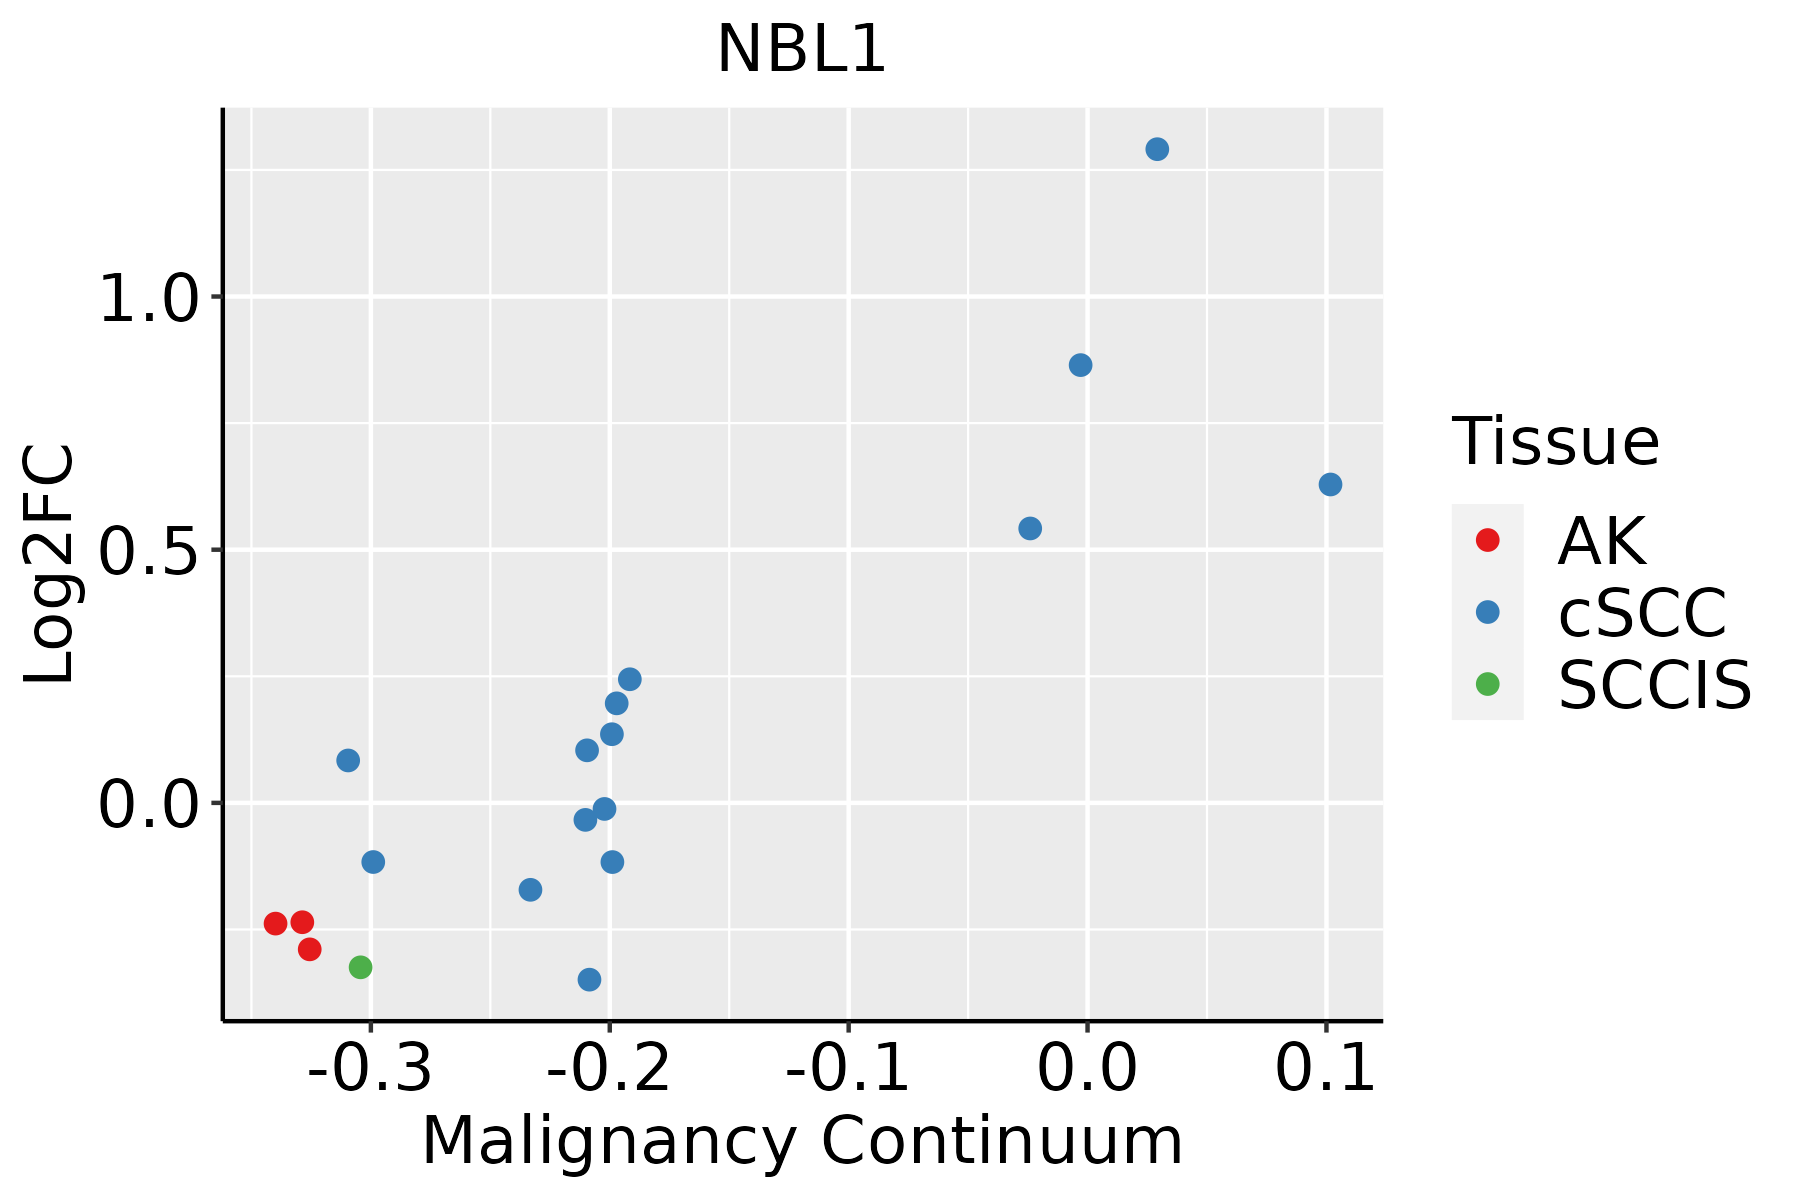 | AK: Actinic keratosis |
| cSCC: Cutaneous squamous cell carcinoma |
| SCCIS:squamous cell carcinoma in situ |
| Thyroid |  | ATC: Anaplastic thyroid cancer |
| HT: Hashimoto's thyroiditis |
| PTC: Papillary thyroid cancer |
| GO ID | Tissue | Disease Stage | Description | Gene Ratio | Bg Ratio | pvalue | p.adjust | Count |
| GO:006032611 | Breast | IDC | cell chemotaxis | 46/1434 | 310/18723 | 1.13e-05 | 3.08e-04 | 46 |
| GO:000268511 | Breast | IDC | regulation of leukocyte migration | 33/1434 | 210/18723 | 6.10e-05 | 1.27e-03 | 33 |
| GO:000268311 | Breast | IDC | negative regulation of immune system process | 55/1434 | 434/18723 | 1.53e-04 | 2.67e-03 | 55 |
| GO:00512712 | Breast | IDC | negative regulation of cellular component movement | 48/1434 | 367/18723 | 1.88e-04 | 3.12e-03 | 48 |
| GO:20001462 | Breast | IDC | negative regulation of cell motility | 46/1434 | 359/18723 | 4.01e-04 | 5.60e-03 | 46 |
| GO:007167511 | Breast | IDC | regulation of mononuclear cell migration | 20/1434 | 115/18723 | 4.35e-04 | 5.90e-03 | 20 |
| GO:007167411 | Breast | IDC | mononuclear cell migration | 29/1434 | 196/18723 | 4.68e-04 | 6.26e-03 | 29 |
| GO:000268811 | Breast | IDC | regulation of leukocyte chemotaxis | 20/1434 | 122/18723 | 9.46e-04 | 1.08e-02 | 20 |
| GO:00303362 | Breast | IDC | negative regulation of cell migration | 43/1434 | 344/18723 | 1.01e-03 | 1.13e-02 | 43 |
| GO:00900251 | Breast | IDC | regulation of monocyte chemotaxis | 8/1434 | 29/18723 | 1.16e-03 | 1.26e-02 | 8 |
| GO:00400132 | Breast | IDC | negative regulation of locomotion | 47/1434 | 391/18723 | 1.39e-03 | 1.43e-02 | 47 |
| GO:000254811 | Breast | IDC | monocyte chemotaxis | 13/1434 | 70/18723 | 2.29e-03 | 2.09e-02 | 13 |
| GO:007169212 | Breast | IDC | protein localization to extracellular region | 42/1434 | 368/18723 | 6.13e-03 | 4.38e-02 | 42 |
| GO:009752921 | Breast | DCIS | myeloid leukocyte migration | 38/1390 | 220/18723 | 8.44e-07 | 3.44e-05 | 38 |
| GO:003059521 | Breast | DCIS | leukocyte chemotaxis | 39/1390 | 230/18723 | 9.85e-07 | 3.93e-05 | 39 |
| GO:005090021 | Breast | DCIS | leukocyte migration | 54/1390 | 369/18723 | 1.22e-06 | 4.78e-05 | 54 |
| GO:004518521 | Breast | DCIS | maintenance of protein location | 21/1390 | 94/18723 | 4.12e-06 | 1.24e-04 | 21 |
| GO:006032621 | Breast | DCIS | cell chemotaxis | 46/1390 | 310/18723 | 5.05e-06 | 1.48e-04 | 46 |
| GO:005123523 | Breast | DCIS | maintenance of location | 47/1390 | 327/18723 | 9.55e-06 | 2.56e-04 | 47 |
| GO:000268321 | Breast | DCIS | negative regulation of immune system process | 57/1390 | 434/18723 | 1.81e-05 | 4.35e-04 | 57 |
| Pathway ID | Tissue | Disease Stage | Description | Gene Ratio | Bg Ratio | pvalue | p.adjust | qvalue | Count |
| hsa04350 | Colorectum | SER | TGF-beta signaling pathway | 31/1580 | 108/8465 | 7.00e-03 | 3.77e-02 | 2.74e-02 | 31 |
| hsa043501 | Colorectum | SER | TGF-beta signaling pathway | 31/1580 | 108/8465 | 7.00e-03 | 3.77e-02 | 2.74e-02 | 31 |
| hsa043504 | Endometrium | AEH | TGF-beta signaling pathway | 26/1197 | 108/8465 | 3.82e-03 | 2.18e-02 | 1.59e-02 | 26 |
| hsa0435011 | Endometrium | AEH | TGF-beta signaling pathway | 26/1197 | 108/8465 | 3.82e-03 | 2.18e-02 | 1.59e-02 | 26 |
| hsa043502 | Endometrium | EEC | TGF-beta signaling pathway | 26/1237 | 108/8465 | 5.95e-03 | 3.12e-02 | 2.33e-02 | 26 |
| hsa043503 | Endometrium | EEC | TGF-beta signaling pathway | 26/1237 | 108/8465 | 5.95e-03 | 3.12e-02 | 2.33e-02 | 26 |
| hsa043507 | Esophagus | ESCC | TGF-beta signaling pathway | 69/4205 | 108/8465 | 1.92e-03 | 5.54e-03 | 2.84e-03 | 69 |
| hsa0435014 | Esophagus | ESCC | TGF-beta signaling pathway | 69/4205 | 108/8465 | 1.92e-03 | 5.54e-03 | 2.84e-03 | 69 |
| hsa043506 | Oral cavity | OSCC | TGF-beta signaling pathway | 60/3704 | 108/8465 | 8.66e-03 | 1.97e-02 | 1.00e-02 | 60 |
| hsa0435013 | Oral cavity | OSCC | TGF-beta signaling pathway | 60/3704 | 108/8465 | 8.66e-03 | 1.97e-02 | 1.00e-02 | 60 |
| hsa043505 | Prostate | BPH | TGF-beta signaling pathway | 35/1718 | 108/8465 | 1.98e-03 | 7.92e-03 | 4.90e-03 | 35 |
| hsa0435012 | Prostate | BPH | TGF-beta signaling pathway | 35/1718 | 108/8465 | 1.98e-03 | 7.92e-03 | 4.90e-03 | 35 |
| hsa0435021 | Prostate | Tumor | TGF-beta signaling pathway | 39/1791 | 108/8465 | 2.33e-04 | 1.35e-03 | 8.39e-04 | 39 |
| hsa0435031 | Prostate | Tumor | TGF-beta signaling pathway | 39/1791 | 108/8465 | 2.33e-04 | 1.35e-03 | 8.39e-04 | 39 |
| Hugo Symbol | Variant Class | Variant Classification | dbSNP RS | HGVSc | HGVSp | HGVSp Short | SWISSPROT | BIOTYPE | SIFT | PolyPhen | Tumor Sample Barcode | Tissue | Histology | Sex | Age | Stage | Therapy Types | Drugs | Outcome |
| NBL1 | SNV | Missense_Mutation | | c.67N>A | p.Gly23Ser | p.G23S | P41271 | protein_coding | tolerated_low_confidence(0.34) | benign(0) | TCGA-A8-A09Z-01 | Breast | breast invasive carcinoma | Female | >=65 | I/II | Unknown | Unknown | SD |
| NBL1 | SNV | Missense_Mutation | novel | c.556N>T | p.His186Tyr | p.H186Y | P41271 | protein_coding | tolerated_low_confidence(0.26) | possibly_damaging(0.782) | TCGA-E9-A1R4-01 | Breast | breast invasive carcinoma | Female | >=65 | I/II | Chemotherapy | 5-fluorouracil | SD |
| NBL1 | SNV | Missense_Mutation | rs765257995 | c.211N>A | p.Glu71Lys | p.E71K | P41271 | protein_coding | tolerated(0.23) | probably_damaging(0.991) | TCGA-EX-A69L-01 | Cervix | cervical & endocervical cancer | Female | <65 | I/II | Unknown | Unknown | SD |
| NBL1 | SNV | Missense_Mutation | | c.326N>C | p.Gln109Pro | p.Q109P | P41271 | protein_coding | tolerated(0.08) | probably_damaging(0.991) | TCGA-AA-3663-01 | Colorectum | colon adenocarcinoma | Male | <65 | I/II | Unknown | Unknown | SD |
| NBL1 | SNV | Missense_Mutation | rs750974701 | c.404C>T | p.Pro135Leu | p.P135L | P41271 | protein_coding | deleterious(0) | probably_damaging(0.998) | TCGA-CM-6164-01 | Colorectum | colon adenocarcinoma | Female | <65 | I/II | Unknown | Unknown | SD |
| NBL1 | SNV | Missense_Mutation | rs765257995 | c.211G>A | p.Glu71Lys | p.E71K | P41271 | protein_coding | tolerated(0.23) | probably_damaging(0.991) | TCGA-AP-A056-01 | Endometrium | uterine corpus endometrioid carcinoma | Female | <65 | I/II | Unknown | Unknown | SD |
| NBL1 | SNV | Missense_Mutation | novel | c.336G>T | p.Glu112Asp | p.E112D | P41271 | protein_coding | tolerated(0.38) | probably_damaging(0.986) | TCGA-AP-A1E0-01 | Endometrium | uterine corpus endometrioid carcinoma | Female | <65 | III/IV | Chemotherapy | paclitaxel | SD |
| NBL1 | SNV | Missense_Mutation | novel | c.193G>T | p.Asp65Tyr | p.D65Y | P41271 | protein_coding | deleterious(0) | probably_damaging(0.999) | TCGA-AX-A2HC-01 | Endometrium | uterine corpus endometrioid carcinoma | Female | <65 | III/IV | Chemotherapy | paclitaxel | PD |
| NBL1 | SNV | Missense_Mutation | | c.326A>G | p.Gln109Arg | p.Q109R | P41271 | protein_coding | deleterious(0.02) | probably_damaging(0.979) | TCGA-B5-A3FC-01 | Endometrium | uterine corpus endometrioid carcinoma | Female | <65 | I/II | Unknown | Unknown | SD |
| NBL1 | SNV | Missense_Mutation | novel | c.484N>T | p.Pro162Ser | p.P162S | P41271 | protein_coding | tolerated(0.48) | benign(0.042) | TCGA-DF-A2KU-01 | Endometrium | uterine corpus endometrioid carcinoma | Female | Unknown | I/II | Unknown | Unknown | SD |


