
|
|||||
|
 | |
| |
| |
| |
| |
| |
|
Gene: NAP1L1 |
Gene summary for NAP1L1 |
| Gene information | Species | Human | Gene symbol | NAP1L1 | Gene ID | 4673 |
| Gene name | nucleosome assembly protein 1 like 1 | |
| Gene Alias | NAP1 | |
| Cytomap | 12q21.2 | |
| Gene Type | protein-coding | GO ID | GO:0006260 | UniProtAcc | B7Z2V4 |
Top |
Malignant transformation analysis |
| Identification of the aberrant gene expression in precancerous and cancerous lesions by comparing the gene expression of stem-like cells in diseased tissues with normal stem cells |
| Entrez ID | Symbol | Replicates | Species | Organ | Tissue | Adj P-value | Log2FC | Malignancy |
| 4673 | NAP1L1 | GSM4909285 | Human | Breast | IDC | 5.35e-04 | 3.32e-01 | 0.21 |
| 4673 | NAP1L1 | GSM4909286 | Human | Breast | IDC | 1.54e-06 | 3.70e-01 | 0.1081 |
| 4673 | NAP1L1 | GSM4909287 | Human | Breast | IDC | 1.75e-02 | -2.54e-01 | 0.2057 |
| 4673 | NAP1L1 | GSM4909294 | Human | Breast | IDC | 6.66e-07 | -1.18e-01 | 0.2022 |
| 4673 | NAP1L1 | GSM4909296 | Human | Breast | IDC | 2.49e-16 | -3.69e-01 | 0.1524 |
| 4673 | NAP1L1 | GSM4909297 | Human | Breast | IDC | 1.55e-30 | -1.74e-01 | 0.1517 |
| 4673 | NAP1L1 | GSM4909302 | Human | Breast | IDC | 4.84e-03 | -9.75e-02 | 0.1545 |
| 4673 | NAP1L1 | GSM4909304 | Human | Breast | IDC | 2.07e-05 | -1.88e-01 | 0.1636 |
| 4673 | NAP1L1 | GSM4909309 | Human | Breast | IDC | 8.34e-05 | -2.27e-01 | 0.0483 |
| 4673 | NAP1L1 | GSM4909311 | Human | Breast | IDC | 3.33e-61 | -6.52e-01 | 0.1534 |
| 4673 | NAP1L1 | GSM4909312 | Human | Breast | IDC | 5.53e-30 | -5.92e-01 | 0.1552 |
| 4673 | NAP1L1 | GSM4909313 | Human | Breast | IDC | 4.72e-05 | -2.40e-01 | 0.0391 |
| 4673 | NAP1L1 | GSM4909316 | Human | Breast | IDC | 1.58e-04 | -2.99e-01 | 0.21 |
| 4673 | NAP1L1 | GSM4909319 | Human | Breast | IDC | 2.14e-71 | -6.40e-01 | 0.1563 |
| 4673 | NAP1L1 | GSM4909320 | Human | Breast | IDC | 2.44e-20 | -7.23e-01 | 0.1575 |
| 4673 | NAP1L1 | GSM4909321 | Human | Breast | IDC | 3.60e-21 | -4.28e-01 | 0.1559 |
| 4673 | NAP1L1 | brca1 | Human | Breast | Precancer | 2.68e-07 | -2.40e-01 | -0.0338 |
| 4673 | NAP1L1 | brca2 | Human | Breast | Precancer | 6.98e-11 | -2.12e-01 | -0.024 |
| 4673 | NAP1L1 | brca3 | Human | Breast | Precancer | 7.87e-04 | -3.76e-02 | -0.0263 |
| 4673 | NAP1L1 | M2 | Human | Breast | IDC | 1.55e-06 | 1.41e-01 | 0.21 |
| Page: 1 2 3 4 5 6 7 8 9 10 11 12 |
| Tissue | Expression Dynamics | Abbreviation |
| Breast |  | IDC: Invasive ductal carcinoma |
| DCIS: Ductal carcinoma in situ | ||
| Precancer(BRCA1-mut): Precancerous lesion from BRCA1 mutation carriers | ||
| Cervix | 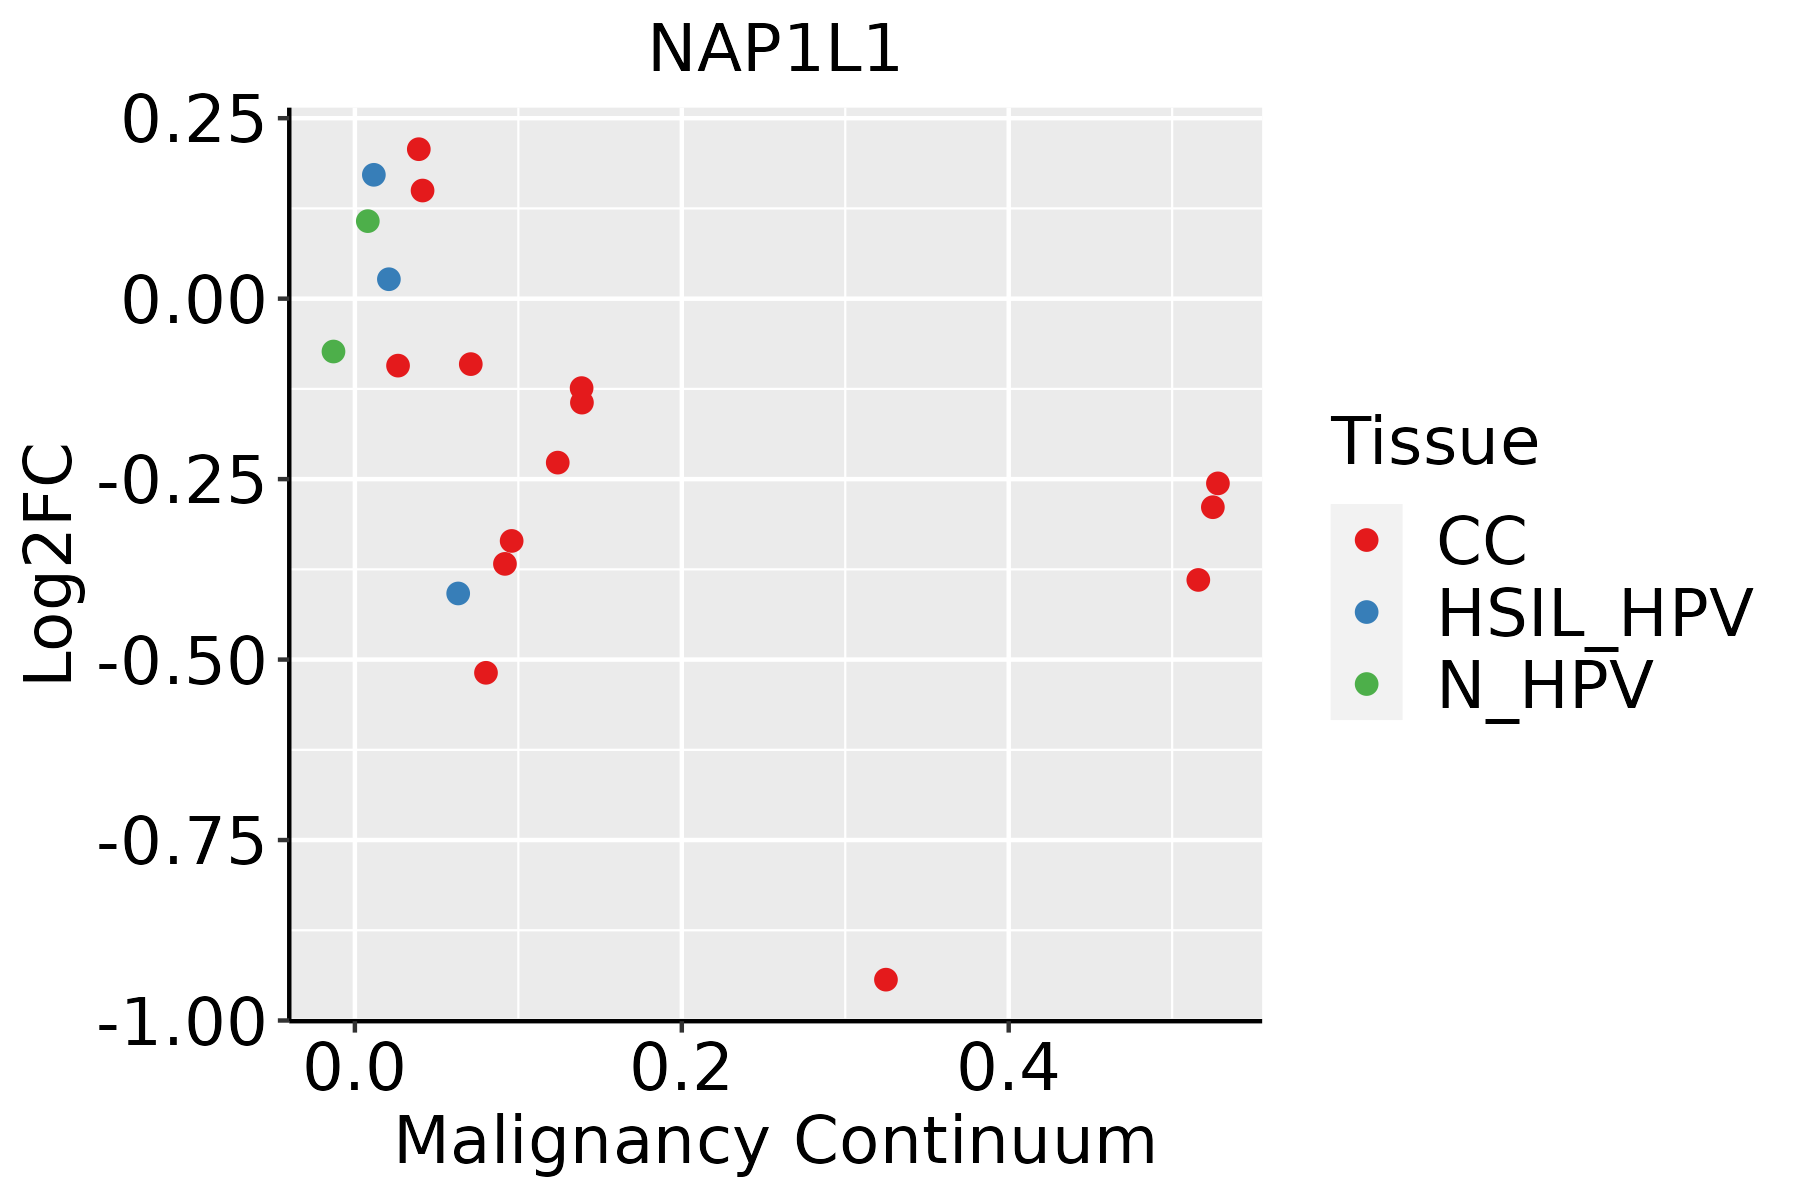 | CC: Cervix cancer |
| HSIL_HPV: HPV-infected high-grade squamous intraepithelial lesions | ||
| N_HPV: HPV-infected normal cervix | ||
| Colorectum (GSE201348) |  | FAP: Familial adenomatous polyposis |
| CRC: Colorectal cancer | ||
| Colorectum (HTA11) |  | AD: Adenomas |
| SER: Sessile serrated lesions | ||
| MSI-H: Microsatellite-high colorectal cancer | ||
| MSS: Microsatellite stable colorectal cancer | ||
| Endometrium | 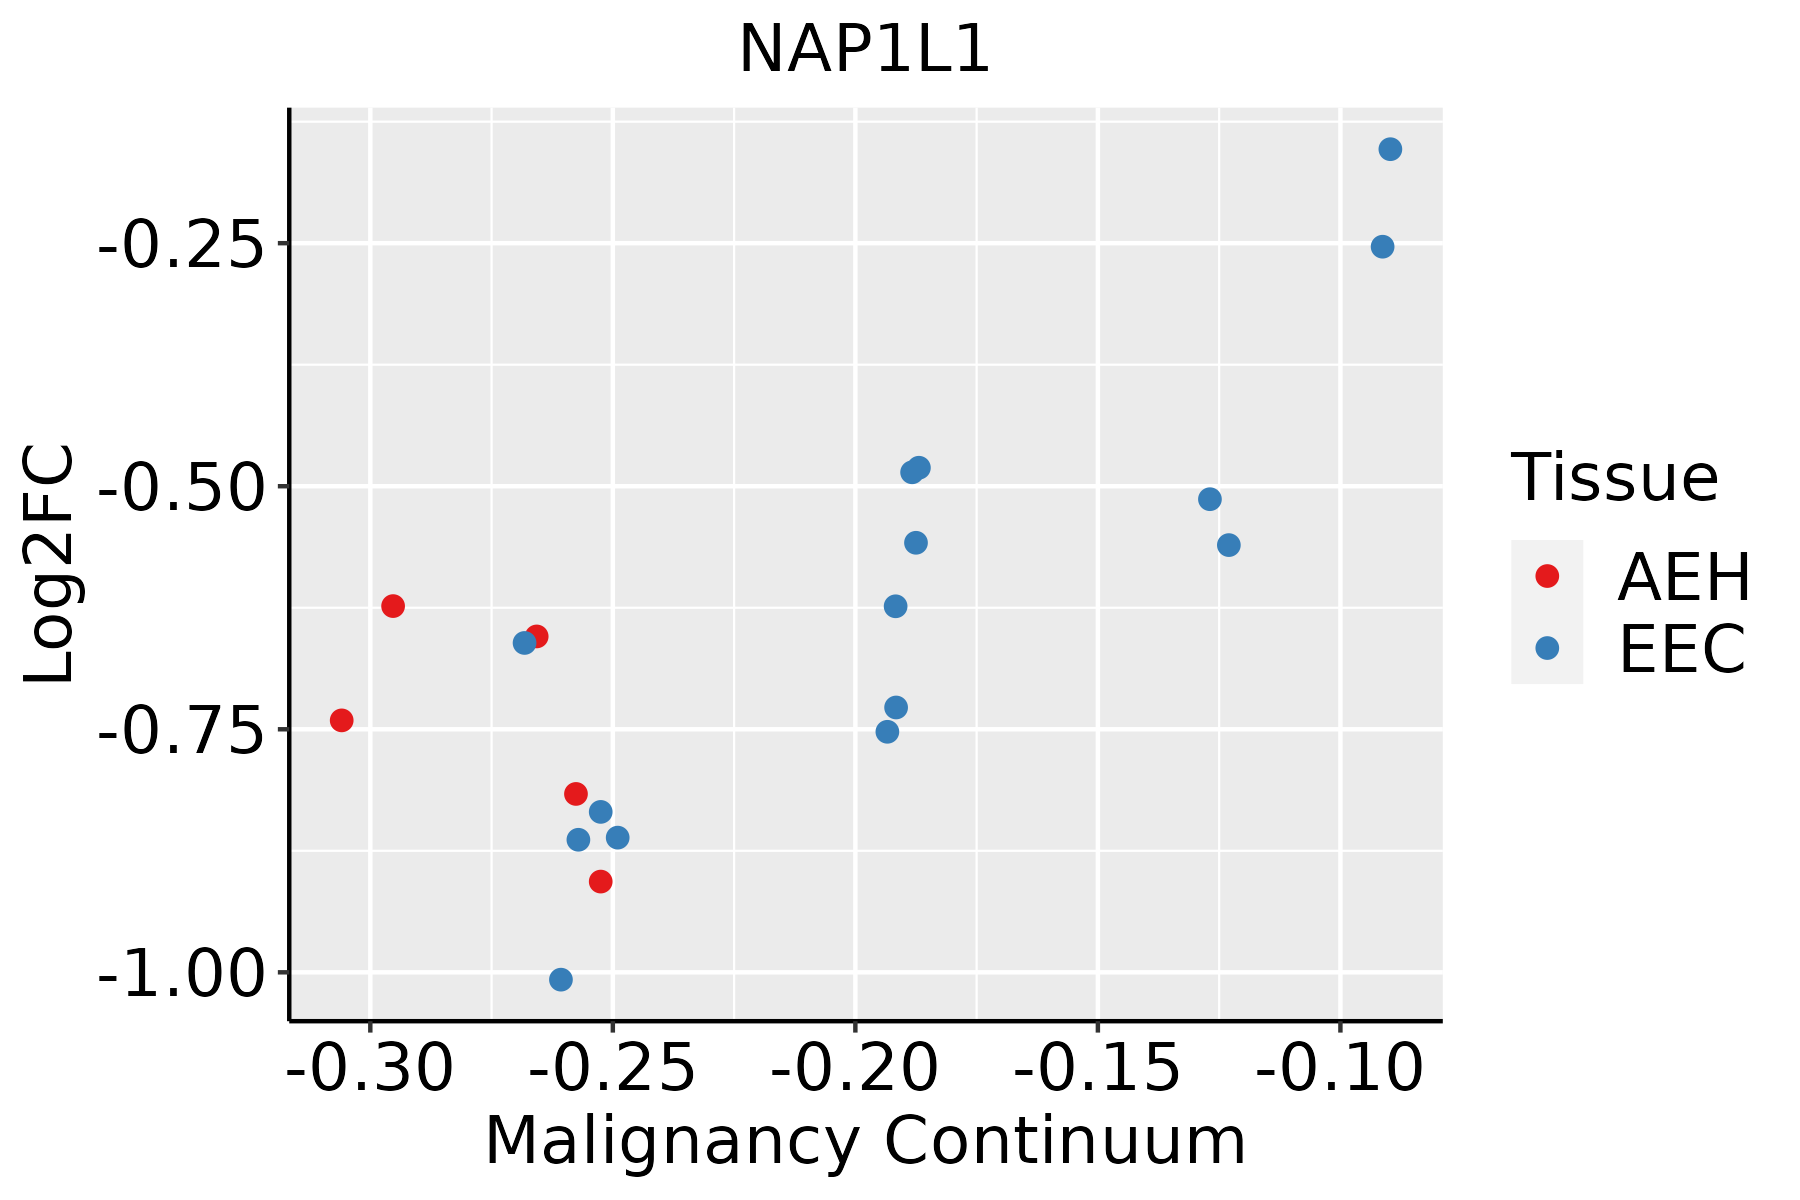 | AEH: Atypical endometrial hyperplasia |
| EEC: Endometrioid Cancer | ||
| Esophagus |  | ESCC: Esophageal squamous cell carcinoma |
| HGIN: High-grade intraepithelial neoplasias | ||
| LGIN: Low-grade intraepithelial neoplasias | ||
| Liver | 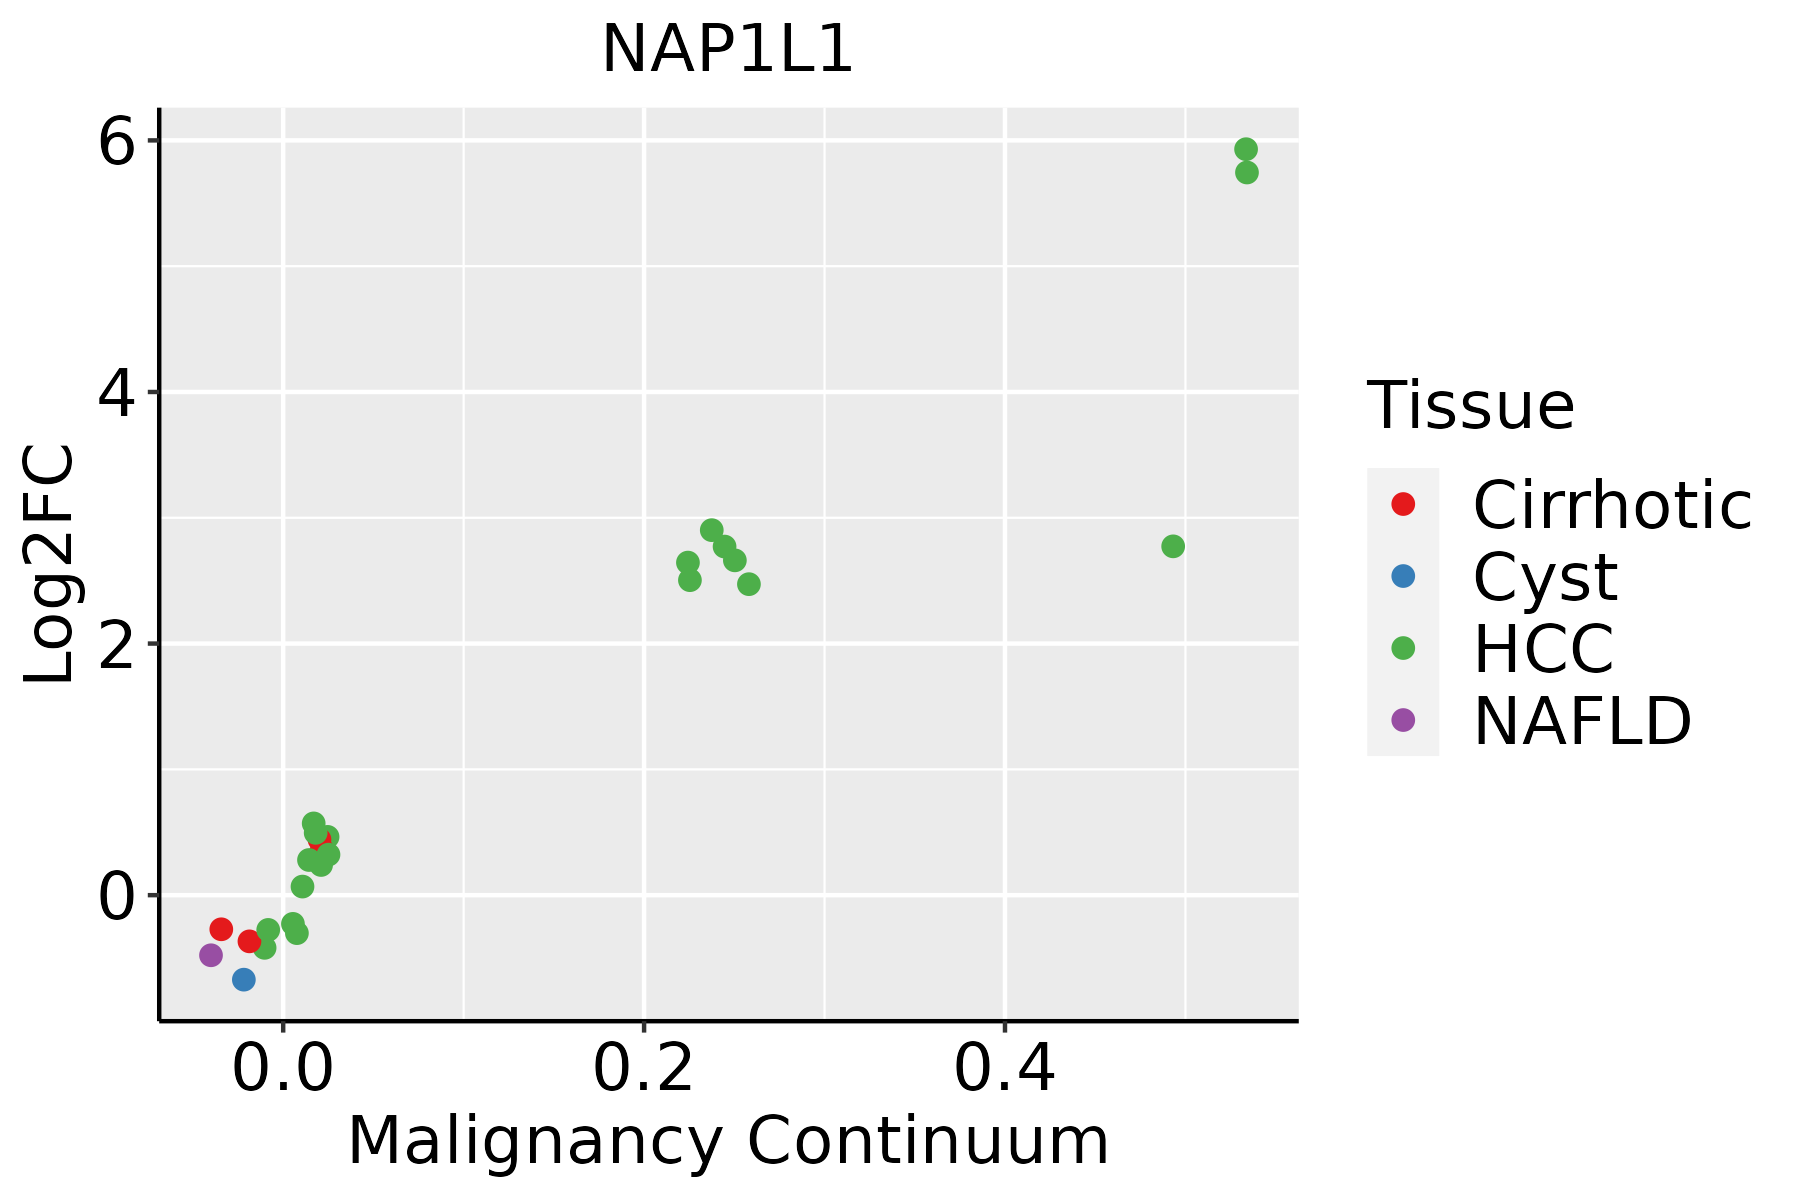 | HCC: Hepatocellular carcinoma |
| NAFLD: Non-alcoholic fatty liver disease | ||
| Oral Cavity | 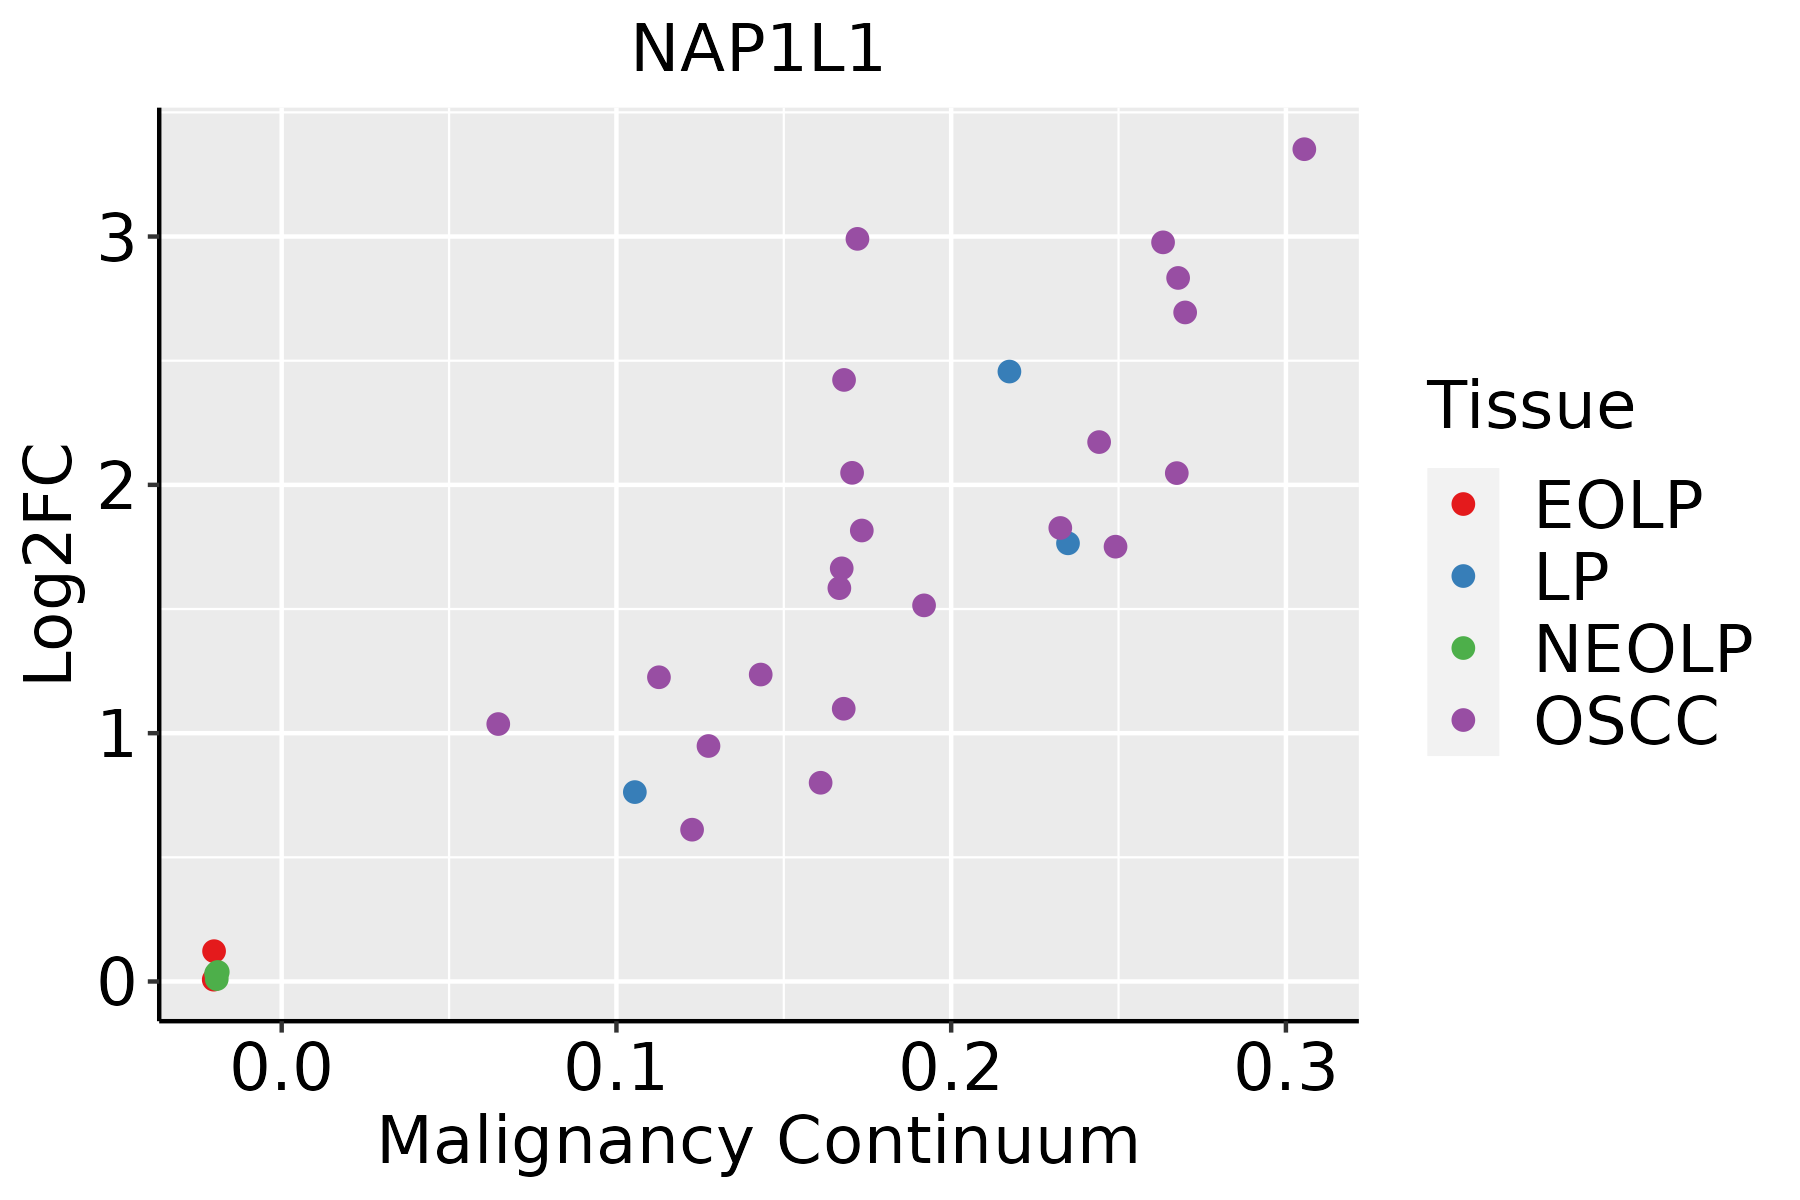 | EOLP: Erosive Oral lichen planus |
| LP: leukoplakia | ||
| NEOLP: Non-erosive oral lichen planus | ||
| OSCC: Oral squamous cell carcinoma | ||
| Prostate | 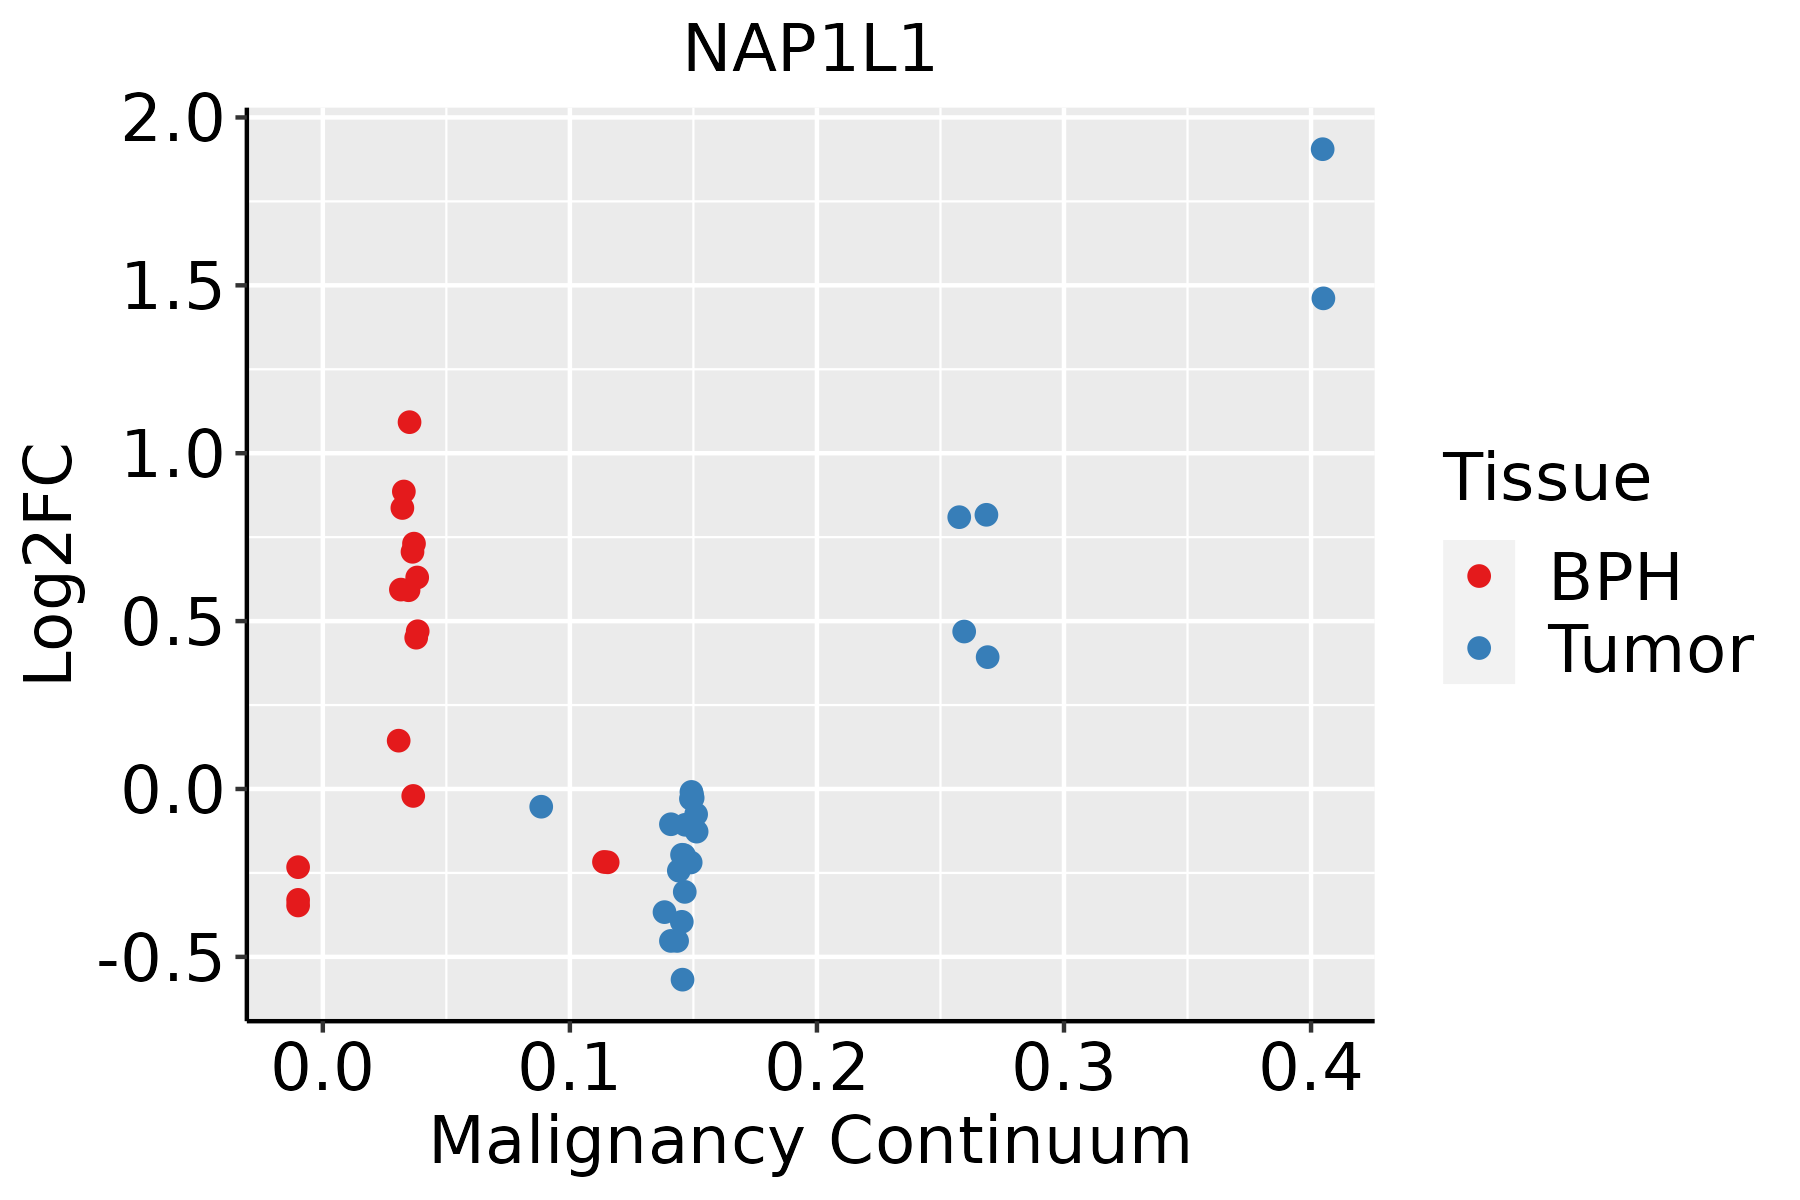 | BPH: Benign Prostatic Hyperplasia |
| Skin | 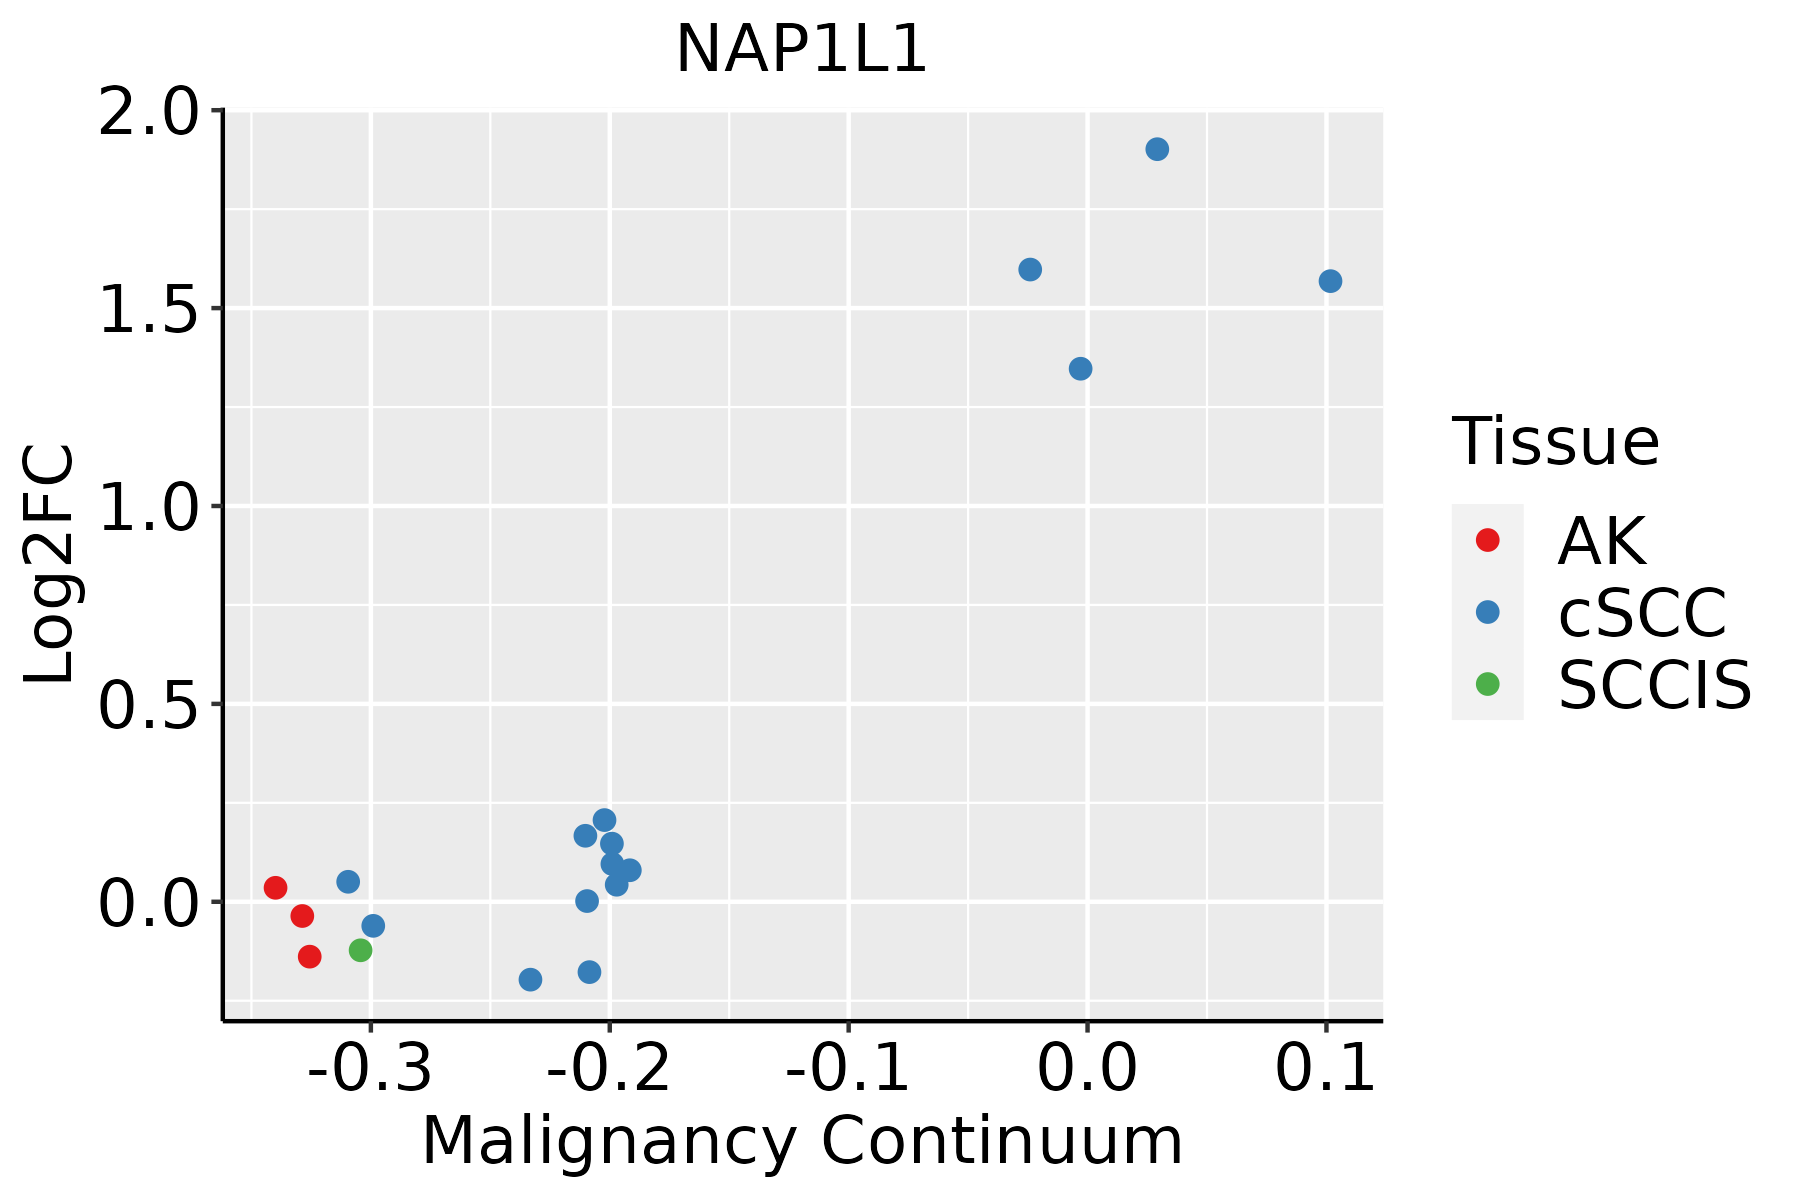 | AK: Actinic keratosis |
| cSCC: Cutaneous squamous cell carcinoma | ||
| SCCIS:squamous cell carcinoma in situ | ||
| Thyroid |  | ATC: Anaplastic thyroid cancer |
| HT: Hashimoto's thyroiditis | ||
| PTC: Papillary thyroid cancer |
| ∗log2FC in expression of this searched gene in stem-like cells from each diseased tissue sample relative to stem-like cells in normal samples in each tissue plotted against the malignancy continuum. Samples are colored based on if they are from different disease stage. |
Top |
Malignant transformation related pathway analysis |
| Find out the enriched GO biological processes and KEGG pathways involved in transition from healthy to precancer to cancer |
| Tissue | Disease Stage | Enriched GO biological Processes |
| Colorectum | AD |  |
| Colorectum | SER |  |
| Colorectum | MSS |  |
| Colorectum | MSI-H |  |
| Colorectum | FAP |  |
| ∗Top 15 enriched GO BP terms are showed in the bar plot of each disease state in each tissue. Each row represents a significant GO biological process which is colored according to the -log10(p.adjust). |
| Page: 1 2 3 4 5 6 7 8 9 |
| GO ID | Tissue | Disease Stage | Description | Gene Ratio | Bg Ratio | pvalue | p.adjust | Count |
| GO:0006260 | Colorectum | MSI-H | DNA replication | 31/1319 | 260/18723 | 2.83e-03 | 3.63e-02 | 31 |
| GO:00107203 | Colorectum | FAP | positive regulation of cell development | 72/2622 | 298/18723 | 1.67e-06 | 6.99e-05 | 72 |
| GO:00507672 | Colorectum | FAP | regulation of neurogenesis | 82/2622 | 364/18723 | 6.28e-06 | 1.96e-04 | 82 |
| GO:00507691 | Colorectum | FAP | positive regulation of neurogenesis | 53/2622 | 225/18723 | 7.65e-05 | 1.37e-03 | 53 |
| GO:00063253 | Colorectum | FAP | chromatin organization | 84/2622 | 409/18723 | 1.62e-04 | 2.47e-03 | 84 |
| GO:00519601 | Colorectum | FAP | regulation of nervous system development | 89/2622 | 443/18723 | 2.32e-04 | 3.25e-03 | 89 |
| GO:0051962 | Colorectum | FAP | positive regulation of nervous system development | 56/2622 | 272/18723 | 1.74e-03 | 1.52e-02 | 56 |
| GO:00107204 | Colorectum | CRC | positive regulation of cell development | 60/2078 | 298/18723 | 3.27e-06 | 1.47e-04 | 60 |
| GO:00507673 | Colorectum | CRC | regulation of neurogenesis | 68/2078 | 364/18723 | 1.11e-05 | 3.62e-04 | 68 |
| GO:00063254 | Colorectum | CRC | chromatin organization | 74/2078 | 409/18723 | 1.48e-05 | 4.61e-04 | 74 |
| GO:00507692 | Colorectum | CRC | positive regulation of neurogenesis | 43/2078 | 225/18723 | 2.58e-04 | 4.19e-03 | 43 |
| GO:00519602 | Colorectum | CRC | regulation of nervous system development | 71/2078 | 443/18723 | 9.28e-04 | 1.14e-02 | 71 |
| GO:00519621 | Colorectum | CRC | positive regulation of nervous system development | 44/2078 | 272/18723 | 6.71e-03 | 4.77e-02 | 44 |
| GO:00107207 | Endometrium | AEH | positive regulation of cell development | 57/2100 | 298/18723 | 3.72e-05 | 6.49e-04 | 57 |
| GO:00063258 | Endometrium | AEH | chromatin organization | 64/2100 | 409/18723 | 3.69e-03 | 2.52e-02 | 64 |
| GO:00507677 | Endometrium | AEH | regulation of neurogenesis | 56/2100 | 364/18723 | 8.87e-03 | 4.82e-02 | 56 |
| GO:001072012 | Endometrium | EEC | positive regulation of cell development | 56/2168 | 298/18723 | 1.68e-04 | 2.10e-03 | 56 |
| GO:00613511 | Endometrium | EEC | neural precursor cell proliferation | 29/2168 | 145/18723 | 2.24e-03 | 1.67e-02 | 29 |
| GO:000632513 | Endometrium | EEC | chromatin organization | 65/2168 | 409/18723 | 4.98e-03 | 3.14e-02 | 65 |
| GO:000632516 | Esophagus | HGIN | chromatin organization | 92/2587 | 409/18723 | 1.05e-06 | 4.16e-05 | 92 |
| Page: 1 2 3 4 5 6 |
| Pathway ID | Tissue | Disease Stage | Description | Gene Ratio | Bg Ratio | pvalue | p.adjust | qvalue | Count |
| Page: 1 |
Top |
Cell-cell communication analysis |
| Identification of potential cell-cell interactions between two cell types and their ligand-receptor pairs for different disease states |
| Ligand | Receptor | LRpair | Pathway | Tissue | Disease Stage |
| Page: 1 |
Top |
Single-cell gene regulatory network inference analysis |
| Find out the significant the regulons (TFs) and the target genes of each regulon across cell types for different disease states |
| TF | Cell Type | Tissue | Disease Stage | Target Gene | RSS | Regulon Activity |
| ∗The dot plots of a searched regulon are shown for all cell subpopulations in each disease state of each tissue based on the regulon specific score inferred using pySCENIC and by calculating the average expression. |
| Page: 1 |
Top |
Somatic mutation of malignant transformation related genes |
| Annotation of somatic variants for genes involved in malignant transformation |
| Hugo Symbol | Variant Class | Variant Classification | dbSNP RS | HGVSc | HGVSp | HGVSp Short | SWISSPROT | BIOTYPE | SIFT | PolyPhen | Tumor Sample Barcode | Tissue | Histology | Sex | Age | Stage | Therapy Types | Drugs | Outcome |
| NAP1L1 | SNV | Missense_Mutation | c.374N>T | p.Tyr125Phe | p.Y125F | P55209 | protein_coding | tolerated(0.09) | possibly_damaging(0.666) | TCGA-AO-A0J6-01 | Breast | breast invasive carcinoma | Female | <65 | I/II | Chemotherapy | doxorubicin | SD | |
| NAP1L1 | SNV | Missense_Mutation | novel | c.85G>A | p.Glu29Lys | p.E29K | P55209 | protein_coding | tolerated(0.26) | possibly_damaging(0.899) | TCGA-AR-A2LN-01 | Breast | breast invasive carcinoma | Female | >=65 | I/II | Hormone Therapy | letrozole | SD |
| NAP1L1 | SNV | Missense_Mutation | c.37N>C | p.Asp13His | p.D13H | P55209 | protein_coding | deleterious(0.01) | probably_damaging(0.99) | TCGA-Q1-A73O-01 | Cervix | cervical & endocervical cancer | Female | <65 | I/II | Chemotherapy | cisplatin | CR | |
| NAP1L1 | SNV | Missense_Mutation | c.428N>T | p.Ser143Leu | p.S143L | P55209 | protein_coding | tolerated(0.15) | benign(0.009) | TCGA-AA-3977-01 | Colorectum | colon adenocarcinoma | Male | >=65 | I/II | Unknown | Unknown | SD | |
| NAP1L1 | SNV | Missense_Mutation | c.898N>G | p.Phe300Val | p.F300V | P55209 | protein_coding | deleterious(0.01) | probably_damaging(0.967) | TCGA-AZ-4315-01 | Colorectum | colon adenocarcinoma | Male | <65 | I/II | Unknown | Unknown | SD | |
| NAP1L1 | SNV | Missense_Mutation | novel | c.755N>G | p.Ile252Ser | p.I252S | P55209 | protein_coding | deleterious(0.03) | probably_damaging(0.992) | TCGA-CA-6717-01 | Colorectum | colon adenocarcinoma | Male | <65 | I/II | Chemotherapy | oxaliplatin | CR |
| NAP1L1 | SNV | Missense_Mutation | novel | c.286N>G | p.Tyr96Asp | p.Y96D | P55209 | protein_coding | deleterious(0) | benign(0.053) | TCGA-CA-6717-01 | Colorectum | colon adenocarcinoma | Male | <65 | I/II | Chemotherapy | oxaliplatin | CR |
| NAP1L1 | SNV | Missense_Mutation | c.952N>T | p.Ala318Ser | p.A318S | P55209 | protein_coding | tolerated(0.47) | benign(0.026) | TCGA-DM-A1HB-01 | Colorectum | colon adenocarcinoma | Male | >=65 | III/IV | Unknown | Unknown | SD | |
| NAP1L1 | SNV | Missense_Mutation | c.1097N>G | p.Glu366Gly | p.E366G | P55209 | protein_coding | tolerated(0.14) | probably_damaging(0.954) | TCGA-WS-AB45-01 | Colorectum | colon adenocarcinoma | Female | <65 | I/II | Unknown | Unknown | SD | |
| NAP1L1 | SNV | Missense_Mutation | novel | c.835N>T | p.His279Tyr | p.H279Y | P55209 | protein_coding | deleterious(0) | probably_damaging(0.979) | TCGA-AG-3892-01 | Colorectum | rectum adenocarcinoma | Female | <65 | I/II | Unknown | Unknown | SD |
| Page: 1 2 3 4 5 |
Top |
Related drugs of malignant transformation related genes |
| Identification of chemicals and drugs interact with genes involved in malignant transfromation |
| (DGIdb 4.0) |
| Entrez ID | Symbol | Category | Interaction Types | Drug Claim Name | Drug Name | PMIDs |
| Page: 1 |

Copyright 2023-Present -The University of Texas Health Science Center at Houston |