
|
|||||
|
 | |
| |
| |
| |
| |
| |
|
Gene: MUS81 |
Gene summary for MUS81 |
| Gene information | Species | Human | Gene symbol | MUS81 | Gene ID | 80198 |
| Gene name | MUS81 structure-specific endonuclease subunit | |
| Gene Alias | SLX3 | |
| Cytomap | 11q13.1 | |
| Gene Type | protein-coding | GO ID | GO:0000003 | UniProtAcc | Q53ES5 |
Top |
Malignant transformation analysis |
| Identification of the aberrant gene expression in precancerous and cancerous lesions by comparing the gene expression of stem-like cells in diseased tissues with normal stem cells |
| Entrez ID | Symbol | Replicates | Species | Organ | Tissue | Adj P-value | Log2FC | Malignancy |
| 80198 | MUS81 | LZE20T | Human | Esophagus | ESCC | 3.82e-06 | 2.38e-01 | 0.0662 |
| 80198 | MUS81 | LZE24T | Human | Esophagus | ESCC | 1.86e-14 | 4.59e-01 | 0.0596 |
| 80198 | MUS81 | P1T-E | Human | Esophagus | ESCC | 2.49e-05 | 3.61e-01 | 0.0875 |
| 80198 | MUS81 | P2T-E | Human | Esophagus | ESCC | 1.42e-17 | 3.20e-01 | 0.1177 |
| 80198 | MUS81 | P4T-E | Human | Esophagus | ESCC | 6.85e-21 | 5.31e-01 | 0.1323 |
| 80198 | MUS81 | P5T-E | Human | Esophagus | ESCC | 3.47e-13 | 3.66e-01 | 0.1327 |
| 80198 | MUS81 | P8T-E | Human | Esophagus | ESCC | 3.96e-15 | 2.61e-01 | 0.0889 |
| 80198 | MUS81 | P9T-E | Human | Esophagus | ESCC | 2.53e-06 | 1.61e-01 | 0.1131 |
| 80198 | MUS81 | P10T-E | Human | Esophagus | ESCC | 4.37e-13 | 2.08e-01 | 0.116 |
| 80198 | MUS81 | P11T-E | Human | Esophagus | ESCC | 2.09e-07 | 4.85e-01 | 0.1426 |
| 80198 | MUS81 | P12T-E | Human | Esophagus | ESCC | 1.03e-11 | 3.43e-01 | 0.1122 |
| 80198 | MUS81 | P15T-E | Human | Esophagus | ESCC | 1.11e-14 | 3.85e-01 | 0.1149 |
| 80198 | MUS81 | P16T-E | Human | Esophagus | ESCC | 6.23e-18 | 4.36e-01 | 0.1153 |
| 80198 | MUS81 | P17T-E | Human | Esophagus | ESCC | 3.06e-05 | 3.33e-01 | 0.1278 |
| 80198 | MUS81 | P20T-E | Human | Esophagus | ESCC | 3.86e-09 | 2.26e-01 | 0.1124 |
| 80198 | MUS81 | P21T-E | Human | Esophagus | ESCC | 8.66e-18 | 2.32e-01 | 0.1617 |
| 80198 | MUS81 | P22T-E | Human | Esophagus | ESCC | 2.79e-12 | 1.44e-01 | 0.1236 |
| 80198 | MUS81 | P23T-E | Human | Esophagus | ESCC | 1.92e-20 | 5.17e-01 | 0.108 |
| 80198 | MUS81 | P24T-E | Human | Esophagus | ESCC | 8.59e-11 | 2.58e-01 | 0.1287 |
| 80198 | MUS81 | P26T-E | Human | Esophagus | ESCC | 4.14e-11 | 2.04e-01 | 0.1276 |
| Page: 1 2 3 4 5 |
| Tissue | Expression Dynamics | Abbreviation |
| Esophagus | 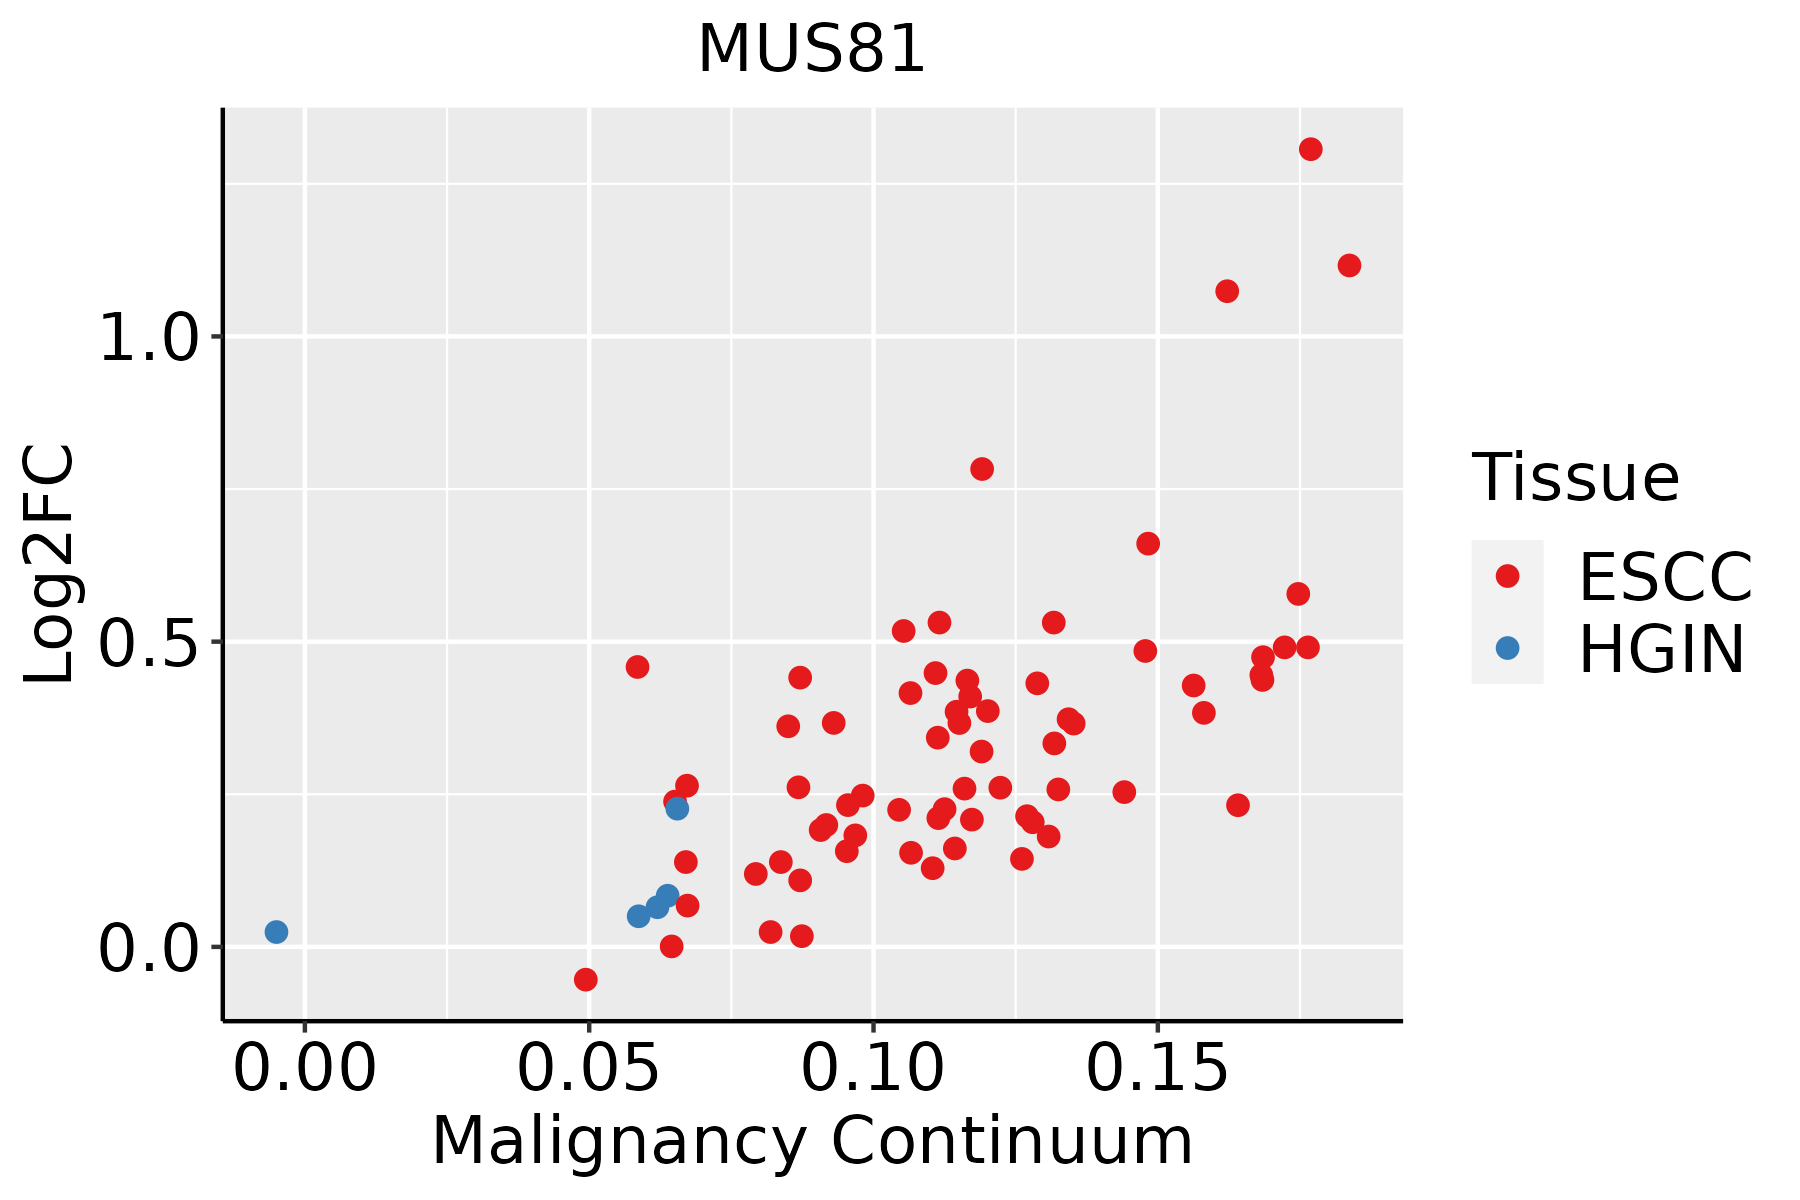 | ESCC: Esophageal squamous cell carcinoma |
| HGIN: High-grade intraepithelial neoplasias | ||
| LGIN: Low-grade intraepithelial neoplasias | ||
| Liver | 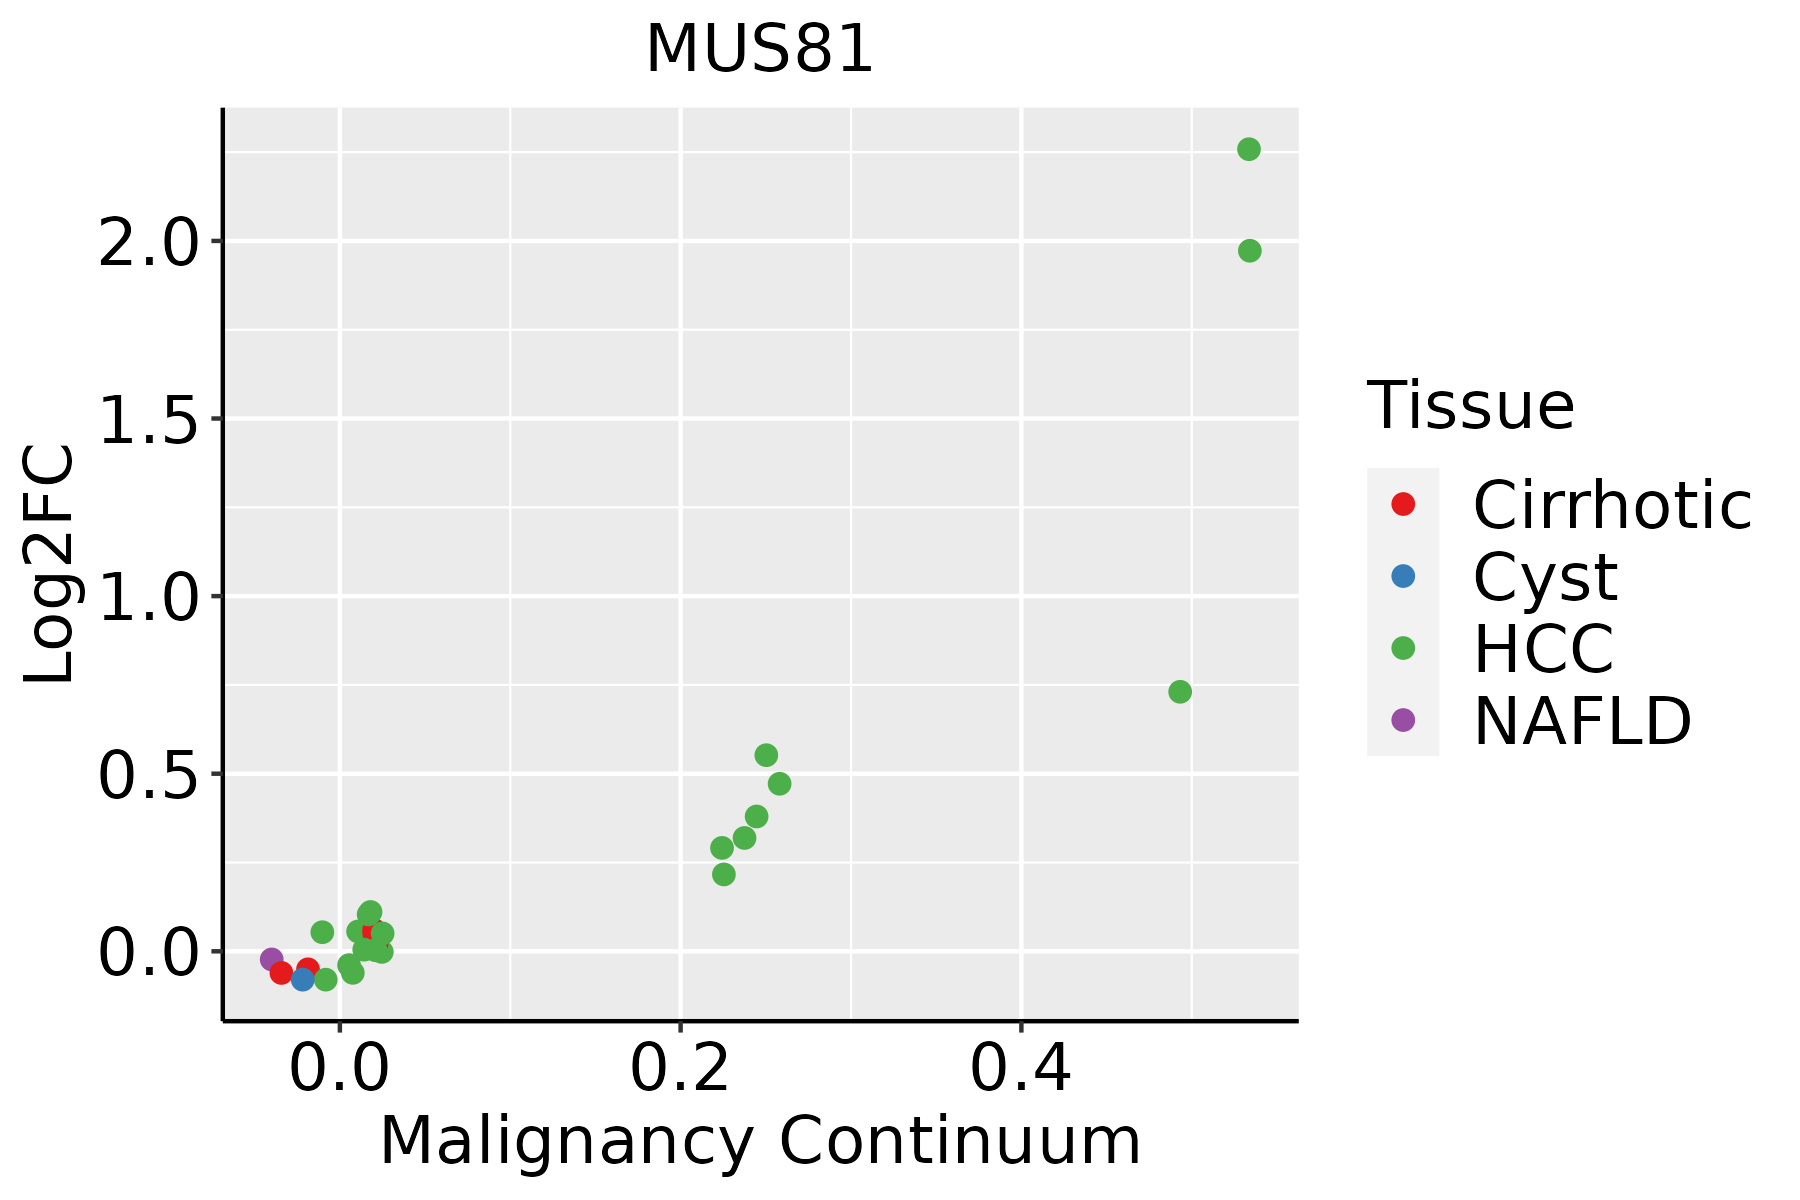 | HCC: Hepatocellular carcinoma |
| NAFLD: Non-alcoholic fatty liver disease | ||
| Oral Cavity | 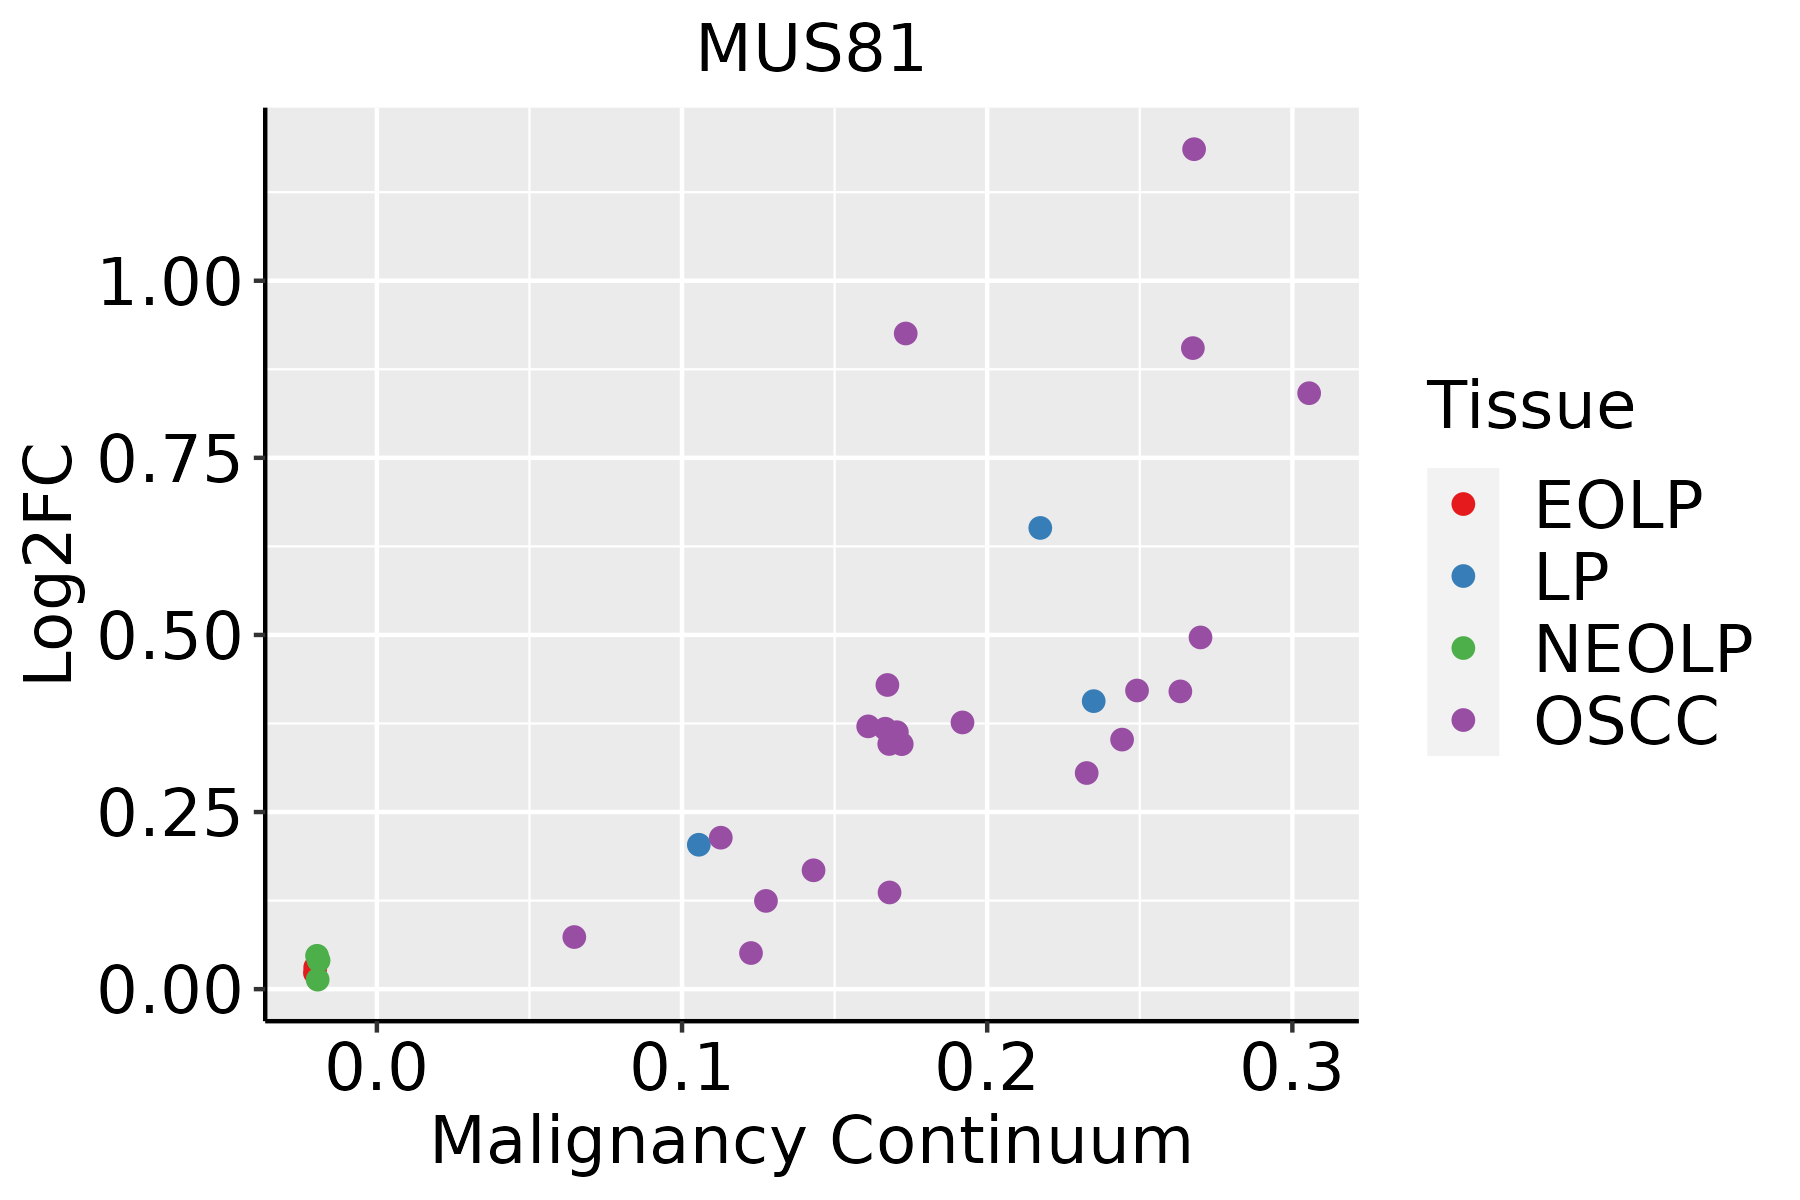 | EOLP: Erosive Oral lichen planus |
| LP: leukoplakia | ||
| NEOLP: Non-erosive oral lichen planus | ||
| OSCC: Oral squamous cell carcinoma |
| ∗log2FC in expression of this searched gene in stem-like cells from each diseased tissue sample relative to stem-like cells in normal samples in each tissue plotted against the malignancy continuum. Samples are colored based on if they are from different disease stage. |
Top |
Malignant transformation related pathway analysis |
| Find out the enriched GO biological processes and KEGG pathways involved in transition from healthy to precancer to cancer |
| Tissue | Disease Stage | Enriched GO biological Processes |
| Colorectum | AD |  |
| Colorectum | SER |  |
| Colorectum | MSS |  |
| Colorectum | MSI-H |  |
| Colorectum | FAP |  |
| ∗Top 15 enriched GO BP terms are showed in the bar plot of each disease state in each tissue. Each row represents a significant GO biological process which is colored according to the -log10(p.adjust). |
| Page: 1 2 3 4 5 6 7 8 9 |
| GO ID | Tissue | Disease Stage | Description | Gene Ratio | Bg Ratio | pvalue | p.adjust | Count |
| GO:00063024 | Esophagus | ESCC | double-strand break repair | 152/8552 | 251/18723 | 1.33e-06 | 1.62e-05 | 152 |
| GO:004593013 | Esophagus | ESCC | negative regulation of mitotic cell cycle | 143/8552 | 235/18723 | 1.84e-06 | 2.15e-05 | 143 |
| GO:00513042 | Esophagus | ESCC | chromosome separation | 64/8552 | 96/18723 | 2.61e-05 | 2.20e-04 | 64 |
| GO:004477312 | Esophagus | ESCC | mitotic DNA damage checkpoint | 54/8552 | 81/18723 | 1.09e-04 | 7.64e-04 | 54 |
| GO:00447745 | Esophagus | ESCC | mitotic DNA integrity checkpoint | 56/8552 | 85/18723 | 1.34e-04 | 9.09e-04 | 56 |
| GO:00063101 | Esophagus | ESCC | DNA recombination | 168/8552 | 305/18723 | 5.58e-04 | 3.05e-03 | 168 |
| GO:00007241 | Esophagus | ESCC | double-strand break repair via homologous recombination | 79/8552 | 138/18723 | 4.05e-03 | 1.62e-02 | 79 |
| GO:00007251 | Esophagus | ESCC | recombinational repair | 80/8552 | 140/18723 | 4.10e-03 | 1.63e-02 | 80 |
| GO:007121617 | Esophagus | ESCC | cellular response to biotic stimulus | 131/8552 | 246/18723 | 9.85e-03 | 3.39e-02 | 131 |
| GO:004427021 | Liver | HCC | cellular nitrogen compound catabolic process | 303/7958 | 451/18723 | 9.76e-27 | 3.64e-24 | 303 |
| GO:004670021 | Liver | HCC | heterocycle catabolic process | 299/7958 | 445/18723 | 2.07e-26 | 7.29e-24 | 299 |
| GO:190136121 | Liver | HCC | organic cyclic compound catabolic process | 325/7958 | 495/18723 | 6.52e-26 | 2.18e-23 | 325 |
| GO:001943921 | Liver | HCC | aromatic compound catabolic process | 309/7958 | 467/18723 | 1.56e-25 | 4.94e-23 | 309 |
| GO:003465521 | Liver | HCC | nucleobase-containing compound catabolic process | 273/7958 | 407/18723 | 4.84e-24 | 1.23e-21 | 273 |
| GO:000734611 | Liver | HCC | regulation of mitotic cell cycle | 255/7958 | 457/18723 | 4.96e-09 | 1.30e-07 | 255 |
| GO:0007059 | Liver | HCC | chromosome segregation | 197/7958 | 346/18723 | 3.57e-08 | 7.87e-07 | 197 |
| GO:0090305 | Liver | HCC | nucleic acid phosphodiester bond hydrolysis | 152/7958 | 261/18723 | 1.90e-07 | 3.46e-06 | 152 |
| GO:19019871 | Liver | HCC | regulation of cell cycle phase transition | 211/7958 | 390/18723 | 2.11e-06 | 2.89e-05 | 211 |
| GO:00427702 | Liver | HCC | signal transduction in response to DNA damage | 103/7958 | 172/18723 | 3.05e-06 | 4.04e-05 | 103 |
| GO:0098813 | Liver | HCC | nuclear chromosome segregation | 157/7958 | 281/18723 | 3.82e-06 | 4.95e-05 | 157 |
| Page: 1 2 3 4 5 6 |
| Pathway ID | Tissue | Disease Stage | Description | Gene Ratio | Bg Ratio | pvalue | p.adjust | qvalue | Count |
| Page: 1 |
Top |
Cell-cell communication analysis |
| Identification of potential cell-cell interactions between two cell types and their ligand-receptor pairs for different disease states |
| Ligand | Receptor | LRpair | Pathway | Tissue | Disease Stage |
| Page: 1 |
Top |
Single-cell gene regulatory network inference analysis |
| Find out the significant the regulons (TFs) and the target genes of each regulon across cell types for different disease states |
| TF | Cell Type | Tissue | Disease Stage | Target Gene | RSS | Regulon Activity |
| ∗The dot plots of a searched regulon are shown for all cell subpopulations in each disease state of each tissue based on the regulon specific score inferred using pySCENIC and by calculating the average expression. |
| Page: 1 |
Top |
Somatic mutation of malignant transformation related genes |
| Annotation of somatic variants for genes involved in malignant transformation |
| Hugo Symbol | Variant Class | Variant Classification | dbSNP RS | HGVSc | HGVSp | HGVSp Short | SWISSPROT | BIOTYPE | SIFT | PolyPhen | Tumor Sample Barcode | Tissue | Histology | Sex | Age | Stage | Therapy Types | Drugs | Outcome |
| MUS81 | SNV | Missense_Mutation | novel | c.1247C>T | p.Thr416Met | p.T416M | Q96NY9 | protein_coding | deleterious(0) | probably_damaging(0.999) | TCGA-AC-A2FO-01 | Breast | breast invasive carcinoma | Female | >=65 | I/II | Chemotherapy | chemo | CR |
| MUS81 | SNV | Missense_Mutation | rs753119410 | c.1348N>T | p.Leu450Phe | p.L450F | Q96NY9 | protein_coding | tolerated(0.18) | benign(0.05) | TCGA-AC-A2QI-01 | Breast | breast invasive carcinoma | Female | >=65 | III/IV | Chemotherapy | cytoxan | CR |
| MUS81 | SNV | Missense_Mutation | c.1187N>T | p.Gly396Val | p.G396V | Q96NY9 | protein_coding | deleterious(0) | probably_damaging(0.973) | TCGA-E2-A1BC-01 | Breast | breast invasive carcinoma | Female | <65 | I/II | Hormone Therapy | arimidex | SD | |
| MUS81 | SNV | Missense_Mutation | rs753119410 | c.1348C>T | p.Leu450Phe | p.L450F | Q96NY9 | protein_coding | tolerated(0.18) | benign(0.05) | TCGA-GM-A3NY-01 | Breast | breast invasive carcinoma | Female | >=65 | I/II | Hormone Therapy | arimidex | SD |
| MUS81 | SNV | Missense_Mutation | rs754849594 | c.1201N>T | p.Arg401Cys | p.R401C | Q96NY9 | protein_coding | deleterious(0.01) | possibly_damaging(0.891) | TCGA-2W-A8YY-01 | Cervix | cervical & endocervical cancer | Female | <65 | I/II | Chemotherapy | cisplatin | CR |
| MUS81 | SNV | Missense_Mutation | rs753816989 | c.463C>T | p.His155Tyr | p.H155Y | Q96NY9 | protein_coding | tolerated(1) | benign(0.055) | TCGA-JW-A5VI-01 | Cervix | cervical & endocervical cancer | Female | <65 | I/II | Chemotherapy | topotecan | PD |
| MUS81 | SNV | Missense_Mutation | c.1417N>A | p.Glu473Lys | p.E473K | Q96NY9 | protein_coding | deleterious(0) | benign(0.407) | TCGA-Q1-A73O-01 | Cervix | cervical & endocervical cancer | Female | <65 | I/II | Chemotherapy | cisplatin | CR | |
| MUS81 | SNV | Missense_Mutation | rs768086876 | c.1448N>A | p.Arg483His | p.R483H | Q96NY9 | protein_coding | tolerated(0.28) | benign(0) | TCGA-A6-5665-01 | Colorectum | colon adenocarcinoma | Female | >=65 | I/II | Unknown | Unknown | PD |
| MUS81 | SNV | Missense_Mutation | novel | c.1282N>A | p.Leu428Ile | p.L428I | Q96NY9 | protein_coding | deleterious(0.04) | possibly_damaging(0.712) | TCGA-AA-3877-01 | Colorectum | colon adenocarcinoma | Female | >=65 | I/II | Unknown | Unknown | SD |
| MUS81 | SNV | Missense_Mutation | rs768086876 | c.1448N>A | p.Arg483His | p.R483H | Q96NY9 | protein_coding | tolerated(0.28) | benign(0) | TCGA-AY-6197-01 | Colorectum | colon adenocarcinoma | Male | <65 | I/II | Unknown | Unknown | SD |
| Page: 1 2 3 4 5 |
Top |
Related drugs of malignant transformation related genes |
| Identification of chemicals and drugs interact with genes involved in malignant transfromation |
| (DGIdb 4.0) |
| Entrez ID | Symbol | Category | Interaction Types | Drug Claim Name | Drug Name | PMIDs |
| Page: 1 |

Copyright 2023-Present -The University of Texas Health Science Center at Houston |