
|
|||||
|
 | |
| |
| |
| |
| |
| |
|
Gene: MUL1 |
Gene summary for MUL1 |
| Gene information | Species | Human | Gene symbol | MUL1 | Gene ID | 79594 |
| Gene name | mitochondrial E3 ubiquitin protein ligase 1 | |
| Gene Alias | C1orf166 | |
| Cytomap | 1p36.12 | |
| Gene Type | protein-coding | GO ID | GO:0000209 | UniProtAcc | A0A024RAA0 |
Top |
Malignant transformation analysis |
| Identification of the aberrant gene expression in precancerous and cancerous lesions by comparing the gene expression of stem-like cells in diseased tissues with normal stem cells |
| Entrez ID | Symbol | Replicates | Species | Organ | Tissue | Adj P-value | Log2FC | Malignancy |
| 79594 | MUL1 | LZE4T | Human | Esophagus | ESCC | 2.04e-03 | 7.46e-02 | 0.0811 |
| 79594 | MUL1 | LZE8T | Human | Esophagus | ESCC | 2.95e-04 | 1.00e-01 | 0.067 |
| 79594 | MUL1 | LZE20T | Human | Esophagus | ESCC | 1.99e-03 | 1.08e-01 | 0.0662 |
| 79594 | MUL1 | LZE24T | Human | Esophagus | ESCC | 1.28e-02 | 1.65e-01 | 0.0596 |
| 79594 | MUL1 | LZE6T | Human | Esophagus | ESCC | 2.80e-03 | 2.44e-01 | 0.0845 |
| 79594 | MUL1 | P1T-E | Human | Esophagus | ESCC | 1.84e-02 | 1.17e-01 | 0.0875 |
| 79594 | MUL1 | P2T-E | Human | Esophagus | ESCC | 7.39e-28 | 3.33e-01 | 0.1177 |
| 79594 | MUL1 | P4T-E | Human | Esophagus | ESCC | 4.33e-10 | 1.29e-01 | 0.1323 |
| 79594 | MUL1 | P5T-E | Human | Esophagus | ESCC | 6.41e-09 | 7.27e-02 | 0.1327 |
| 79594 | MUL1 | P8T-E | Human | Esophagus | ESCC | 5.45e-12 | 1.38e-01 | 0.0889 |
| 79594 | MUL1 | P9T-E | Human | Esophagus | ESCC | 2.98e-05 | 9.54e-02 | 0.1131 |
| 79594 | MUL1 | P10T-E | Human | Esophagus | ESCC | 1.09e-16 | 2.28e-01 | 0.116 |
| 79594 | MUL1 | P11T-E | Human | Esophagus | ESCC | 7.86e-12 | 5.18e-01 | 0.1426 |
| 79594 | MUL1 | P12T-E | Human | Esophagus | ESCC | 1.54e-15 | 1.72e-01 | 0.1122 |
| 79594 | MUL1 | P15T-E | Human | Esophagus | ESCC | 2.95e-16 | 2.69e-01 | 0.1149 |
| 79594 | MUL1 | P16T-E | Human | Esophagus | ESCC | 9.89e-20 | 2.22e-01 | 0.1153 |
| 79594 | MUL1 | P17T-E | Human | Esophagus | ESCC | 7.43e-05 | 2.33e-01 | 0.1278 |
| 79594 | MUL1 | P19T-E | Human | Esophagus | ESCC | 2.91e-06 | 4.78e-01 | 0.1662 |
| 79594 | MUL1 | P20T-E | Human | Esophagus | ESCC | 6.23e-09 | 1.29e-01 | 0.1124 |
| 79594 | MUL1 | P21T-E | Human | Esophagus | ESCC | 7.12e-25 | 4.51e-01 | 0.1617 |
| Page: 1 2 3 4 5 |
| Tissue | Expression Dynamics | Abbreviation |
| Esophagus | 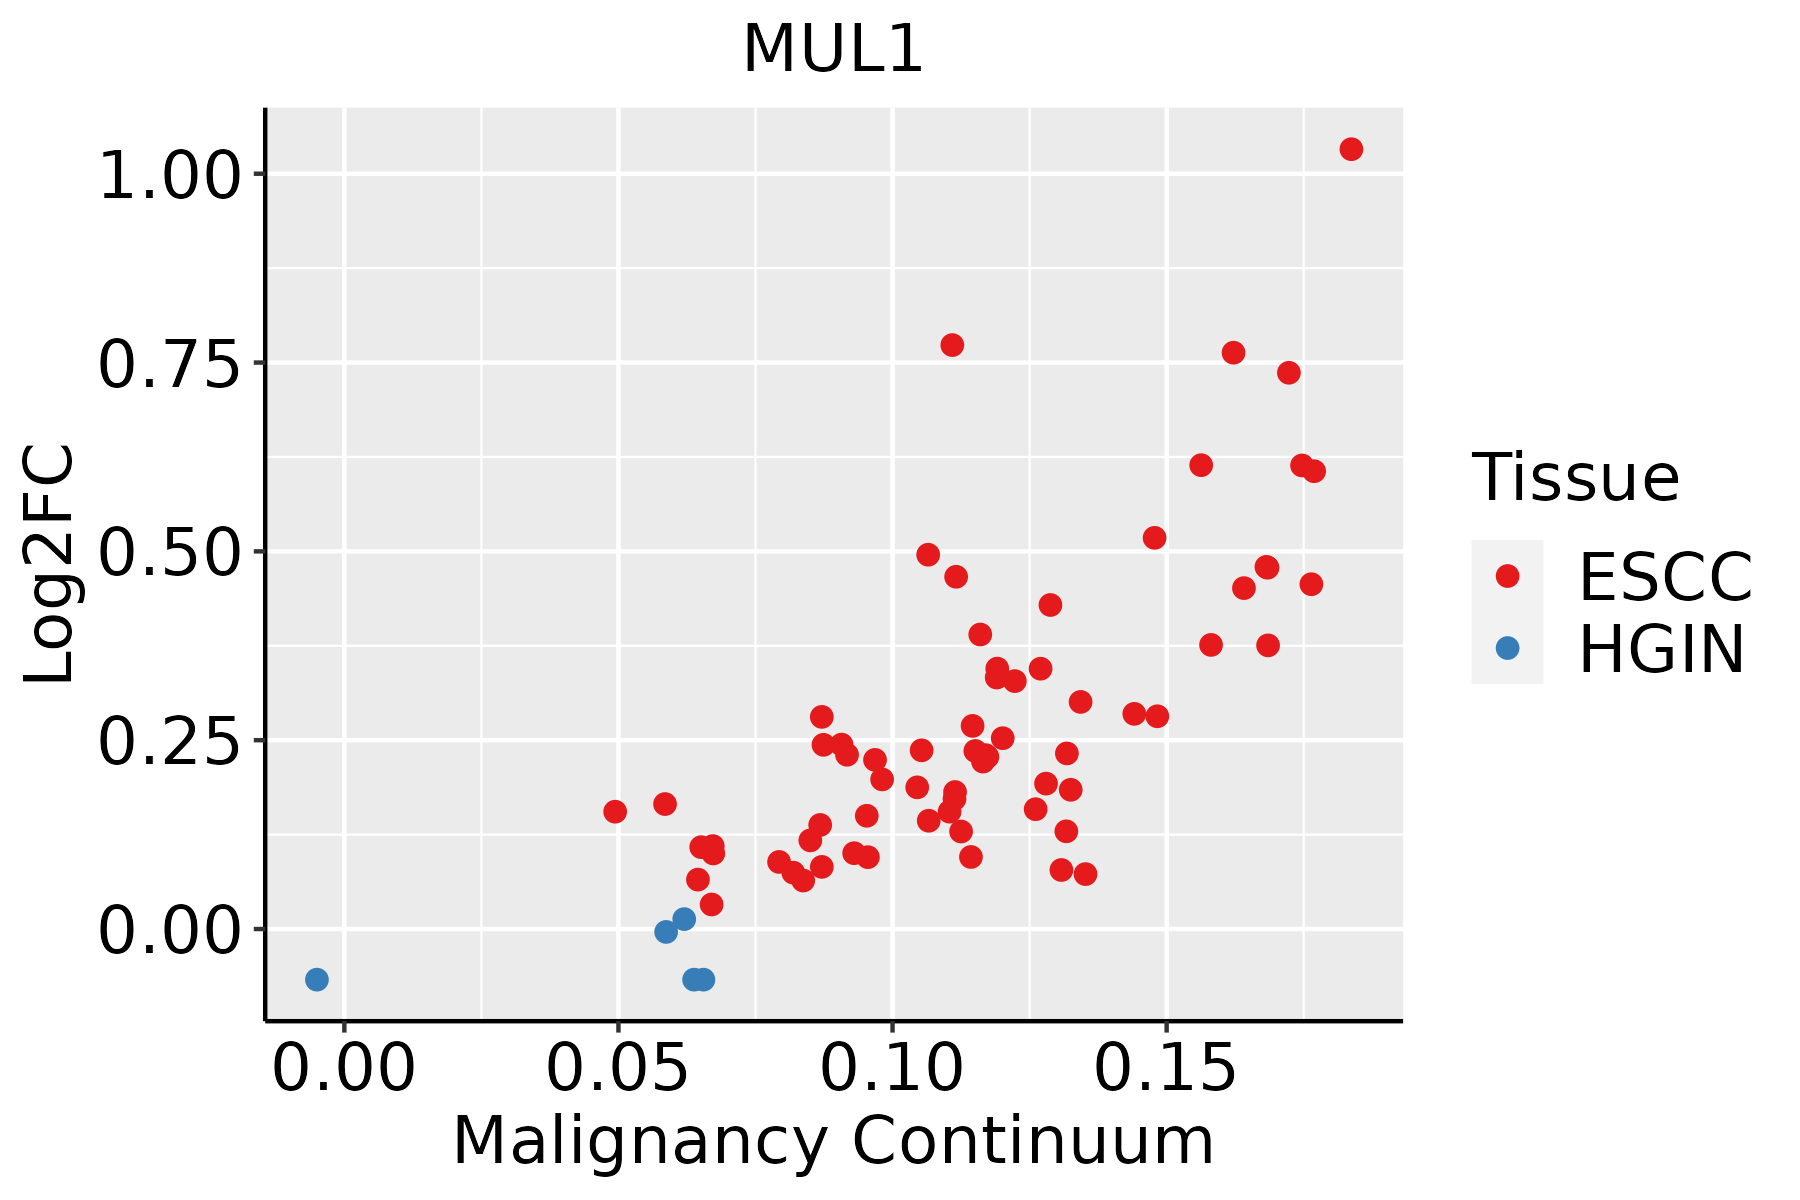 | ESCC: Esophageal squamous cell carcinoma |
| HGIN: High-grade intraepithelial neoplasias | ||
| LGIN: Low-grade intraepithelial neoplasias | ||
| Liver |  | HCC: Hepatocellular carcinoma |
| NAFLD: Non-alcoholic fatty liver disease | ||
| Oral Cavity | 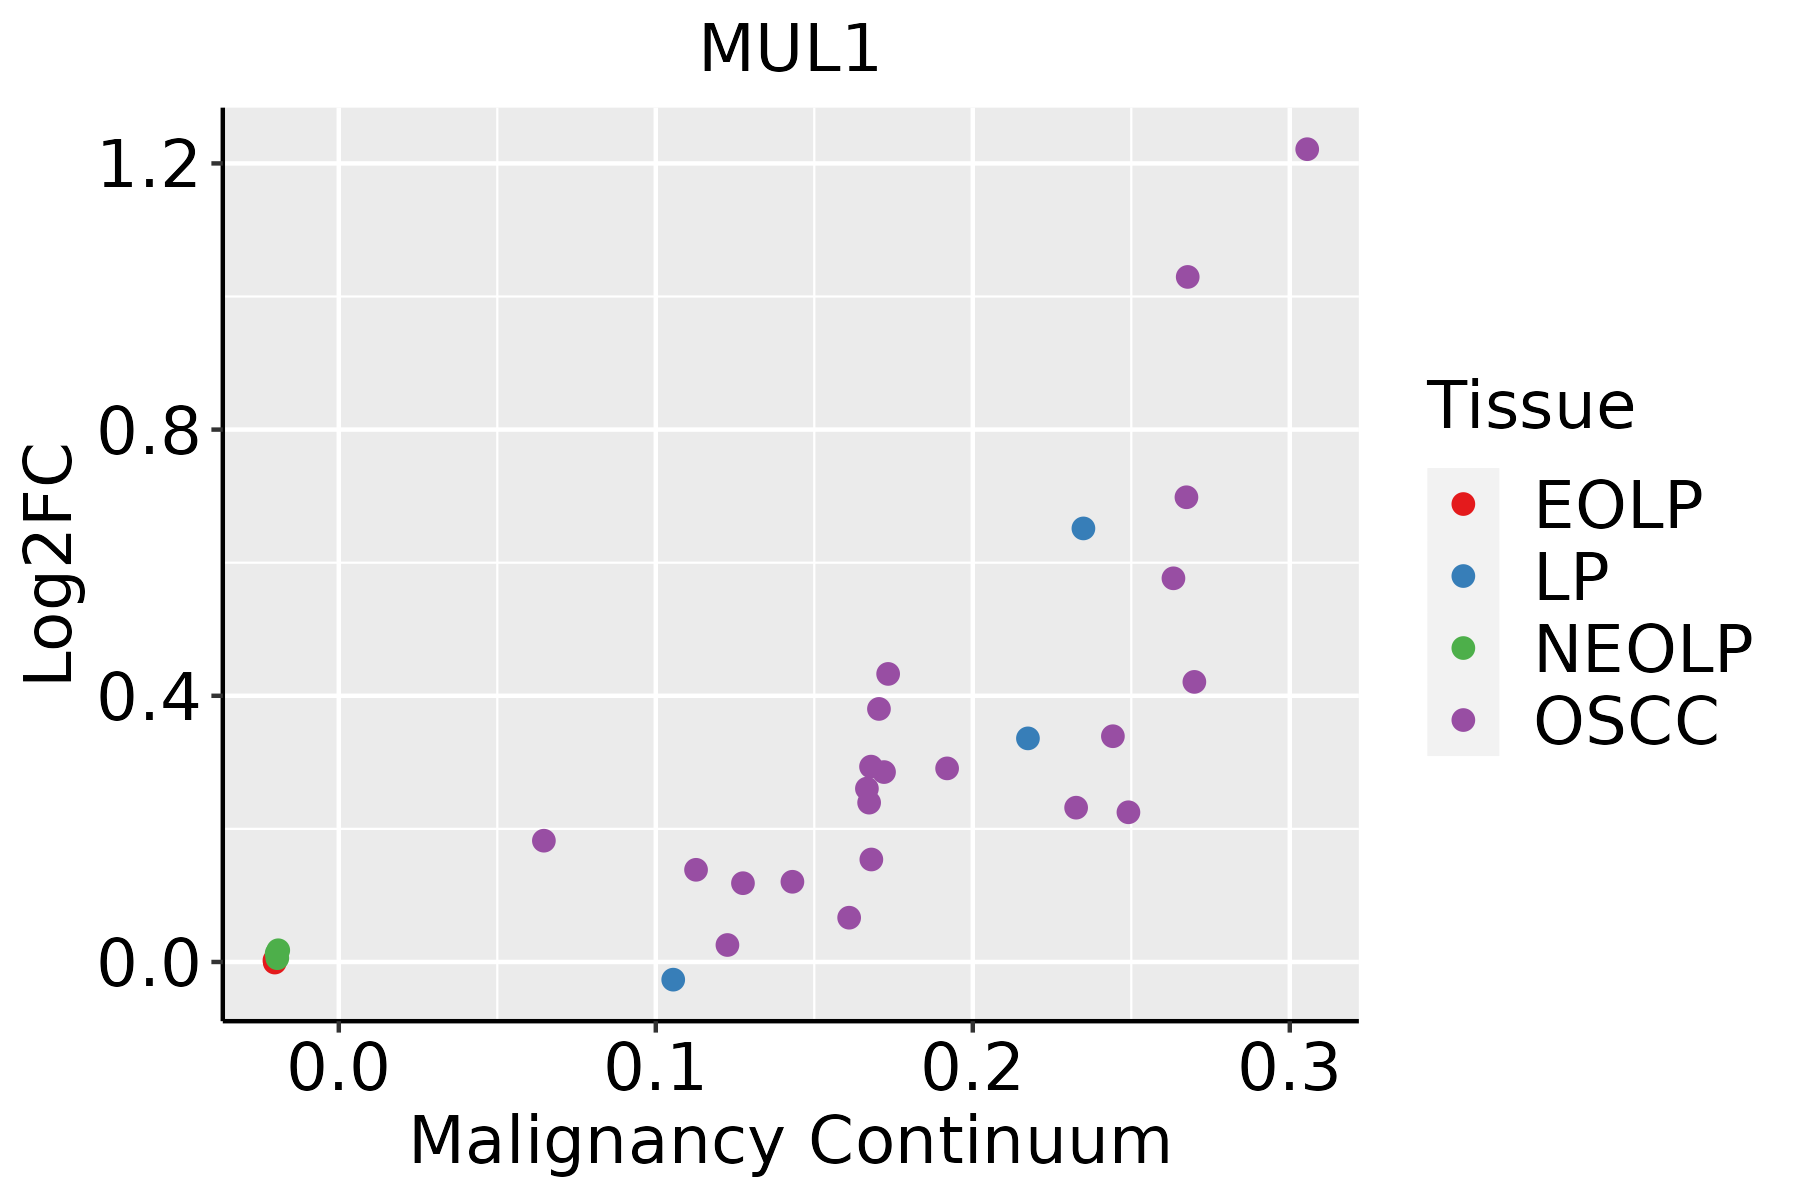 | EOLP: Erosive Oral lichen planus |
| LP: leukoplakia | ||
| NEOLP: Non-erosive oral lichen planus | ||
| OSCC: Oral squamous cell carcinoma | ||
| Skin |  | AK: Actinic keratosis |
| cSCC: Cutaneous squamous cell carcinoma | ||
| SCCIS:squamous cell carcinoma in situ |
| ∗log2FC in expression of this searched gene in stem-like cells from each diseased tissue sample relative to stem-like cells in normal samples in each tissue plotted against the malignancy continuum. Samples are colored based on if they are from different disease stage. |
Top |
Malignant transformation related pathway analysis |
| Find out the enriched GO biological processes and KEGG pathways involved in transition from healthy to precancer to cancer |
| Tissue | Disease Stage | Enriched GO biological Processes |
| Colorectum | AD |  |
| Colorectum | SER |  |
| Colorectum | MSS |  |
| Colorectum | MSI-H |  |
| Colorectum | FAP |  |
| ∗Top 15 enriched GO BP terms are showed in the bar plot of each disease state in each tissue. Each row represents a significant GO biological process which is colored according to the -log10(p.adjust). |
| Page: 1 2 3 4 5 6 7 8 9 |
| GO ID | Tissue | Disease Stage | Description | Gene Ratio | Bg Ratio | pvalue | p.adjust | Count |
| GO:00516075 | Esophagus | ESCC | defense response to virus | 171/8552 | 265/18723 | 3.91e-10 | 1.05e-08 | 171 |
| GO:01405465 | Esophagus | ESCC | defense response to symbiont | 171/8552 | 265/18723 | 3.91e-10 | 1.05e-08 | 171 |
| GO:0010952111 | Esophagus | ESCC | positive regulation of peptidase activity | 133/8552 | 197/18723 | 4.31e-10 | 1.14e-08 | 133 |
| GO:190332216 | Esophagus | ESCC | positive regulation of protein modification by small protein conjugation or removal | 99/8552 | 138/18723 | 4.39e-10 | 1.16e-08 | 99 |
| GO:0052547111 | Esophagus | ESCC | regulation of peptidase activity | 275/8552 | 461/18723 | 7.54e-10 | 1.88e-08 | 275 |
| GO:0010639110 | Esophagus | ESCC | negative regulation of organelle organization | 215/8552 | 348/18723 | 8.20e-10 | 2.01e-08 | 215 |
| GO:000155819 | Esophagus | ESCC | regulation of cell growth | 248/8552 | 414/18723 | 2.97e-09 | 6.45e-08 | 248 |
| GO:000042217 | Esophagus | ESCC | autophagy of mitochondrion | 63/8552 | 81/18723 | 3.41e-09 | 7.24e-08 | 63 |
| GO:006172617 | Esophagus | ESCC | mitochondrion disassembly | 63/8552 | 81/18723 | 3.41e-09 | 7.24e-08 | 63 |
| GO:003434013 | Esophagus | ESCC | response to type I interferon | 48/8552 | 58/18723 | 6.18e-09 | 1.26e-07 | 48 |
| GO:001082215 | Esophagus | ESCC | positive regulation of mitochondrion organization | 58/8552 | 74/18723 | 8.55e-09 | 1.73e-07 | 58 |
| GO:0052548111 | Esophagus | ESCC | regulation of endopeptidase activity | 253/8552 | 432/18723 | 3.68e-08 | 6.78e-07 | 253 |
| GO:00603375 | Esophagus | ESCC | type I interferon signaling pathway | 41/8552 | 50/18723 | 1.35e-07 | 2.17e-06 | 41 |
| GO:0010950111 | Esophagus | ESCC | positive regulation of endopeptidase activity | 116/8552 | 179/18723 | 1.77e-07 | 2.79e-06 | 116 |
| GO:004690217 | Esophagus | ESCC | regulation of mitochondrial membrane permeability | 49/8552 | 63/18723 | 1.91e-07 | 2.97e-06 | 49 |
| GO:00713575 | Esophagus | ESCC | cellular response to type I interferon | 42/8552 | 52/18723 | 2.15e-07 | 3.30e-06 | 42 |
| GO:00905599 | Esophagus | ESCC | regulation of membrane permeability | 58/8552 | 78/18723 | 2.38e-07 | 3.61e-06 | 58 |
| GO:00357948 | Esophagus | ESCC | positive regulation of mitochondrial membrane permeability | 36/8552 | 43/18723 | 2.90e-07 | 4.20e-06 | 36 |
| GO:00482844 | Esophagus | ESCC | organelle fusion | 94/8552 | 141/18723 | 3.72e-07 | 5.16e-06 | 94 |
| GO:009734510 | Esophagus | ESCC | mitochondrial outer membrane permeabilization | 28/8552 | 32/18723 | 1.02e-06 | 1.29e-05 | 28 |
| Page: 1 2 3 4 5 6 7 8 9 10 11 12 13 14 15 16 17 18 19 |
| Pathway ID | Tissue | Disease Stage | Description | Gene Ratio | Bg Ratio | pvalue | p.adjust | qvalue | Count |
| Page: 1 |
Top |
Cell-cell communication analysis |
| Identification of potential cell-cell interactions between two cell types and their ligand-receptor pairs for different disease states |
| Ligand | Receptor | LRpair | Pathway | Tissue | Disease Stage |
| Page: 1 |
Top |
Single-cell gene regulatory network inference analysis |
| Find out the significant the regulons (TFs) and the target genes of each regulon across cell types for different disease states |
| TF | Cell Type | Tissue | Disease Stage | Target Gene | RSS | Regulon Activity |
| ∗The dot plots of a searched regulon are shown for all cell subpopulations in each disease state of each tissue based on the regulon specific score inferred using pySCENIC and by calculating the average expression. |
| Page: 1 |
Top |
Somatic mutation of malignant transformation related genes |
| Annotation of somatic variants for genes involved in malignant transformation |
| Hugo Symbol | Variant Class | Variant Classification | dbSNP RS | HGVSc | HGVSp | HGVSp Short | SWISSPROT | BIOTYPE | SIFT | PolyPhen | Tumor Sample Barcode | Tissue | Histology | Sex | Age | Stage | Therapy Types | Drugs | Outcome |
| MUL1 | SNV | Missense_Mutation | rs376018959 | c.796N>T | p.Arg266Trp | p.R266W | Q969V5 | protein_coding | tolerated(0.2) | benign(0) | TCGA-BH-A42T-01 | Breast | breast invasive carcinoma | Female | >=65 | I/II | Unknown | Unknown | SD |
| MUL1 | insertion | Nonsense_Mutation | novel | c.250_251insGATCTGGGTCTAGAGACTGTGTATGAGAAGT | p.Val84GlyfsTer9 | p.V84Gfs*9 | Q969V5 | protein_coding | TCGA-BH-A0DS-01 | Breast | breast invasive carcinoma | Female | >=65 | III/IV | Chemotherapy | cyclophosphamide | SD | ||
| MUL1 | SNV | Missense_Mutation | novel | c.901G>A | p.Ala301Thr | p.A301T | Q969V5 | protein_coding | tolerated(0.21) | benign(0.003) | TCGA-2W-A8YY-01 | Cervix | cervical & endocervical cancer | Female | <65 | I/II | Chemotherapy | cisplatin | CR |
| MUL1 | SNV | Missense_Mutation | c.419N>A | p.Arg140Gln | p.R140Q | Q969V5 | protein_coding | deleterious(0.01) | probably_damaging(0.998) | TCGA-EK-A3GK-01 | Cervix | cervical & endocervical cancer | Female | <65 | I/II | Unknown | Unknown | SD | |
| MUL1 | SNV | Missense_Mutation | c.419N>A | p.Arg140Gln | p.R140Q | Q969V5 | protein_coding | deleterious(0.01) | probably_damaging(0.998) | TCGA-ZJ-AB0I-01 | Cervix | cervical & endocervical cancer | Female | <65 | I/II | Unknown | Unknown | SD | |
| MUL1 | SNV | Missense_Mutation | c.331A>T | p.Asn111Tyr | p.N111Y | Q969V5 | protein_coding | deleterious(0.01) | probably_damaging(1) | TCGA-A6-2686-01 | Colorectum | colon adenocarcinoma | Female | >=65 | I/II | Unknown | Unknown | SD | |
| MUL1 | SNV | Missense_Mutation | rs139030069 | c.985N>A | p.Ala329Thr | p.A329T | Q969V5 | protein_coding | deleterious(0) | benign(0.295) | TCGA-AA-3667-01 | Colorectum | colon adenocarcinoma | Female | <65 | I/II | Unknown | Unknown | SD |
| MUL1 | SNV | Missense_Mutation | rs749366428 | c.818N>G | p.Lys273Arg | p.K273R | Q969V5 | protein_coding | tolerated(0.98) | benign(0) | TCGA-AA-3715-01 | Colorectum | colon adenocarcinoma | Male | >=65 | I/II | Unknown | Unknown | PD |
| MUL1 | SNV | Missense_Mutation | rs758966256 | c.532N>T | p.Arg178Trp | p.R178W | Q969V5 | protein_coding | deleterious(0) | probably_damaging(0.92) | TCGA-AA-3715-01 | Colorectum | colon adenocarcinoma | Male | >=65 | I/II | Unknown | Unknown | PD |
| MUL1 | SNV | Missense_Mutation | c.758N>T | p.Ala253Val | p.A253V | Q969V5 | protein_coding | tolerated(0.08) | benign(0.005) | TCGA-AD-6889-01 | Colorectum | colon adenocarcinoma | Male | >=65 | I/II | Chemotherapy | xeloda | PD |
| Page: 1 2 3 4 5 |
Top |
Related drugs of malignant transformation related genes |
| Identification of chemicals and drugs interact with genes involved in malignant transfromation |
| (DGIdb 4.0) |
| Entrez ID | Symbol | Category | Interaction Types | Drug Claim Name | Drug Name | PMIDs |
| Page: 1 |

Copyright 2023-Present -The University of Texas Health Science Center at Houston |