
|
|||||
|
 | |
| |
| |
| |
| |
| |
|
Gene: MTMR4 |
Gene summary for MTMR4 |
| Gene information | Species | Human | Gene symbol | MTMR4 | Gene ID | 9110 |
| Gene name | myotubularin related protein 4 | |
| Gene Alias | FYVE-DSP2 | |
| Cytomap | 17q22 | |
| Gene Type | protein-coding | GO ID | GO:0006464 | UniProtAcc | Q9NYA4 |
Top |
Malignant transformation analysis |
| Identification of the aberrant gene expression in precancerous and cancerous lesions by comparing the gene expression of stem-like cells in diseased tissues with normal stem cells |
| Entrez ID | Symbol | Replicates | Species | Organ | Tissue | Adj P-value | Log2FC | Malignancy |
| 9110 | MTMR4 | LZE4T | Human | Esophagus | ESCC | 9.13e-05 | 1.97e-01 | 0.0811 |
| 9110 | MTMR4 | LZE7T | Human | Esophagus | ESCC | 6.29e-03 | 2.14e-01 | 0.0667 |
| 9110 | MTMR4 | LZE24T | Human | Esophagus | ESCC | 3.88e-06 | 2.24e-01 | 0.0596 |
| 9110 | MTMR4 | LZE21T | Human | Esophagus | ESCC | 8.50e-03 | 2.87e-01 | 0.0655 |
| 9110 | MTMR4 | P1T-E | Human | Esophagus | ESCC | 5.18e-08 | 3.47e-01 | 0.0875 |
| 9110 | MTMR4 | P2T-E | Human | Esophagus | ESCC | 1.03e-25 | 2.67e-01 | 0.1177 |
| 9110 | MTMR4 | P4T-E | Human | Esophagus | ESCC | 8.37e-09 | 2.00e-01 | 0.1323 |
| 9110 | MTMR4 | P8T-E | Human | Esophagus | ESCC | 6.84e-10 | 1.61e-01 | 0.0889 |
| 9110 | MTMR4 | P9T-E | Human | Esophagus | ESCC | 4.30e-10 | 1.28e-01 | 0.1131 |
| 9110 | MTMR4 | P10T-E | Human | Esophagus | ESCC | 2.01e-20 | 3.75e-01 | 0.116 |
| 9110 | MTMR4 | P11T-E | Human | Esophagus | ESCC | 5.45e-03 | 1.58e-01 | 0.1426 |
| 9110 | MTMR4 | P12T-E | Human | Esophagus | ESCC | 4.39e-22 | 2.72e-01 | 0.1122 |
| 9110 | MTMR4 | P15T-E | Human | Esophagus | ESCC | 1.24e-11 | 2.65e-01 | 0.1149 |
| 9110 | MTMR4 | P16T-E | Human | Esophagus | ESCC | 3.47e-11 | 2.35e-01 | 0.1153 |
| 9110 | MTMR4 | P17T-E | Human | Esophagus | ESCC | 2.77e-03 | 1.39e-01 | 0.1278 |
| 9110 | MTMR4 | P20T-E | Human | Esophagus | ESCC | 5.87e-04 | 1.05e-01 | 0.1124 |
| 9110 | MTMR4 | P21T-E | Human | Esophagus | ESCC | 4.10e-12 | 1.51e-01 | 0.1617 |
| 9110 | MTMR4 | P22T-E | Human | Esophagus | ESCC | 8.21e-09 | 2.30e-01 | 0.1236 |
| 9110 | MTMR4 | P23T-E | Human | Esophagus | ESCC | 1.36e-14 | 3.47e-01 | 0.108 |
| 9110 | MTMR4 | P24T-E | Human | Esophagus | ESCC | 3.65e-10 | 1.66e-01 | 0.1287 |
| Page: 1 2 3 4 |
| Tissue | Expression Dynamics | Abbreviation |
| Esophagus | 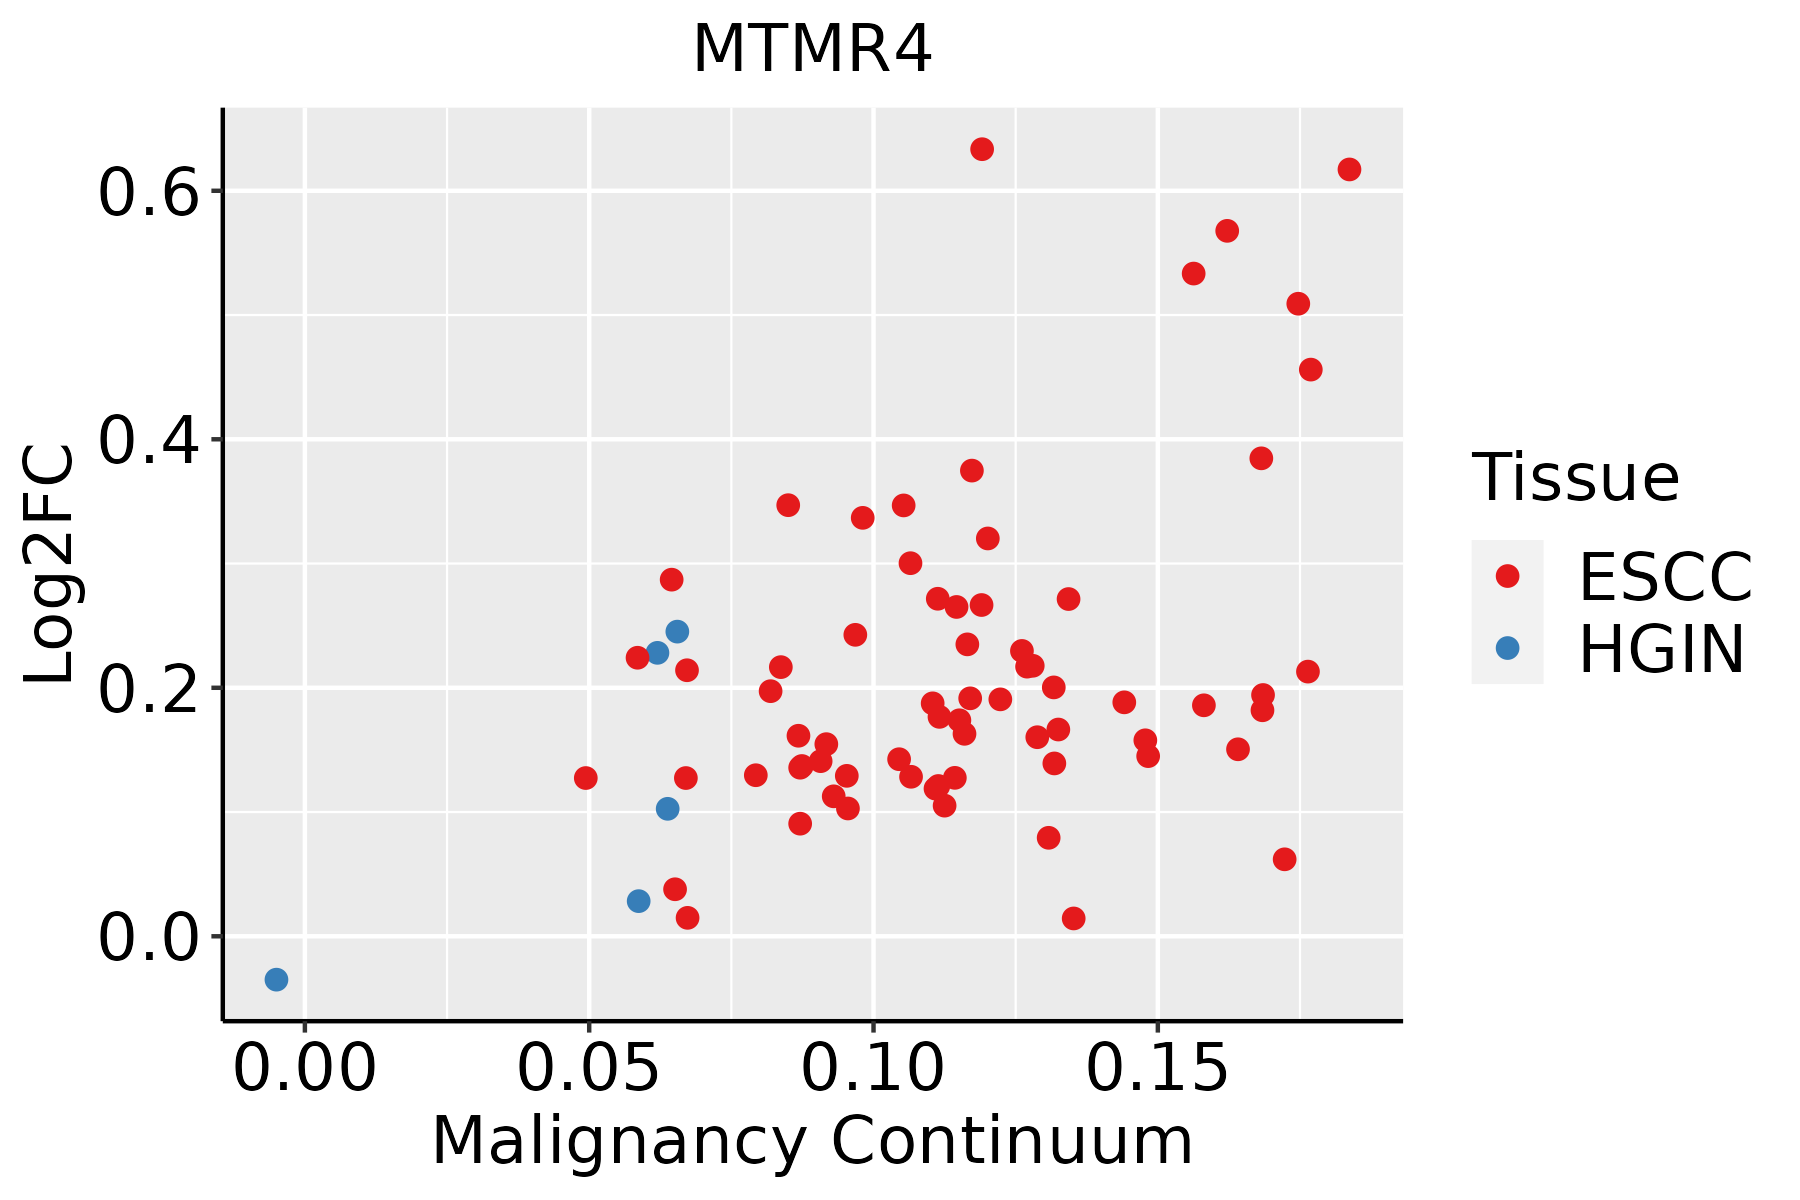 | ESCC: Esophageal squamous cell carcinoma |
| HGIN: High-grade intraepithelial neoplasias | ||
| LGIN: Low-grade intraepithelial neoplasias | ||
| Liver | 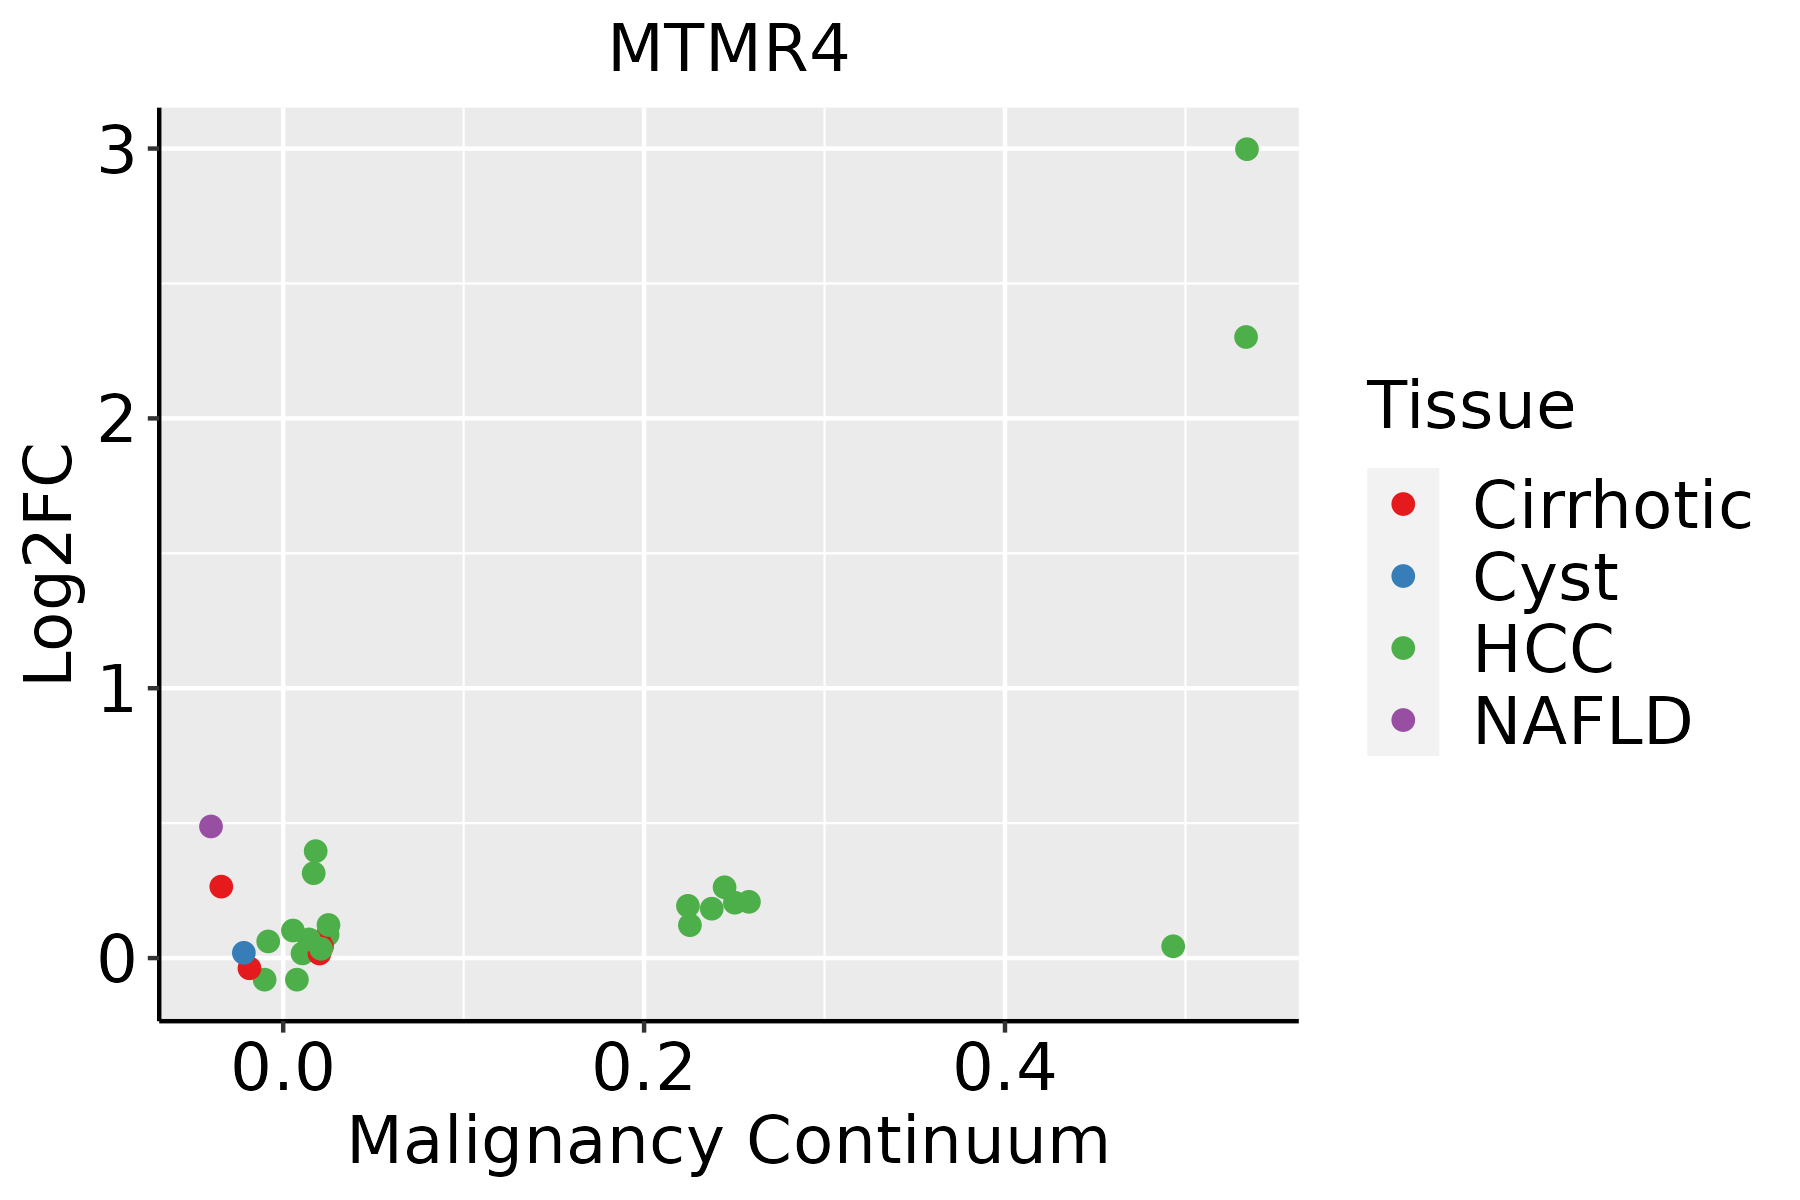 | HCC: Hepatocellular carcinoma |
| NAFLD: Non-alcoholic fatty liver disease | ||
| Thyroid | 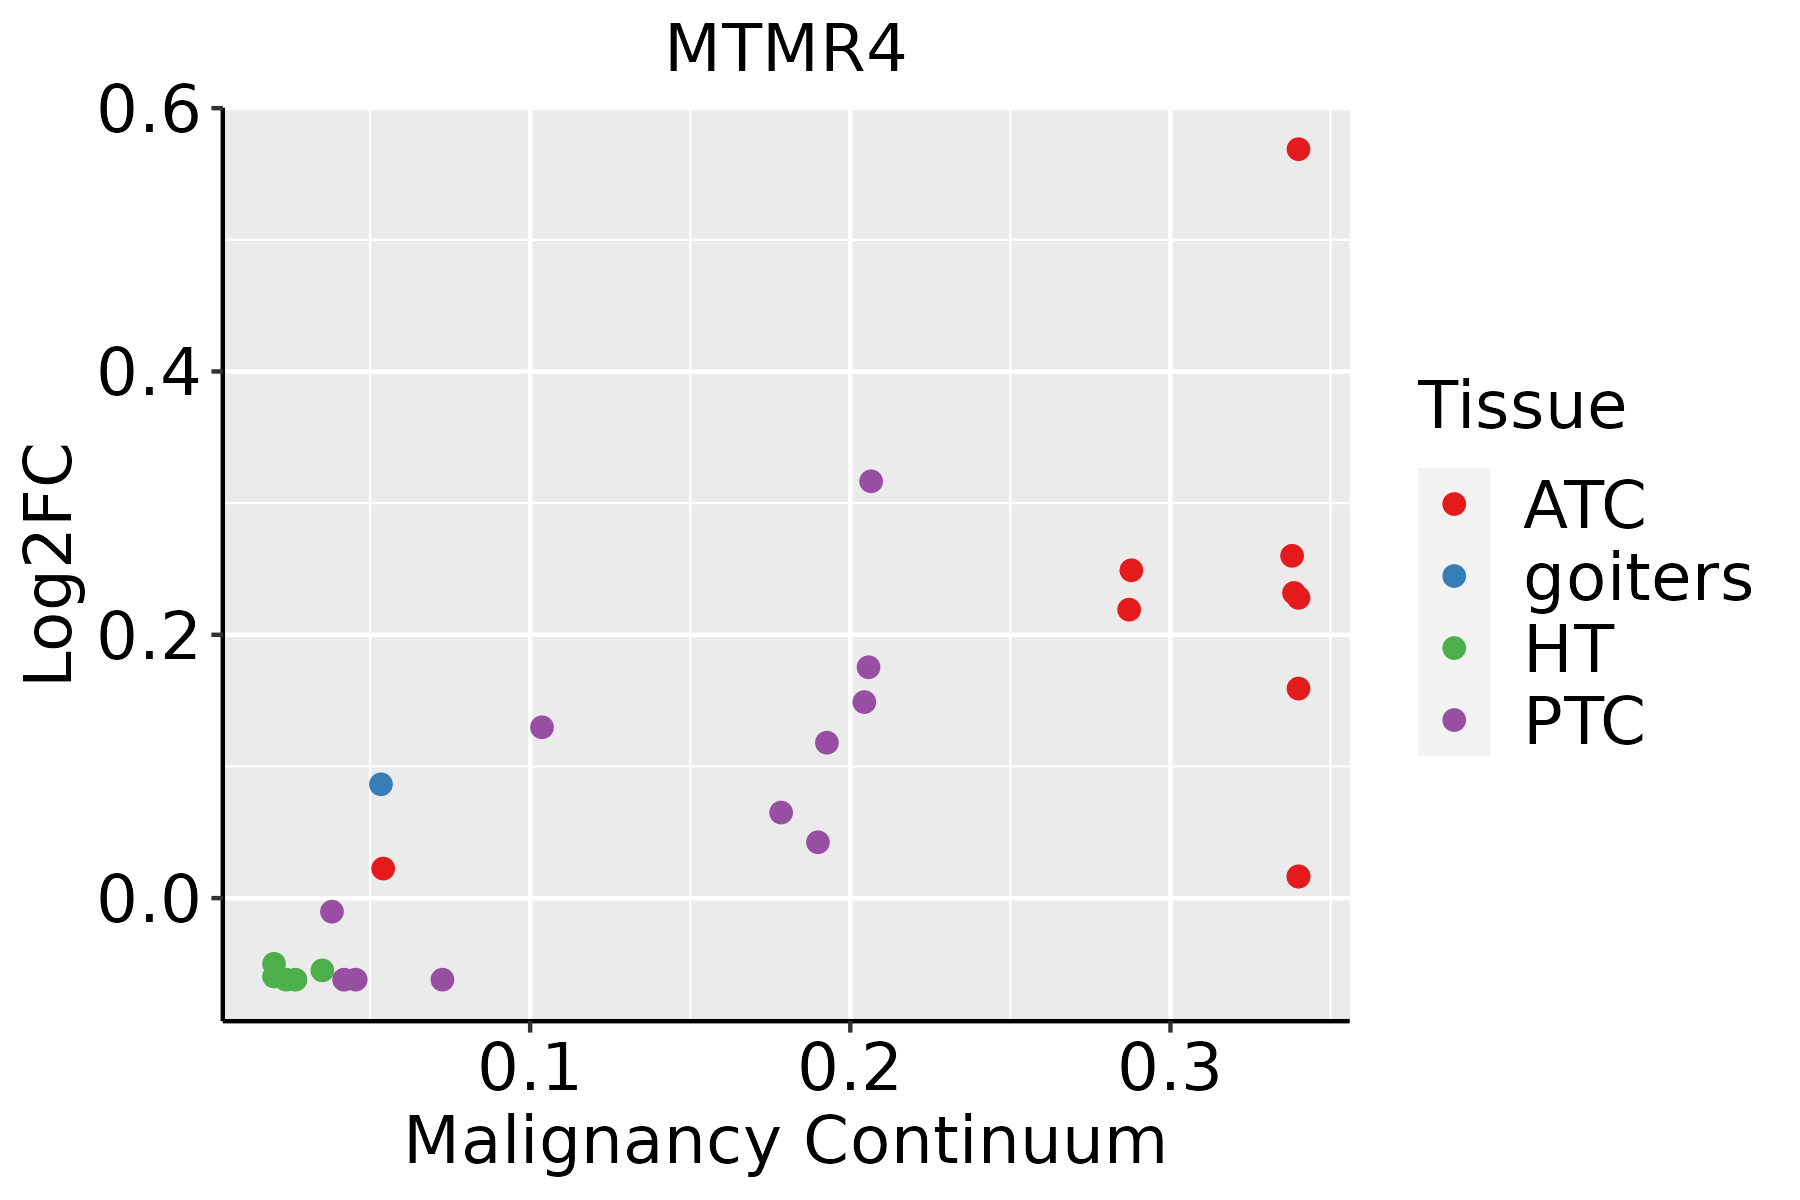 | ATC: Anaplastic thyroid cancer |
| HT: Hashimoto's thyroiditis | ||
| PTC: Papillary thyroid cancer |
| ∗log2FC in expression of this searched gene in stem-like cells from each diseased tissue sample relative to stem-like cells in normal samples in each tissue plotted against the malignancy continuum. Samples are colored based on if they are from different disease stage. |
Top |
Malignant transformation related pathway analysis |
| Find out the enriched GO biological processes and KEGG pathways involved in transition from healthy to precancer to cancer |
| Tissue | Disease Stage | Enriched GO biological Processes |
| Colorectum | AD |  |
| Colorectum | SER |  |
| Colorectum | MSS |  |
| Colorectum | MSI-H |  |
| Colorectum | FAP |  |
| ∗Top 15 enriched GO BP terms are showed in the bar plot of each disease state in each tissue. Each row represents a significant GO biological process which is colored according to the -log10(p.adjust). |
| Page: 1 2 3 4 5 6 7 8 9 |
| GO ID | Tissue | Disease Stage | Description | Gene Ratio | Bg Ratio | pvalue | p.adjust | Count |
| GO:00715593 | Liver | NAFLD | response to transforming growth factor beta | 51/1882 | 256/18723 | 1.43e-06 | 6.58e-05 | 51 |
| GO:00192163 | Liver | NAFLD | regulation of lipid metabolic process | 61/1882 | 331/18723 | 2.18e-06 | 9.24e-05 | 61 |
| GO:00715603 | Liver | NAFLD | cellular response to transforming growth factor beta stimulus | 48/1882 | 250/18723 | 8.27e-06 | 2.76e-04 | 48 |
| GO:00105065 | Liver | NAFLD | regulation of autophagy | 57/1882 | 317/18723 | 1.00e-05 | 3.18e-04 | 57 |
| GO:00464863 | Liver | NAFLD | glycerolipid metabolic process | 66/1882 | 392/18723 | 1.94e-05 | 5.52e-04 | 66 |
| GO:00163115 | Liver | NAFLD | dephosphorylation | 69/1882 | 417/18723 | 2.27e-05 | 6.23e-04 | 69 |
| GO:00064706 | Liver | NAFLD | protein dephosphorylation | 50/1882 | 281/18723 | 4.53e-05 | 1.09e-03 | 50 |
| GO:00071793 | Liver | NAFLD | transforming growth factor beta receptor signaling pathway | 37/1882 | 198/18723 | 1.53e-04 | 2.82e-03 | 37 |
| GO:00450174 | Liver | NAFLD | glycerolipid biosynthetic process | 43/1882 | 252/18723 | 3.83e-04 | 5.73e-03 | 43 |
| GO:00071784 | Liver | NAFLD | transmembrane receptor protein serine/threonine kinase signaling pathway | 56/1882 | 355/18723 | 4.50e-04 | 6.62e-03 | 56 |
| GO:19038443 | Liver | NAFLD | regulation of cellular response to transforming growth factor beta stimulus | 23/1882 | 131/18723 | 5.62e-03 | 4.29e-02 | 23 |
| GO:00464742 | Liver | NAFLD | glycerophospholipid biosynthetic process | 33/1882 | 211/18723 | 6.93e-03 | 4.88e-02 | 33 |
| GO:001050621 | Liver | HCC | regulation of autophagy | 210/7958 | 317/18723 | 7.59e-18 | 8.45e-16 | 210 |
| GO:00086542 | Liver | HCC | phospholipid biosynthetic process | 150/7958 | 253/18723 | 4.77e-08 | 1.03e-06 | 150 |
| GO:00066444 | Liver | HCC | phospholipid metabolic process | 214/7958 | 383/18723 | 7.25e-08 | 1.48e-06 | 214 |
| GO:001631121 | Liver | HCC | dephosphorylation | 230/7958 | 417/18723 | 1.00e-07 | 1.96e-06 | 230 |
| GO:000647021 | Liver | HCC | protein dephosphorylation | 162/7958 | 281/18723 | 1.91e-07 | 3.46e-06 | 162 |
| GO:004648611 | Liver | HCC | glycerolipid metabolic process | 215/7958 | 392/18723 | 4.54e-07 | 7.49e-06 | 215 |
| GO:004501711 | Liver | HCC | glycerolipid biosynthetic process | 143/7958 | 252/18723 | 3.27e-06 | 4.31e-05 | 143 |
| GO:003025821 | Liver | HCC | lipid modification | 123/7958 | 212/18723 | 3.50e-06 | 4.58e-05 | 123 |
| Page: 1 2 3 4 |
| Pathway ID | Tissue | Disease Stage | Description | Gene Ratio | Bg Ratio | pvalue | p.adjust | qvalue | Count |
| hsa0414010 | Esophagus | ESCC | Autophagy - animal | 101/4205 | 141/8465 | 7.60e-08 | 6.21e-07 | 3.18e-07 | 101 |
| hsa0414015 | Esophagus | ESCC | Autophagy - animal | 101/4205 | 141/8465 | 7.60e-08 | 6.21e-07 | 3.18e-07 | 101 |
| hsa0414021 | Liver | HCC | Autophagy - animal | 99/4020 | 141/8465 | 3.08e-08 | 4.70e-07 | 2.61e-07 | 99 |
| hsa0414031 | Liver | HCC | Autophagy - animal | 99/4020 | 141/8465 | 3.08e-08 | 4.70e-07 | 2.61e-07 | 99 |
| Page: 1 |
Top |
Cell-cell communication analysis |
| Identification of potential cell-cell interactions between two cell types and their ligand-receptor pairs for different disease states |
| Ligand | Receptor | LRpair | Pathway | Tissue | Disease Stage |
| Page: 1 |
Top |
Single-cell gene regulatory network inference analysis |
| Find out the significant the regulons (TFs) and the target genes of each regulon across cell types for different disease states |
| TF | Cell Type | Tissue | Disease Stage | Target Gene | RSS | Regulon Activity |
| ∗The dot plots of a searched regulon are shown for all cell subpopulations in each disease state of each tissue based on the regulon specific score inferred using pySCENIC and by calculating the average expression. |
| Page: 1 |
Top |
Somatic mutation of malignant transformation related genes |
| Annotation of somatic variants for genes involved in malignant transformation |
| Hugo Symbol | Variant Class | Variant Classification | dbSNP RS | HGVSc | HGVSp | HGVSp Short | SWISSPROT | BIOTYPE | SIFT | PolyPhen | Tumor Sample Barcode | Tissue | Histology | Sex | Age | Stage | Therapy Types | Drugs | Outcome |
| MTMR4 | SNV | Missense_Mutation | c.1730G>A | p.Cys577Tyr | p.C577Y | Q9NYA4 | protein_coding | deleterious(0.01) | benign(0.374) | TCGA-A7-A0CE-01 | Breast | breast invasive carcinoma | Female | <65 | I/II | Chemotherapy | adriamycin | SD | |
| MTMR4 | SNV | Missense_Mutation | novel | c.3304N>T | p.Asp1102Tyr | p.D1102Y | Q9NYA4 | protein_coding | deleterious(0) | probably_damaging(0.978) | TCGA-AN-A046-01 | Breast | breast invasive carcinoma | Female | >=65 | I/II | Unknown | Unknown | SD |
| MTMR4 | SNV | Missense_Mutation | c.2899N>G | p.His967Asp | p.H967D | Q9NYA4 | protein_coding | tolerated_low_confidence(0.34) | benign(0.072) | TCGA-AO-A0J4-01 | Breast | breast invasive carcinoma | Female | <65 | I/II | Chemotherapy | doxorubicin | SD | |
| MTMR4 | SNV | Missense_Mutation | c.2278N>T | p.Ala760Ser | p.A760S | Q9NYA4 | protein_coding | tolerated_low_confidence(0.92) | benign(0) | TCGA-AO-A0J9-01 | Breast | breast invasive carcinoma | Female | <65 | III/IV | Chemotherapy | cyclophosphamide | PD | |
| MTMR4 | SNV | Missense_Mutation | rs745483455 | c.1546N>C | p.Cys516Arg | p.C516R | Q9NYA4 | protein_coding | tolerated(0.74) | benign(0.001) | TCGA-AO-A128-01 | Breast | breast invasive carcinoma | Female | <65 | I/II | Chemotherapy | doxorubicin | SD |
| MTMR4 | SNV | Missense_Mutation | c.1738N>C | p.Gly580Arg | p.G580R | Q9NYA4 | protein_coding | tolerated(0.11) | benign(0.003) | TCGA-BH-A0HI-01 | Breast | breast invasive carcinoma | Female | >=65 | I/II | Hormone Therapy | arimidex | SD | |
| MTMR4 | SNV | Missense_Mutation | novel | c.3400N>T | p.His1134Tyr | p.H1134Y | Q9NYA4 | protein_coding | deleterious(0) | probably_damaging(0.998) | TCGA-E2-A15R-01 | Breast | breast invasive carcinoma | Female | <65 | I/II | Chemotherapy | cyclophosphamide | SD |
| MTMR4 | insertion | Frame_Shift_Ins | novel | c.455-1_455insACACTTGCGCAATGGGGCTGCCATCGCCCGCT | p.Gly152AspfsTer151 | p.G152Dfs*151 | Q9NYA4 | protein_coding | TCGA-A2-A04Y-01 | Breast | breast invasive carcinoma | Female | <65 | I/II | Chemotherapy | cytoxan | SD | ||
| MTMR4 | insertion | In_Frame_Ins | novel | c.714_715insTGTTGCCCAGGCTGGACTGCAGTGGCACAATCT | p.Ile238_Ser239insCysCysProGlyTrpThrAlaValAlaGlnSer | p.I238_S239insCCPGWTAVAQS | Q9NYA4 | protein_coding | TCGA-A8-A07J-01 | Breast | breast invasive carcinoma | Female | <65 | I/II | Chemotherapy | 5-fluorouracil | CR | ||
| MTMR4 | insertion | In_Frame_Ins | novel | c.938_939insAGGGAAATGGGT | p.Ser313_Tyr314insGlyLysTrpVal | p.S313_Y314insGKWV | Q9NYA4 | protein_coding | TCGA-BH-A0BD-01 | Breast | breast invasive carcinoma | Female | <65 | I/II | Chemotherapy | doxorubicin | SD |
| Page: 1 2 3 4 5 6 7 8 9 10 11 12 13 14 |
Top |
Related drugs of malignant transformation related genes |
| Identification of chemicals and drugs interact with genes involved in malignant transfromation |
| (DGIdb 4.0) |
| Entrez ID | Symbol | Category | Interaction Types | Drug Claim Name | Drug Name | PMIDs |
| Page: 1 |

Copyright 2023-Present -The University of Texas Health Science Center at Houston |