Schematic overview of the cellular and molecular mechanisms involved in the cancer progression, including the proposed cellular and molecular mechanisms in cancer cells trajectory. AT1: alveolar type 1 cells; AT2: alveolar type 2 cells; AAH: atypical adenomatous hyperplasia; AIS: adenocarcinoma in situ; MIA: minimally invasive adenocarcinoma; IA: invasive adenocarcinoma; EMT: epithelial-mesenchymal transition

Home

Download

Statistics

Help

Contact

Center for Computational Systems Medicine
leaf

Gene summary

leaf

Malignant transformation analysis

leaf

Malignant transformation related pathway analysis

leaf

Cell-cell communication analysis

leaf

Single-cell gene regulatory network inference analysis

leaf

Somatic mutation of malignant transformation related genes

leaf

Related drugs of malignant transformation related genes

Gene: MSRB2

Gene summary for MSRB2

check button Gene summary.

Gene informationSpeciesHuman
Gene symbol

MSRB2

Gene ID

22921

Gene namemethionine sulfoxide reductase B2
Gene AliasCBS-1
Cytomap10p12.2
Gene Typeprotein-coding
GO ID

GO:0006807

UniProtAcc

Q9Y3D2


Top

Malignant transformation analysis

check button Identification of the aberrant gene expression in precancerous and cancerous lesions by comparing the gene expression of stem-like cells in diseased tissues with normal stem cells
check button Malignant transformation involving gene list.
Entrez IDSymbolReplicatesSpeciesOrganTissueAdj P-valueLog2FCMalignancy
22921MSRB2GSM4909281HumanBreastIDC5.46e-063.55e-010.21
22921MSRB2GSM4909285HumanBreastIDC1.52e-114.40e-010.21
22921MSRB2GSM4909289HumanBreastIDC3.18e-045.20e-010.1064
22921MSRB2GSM4909293HumanBreastIDC2.85e-124.19e-010.1581
22921MSRB2GSM4909294HumanBreastIDC6.72e-033.28e-010.2022
22921MSRB2GSM4909296HumanBreastIDC9.00e-042.68e-010.1524
22921MSRB2GSM4909301HumanBreastIDC4.76e-114.72e-010.1577
22921MSRB2GSM4909304HumanBreastIDC4.19e-074.29e-010.1636
22921MSRB2GSM4909306HumanBreastIDC1.17e-023.49e-010.1564
22921MSRB2GSM4909308HumanBreastIDC1.29e-072.86e-010.158
22921MSRB2GSM4909311HumanBreastIDC8.76e-13-6.77e-020.1534
22921MSRB2GSM4909315HumanBreastIDC1.07e-177.08e-010.21
22921MSRB2GSM4909316HumanBreastIDC1.92e-096.47e-010.21
22921MSRB2GSM4909319HumanBreastIDC9.80e-219.84e-020.1563
22921MSRB2GSM4909321HumanBreastIDC1.01e-027.41e-020.1559
22921MSRB2M1HumanBreastIDC5.43e-042.84e-010.1577
22921MSRB2DCIS2HumanBreastDCIS1.33e-512.29e-010.0085
22921MSRB2HTA11_1938_2000001011HumanColorectumAD1.25e-032.90e-01-0.0811
22921MSRB2HTA11_347_2000001011HumanColorectumAD2.48e-082.68e-01-0.1954
22921MSRB2HTA11_3361_2000001011HumanColorectumAD4.78e-032.48e-01-0.1207
Page: 1 2 3 4 5 6 7 8 

check button Transcriptomic changes along malignancy continuum.
TissueExpression DynamicsAbbreviation
BreastThe image shows the transcriptomic changes along malignancy continuum.log2FC in expression of this searched gene in stem-like cells from each diseased tissue sample relative to stem-like cells in normal samples in each tissue plotted against the malignancy continuum. Samples are colored based on if they are from different disease stage.
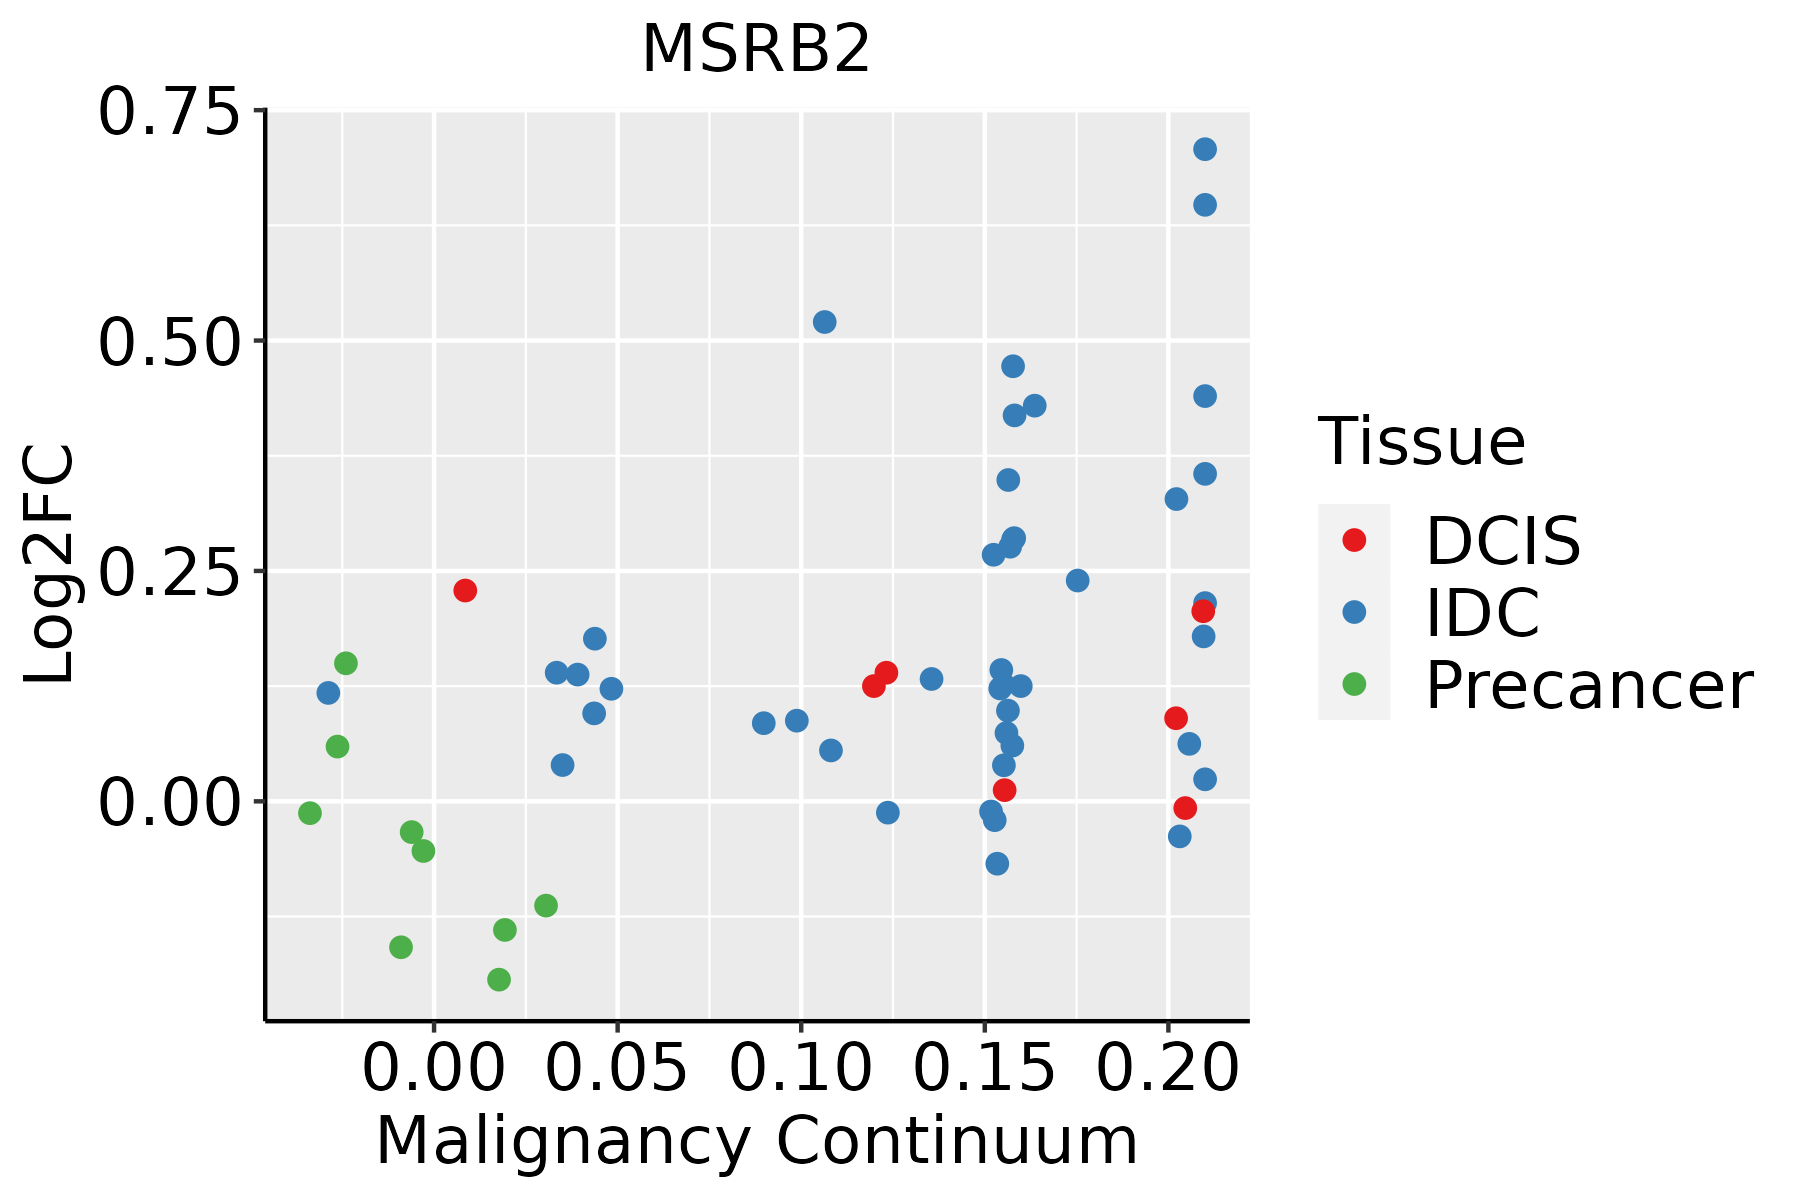
IDC: Invasive ductal carcinoma
DCIS: Ductal carcinoma in situ
Precancer(BRCA1-mut): Precancerous lesion from BRCA1 mutation carriers
Colorectum (GSE201348)The image shows the transcriptomic changes along malignancy continuum.log2FC in expression of this searched gene in stem-like cells from each diseased tissue sample relative to stem-like cells in normal samples in each tissue plotted against the malignancy continuum. Samples are colored based on if they are from different disease stage.FAP: Familial adenomatous polyposis
CRC: Colorectal cancer
Colorectum (HTA11)The image shows the transcriptomic changes along malignancy continuum.log2FC in expression of this searched gene in stem-like cells from each diseased tissue sample relative to stem-like cells in normal samples in each tissue plotted against the malignancy continuum. Samples are colored based on if they are from different disease stage.AD: Adenomas
SER: Sessile serrated lesions
MSI-H: Microsatellite-high colorectal cancer
MSS: Microsatellite stable colorectal cancer
EsophagusThe image shows the transcriptomic changes along malignancy continuum.log2FC in expression of this searched gene in stem-like cells from each diseased tissue sample relative to stem-like cells in normal samples in each tissue plotted against the malignancy continuum. Samples are colored based on if they are from different disease stage.
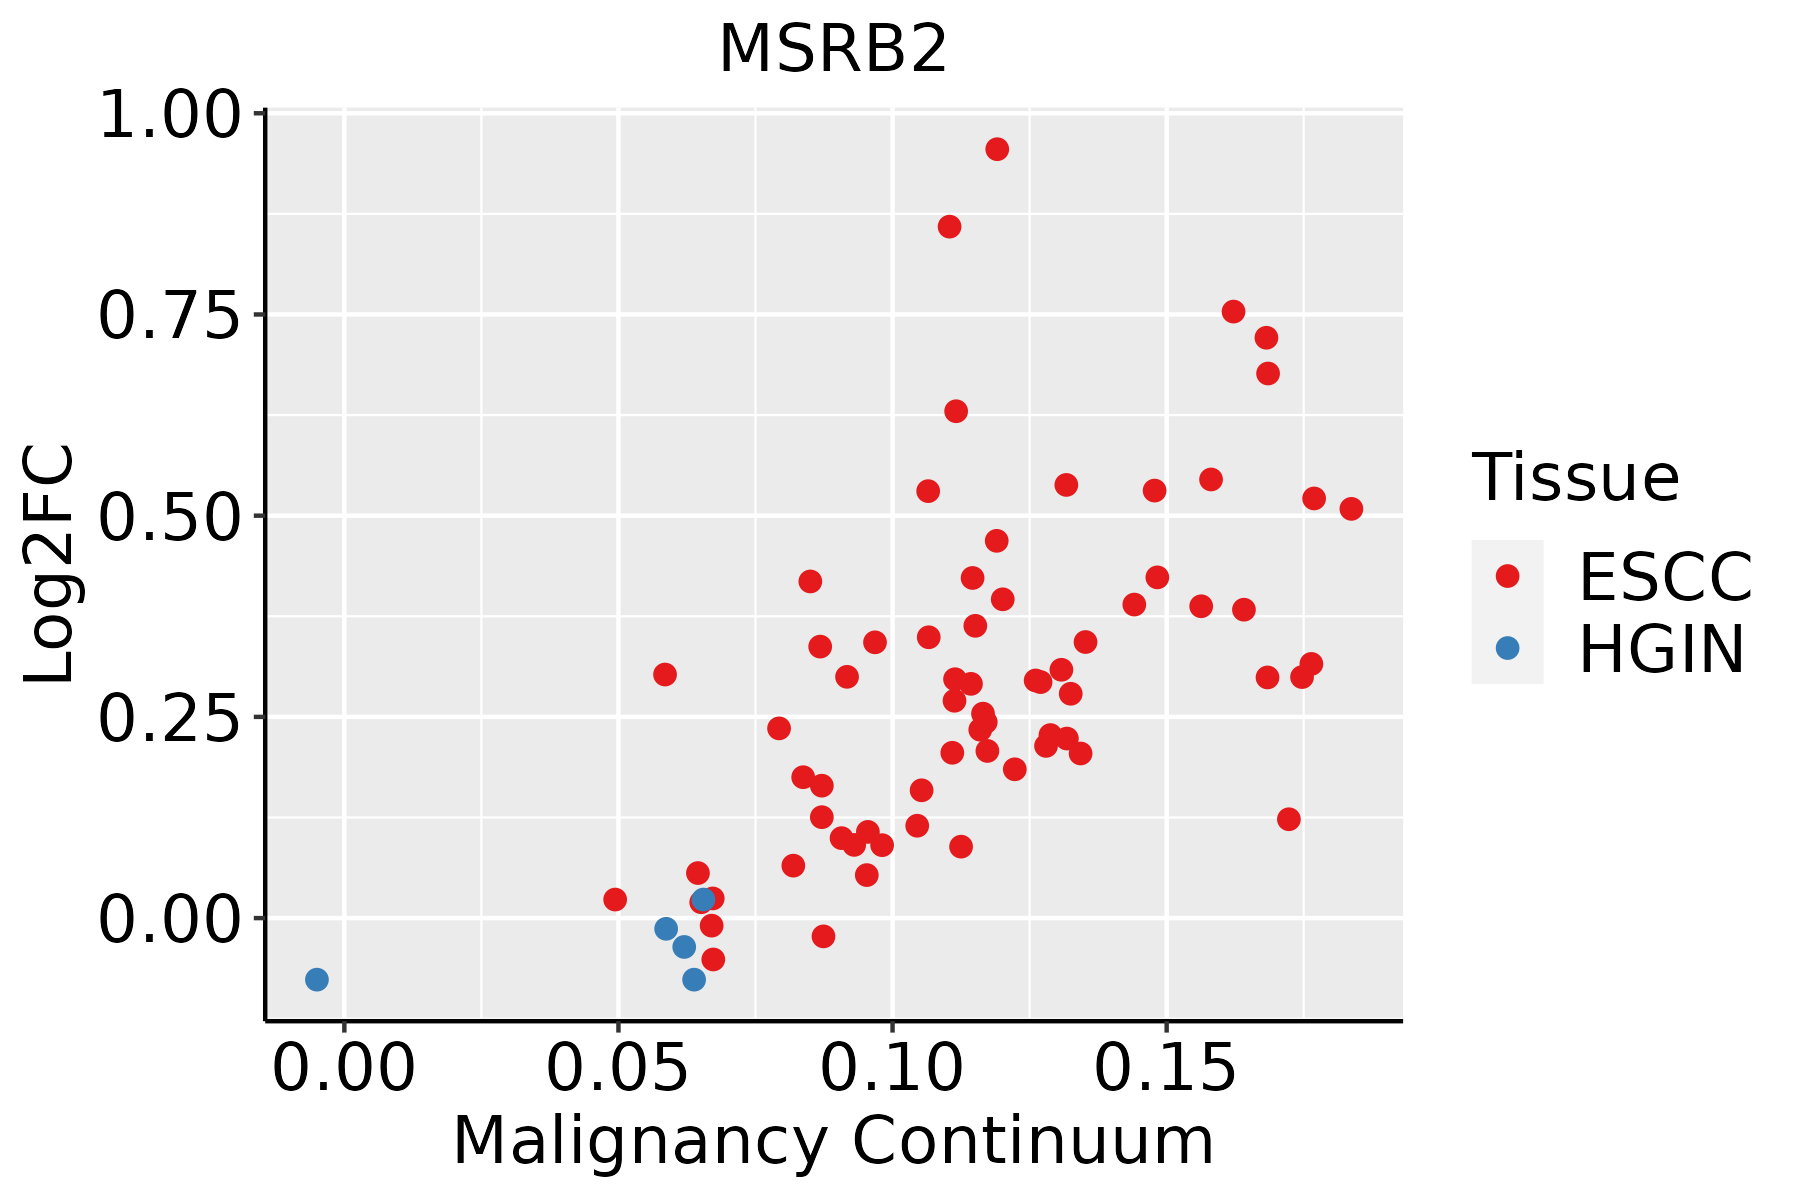
ESCC: Esophageal squamous cell carcinoma
HGIN: High-grade intraepithelial neoplasias
LGIN: Low-grade intraepithelial neoplasias
LiverThe image shows the transcriptomic changes along malignancy continuum.log2FC in expression of this searched gene in stem-like cells from each diseased tissue sample relative to stem-like cells in normal samples in each tissue plotted against the malignancy continuum. Samples are colored based on if they are from different disease stage.
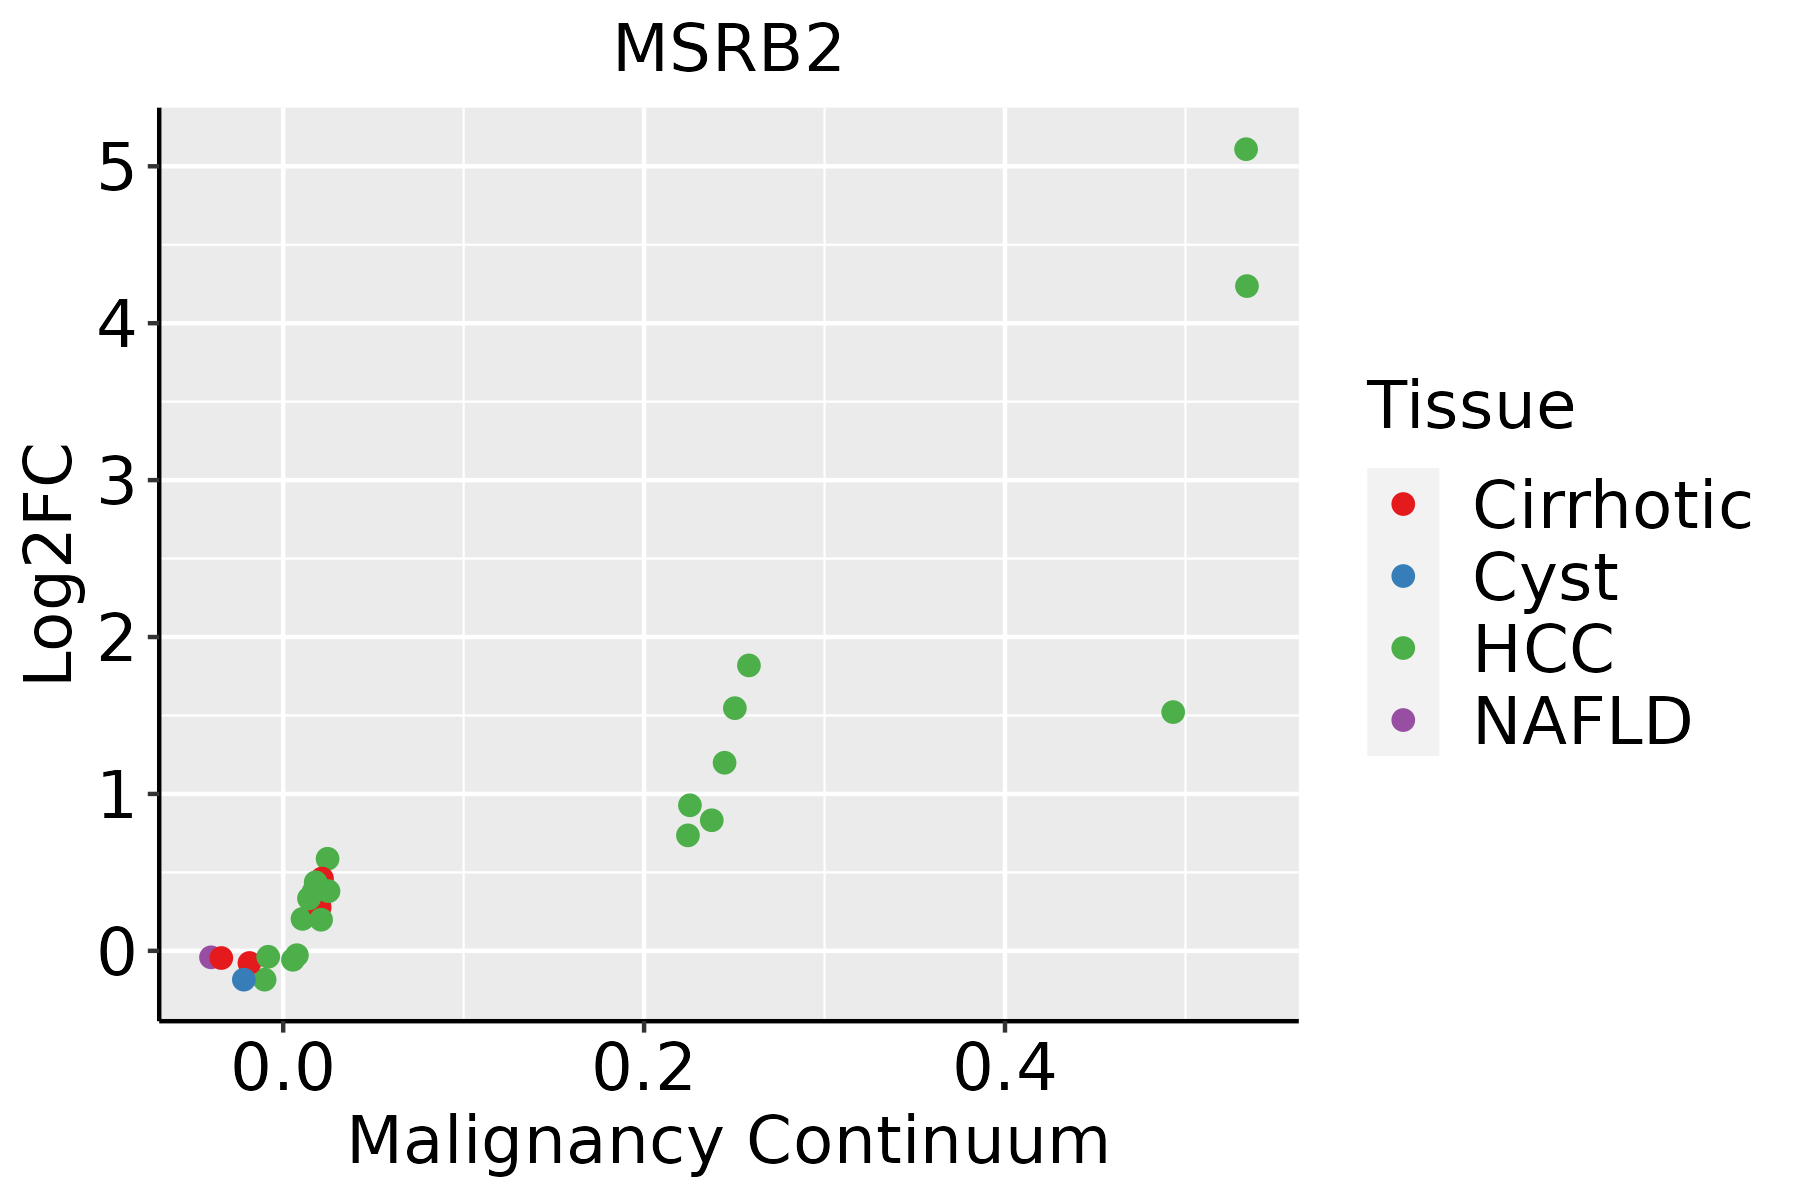
HCC: Hepatocellular carcinoma
NAFLD: Non-alcoholic fatty liver disease
Oral CavityThe image shows the transcriptomic changes along malignancy continuum.log2FC in expression of this searched gene in stem-like cells from each diseased tissue sample relative to stem-like cells in normal samples in each tissue plotted against the malignancy continuum. Samples are colored based on if they are from different disease stage.EOLP: Erosive Oral lichen planus
LP: leukoplakia
NEOLP: Non-erosive oral lichen planus
OSCC: Oral squamous cell carcinoma
ProstateThe image shows the transcriptomic changes along malignancy continuum.log2FC in expression of this searched gene in stem-like cells from each diseased tissue sample relative to stem-like cells in normal samples in each tissue plotted against the malignancy continuum. Samples are colored based on if they are from different disease stage.
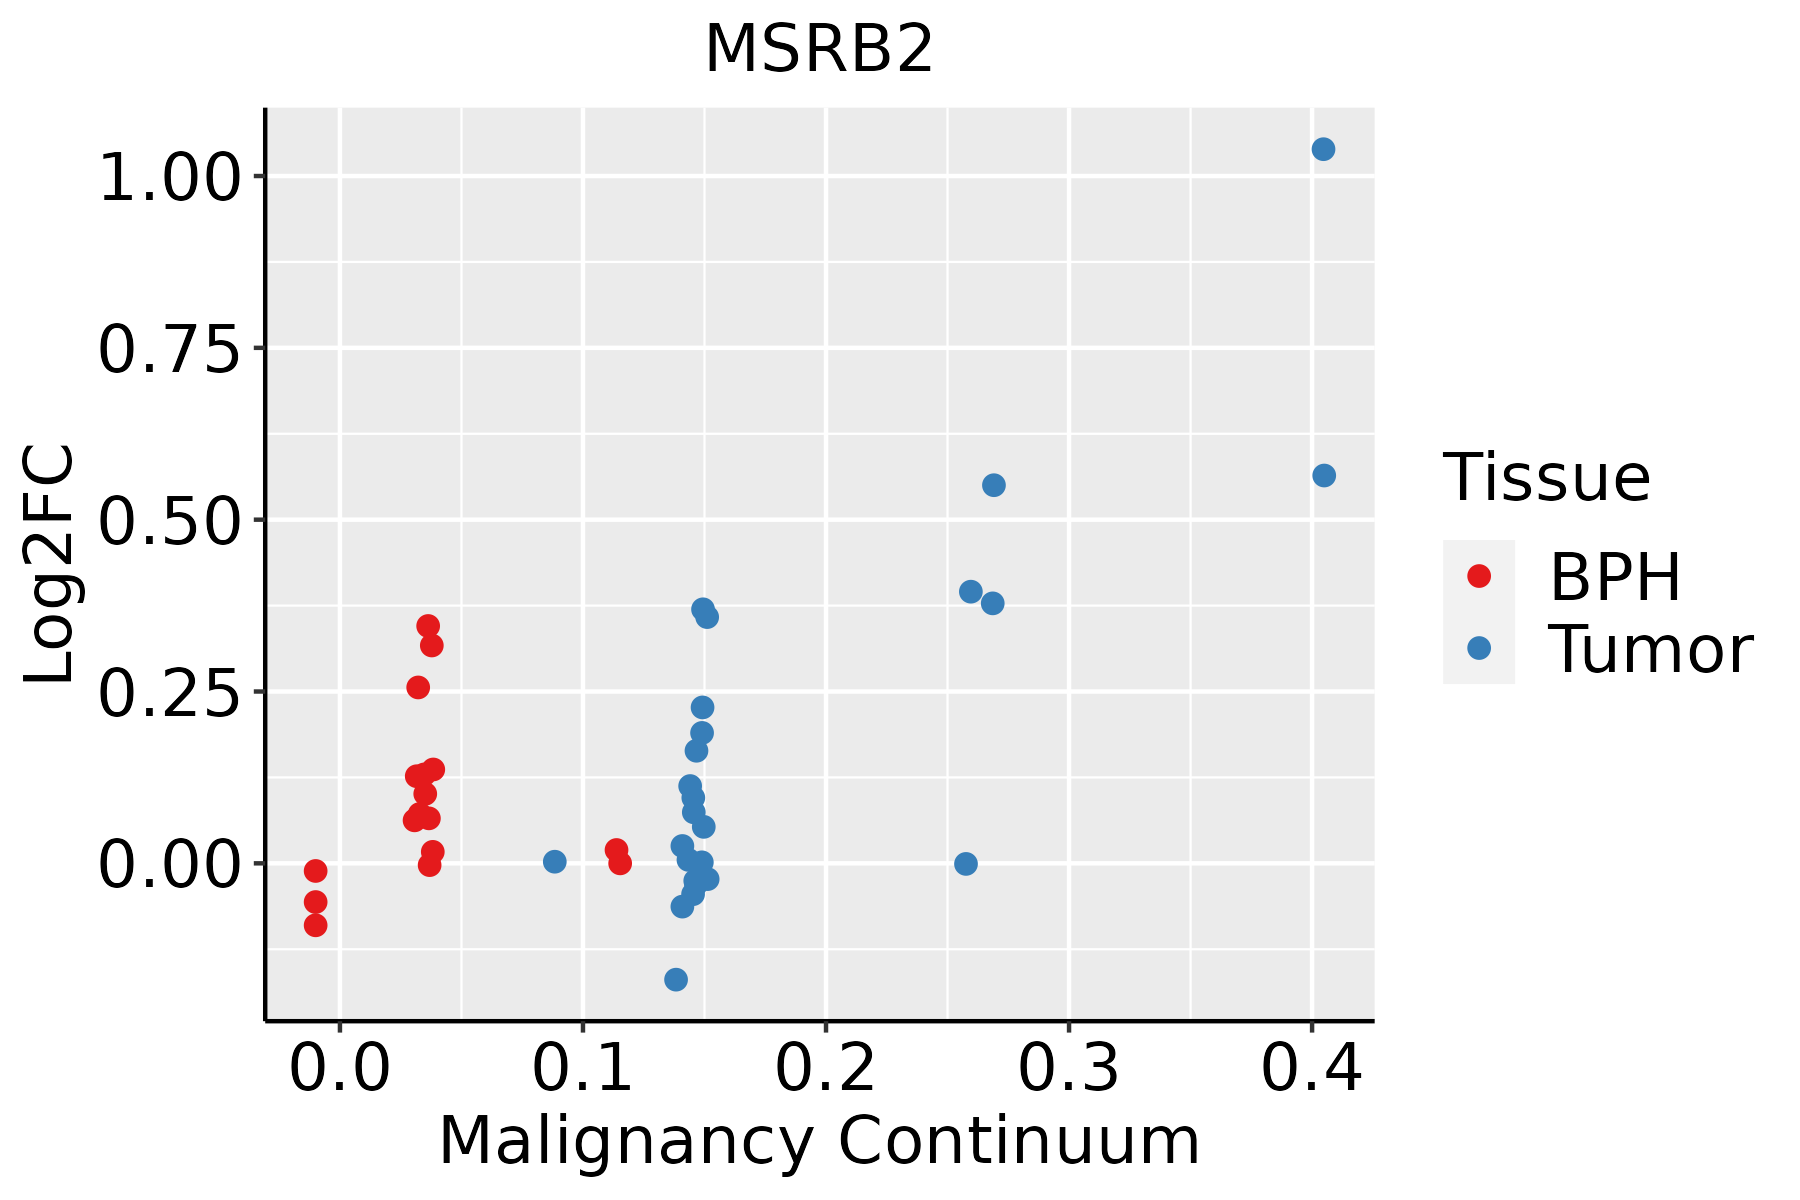
BPH: Benign Prostatic Hyperplasia
SkinThe image shows the transcriptomic changes along malignancy continuum.log2FC in expression of this searched gene in stem-like cells from each diseased tissue sample relative to stem-like cells in normal samples in each tissue plotted against the malignancy continuum. Samples are colored based on if they are from different disease stage.
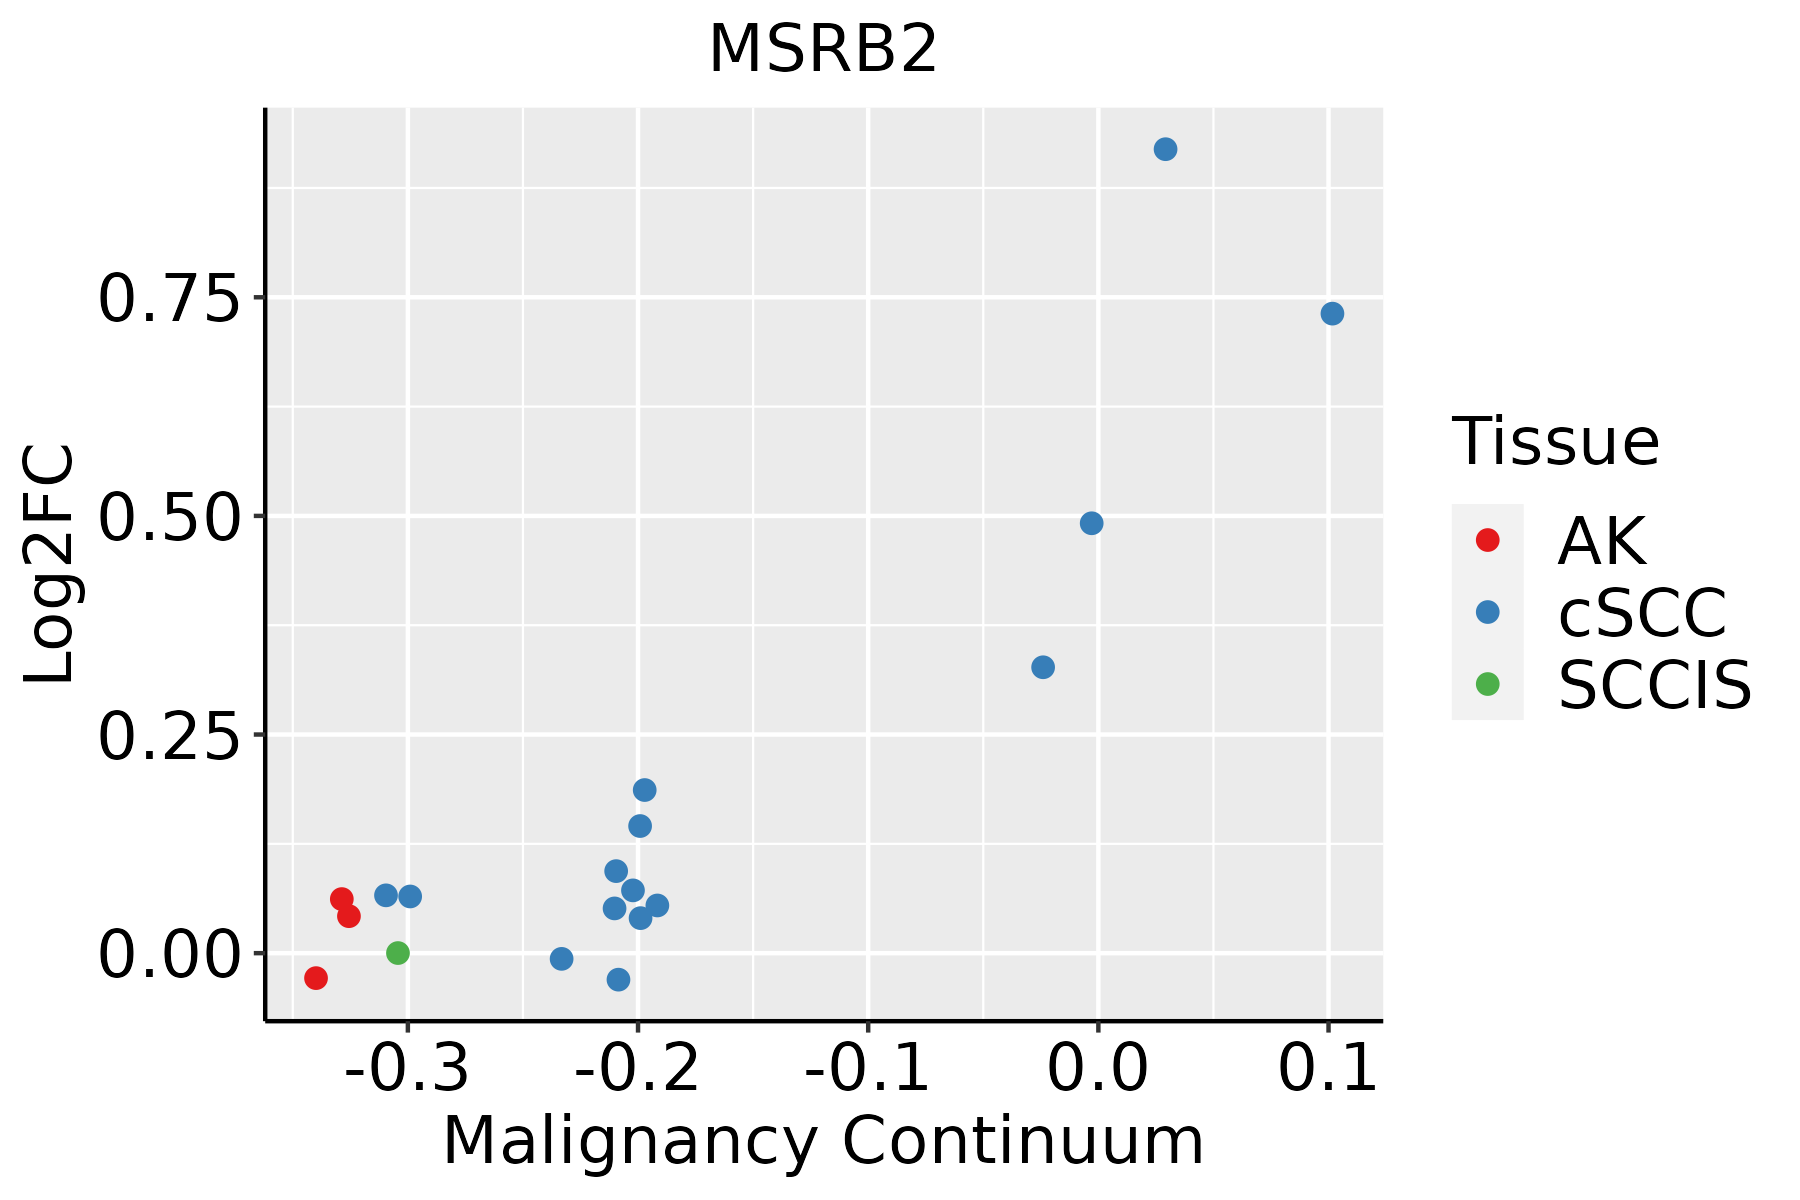
AK: Actinic keratosis
cSCC: Cutaneous squamous cell carcinoma
SCCIS:squamous cell carcinoma in situ
ThyroidThe image shows the transcriptomic changes along malignancy continuum.log2FC in expression of this searched gene in stem-like cells from each diseased tissue sample relative to stem-like cells in normal samples in each tissue plotted against the malignancy continuum. Samples are colored based on if they are from different disease stage.ATC: Anaplastic thyroid cancer
HT: Hashimoto's thyroiditis
PTC: Papillary thyroid cancer
∗log2FC in expression of this searched gene in stem-like cells from each diseased tissue sample relative to stem-like cells in normal samples in each tissue plotted against the malignancy continuum. Samples are colored based on if they are from different disease stage.

Top

Malignant transformation related pathway analysis

check buttonFind out the enriched GO biological processes and KEGG pathways involved in transition from healthy to precancer to cancer
check button Figure of enriched GO biological processes.
TissueDisease StageEnriched GO biological Processes
ColorectumADGO analysis - Figure of enriched GO biological processes: Top 15 enriched GO BP terms are showed in the bar plot of each disease state in each tissue. Each row represents a significant GO biological process which is colored according to the -log10(p.adjust).
ColorectumSERGO analysis - Figure of enriched GO biological processes: Top 15 enriched GO BP terms are showed in the bar plot of each disease state in each tissue. Each row represents a significant GO biological process which is colored according to the -log10(p.adjust).
ColorectumMSSGO analysis - Figure of enriched GO biological processes: Top 15 enriched GO BP terms are showed in the bar plot of each disease state in each tissue. Each row represents a significant GO biological process which is colored according to the -log10(p.adjust).
ColorectumMSI-HGO analysis - Figure of enriched GO biological processes: Top 15 enriched GO BP terms are showed in the bar plot of each disease state in each tissue. Each row represents a significant GO biological process which is colored according to the -log10(p.adjust).
ColorectumFAPGO analysis - Figure of enriched GO biological processes: Top 15 enriched GO BP terms are showed in the bar plot of each disease state in each tissue. Each row represents a significant GO biological process which is colored according to the -log10(p.adjust).
∗Top 15 enriched GO BP terms are showed in the bar plot of each disease state in each tissue. Each row represents a significant GO biological process which is colored according to the -log10(p.adjust).
Page: 1 2 3 4 5 6 7 8 9 

check button Enriched GO biological processes.
GO IDTissueDisease StageDescriptionGene RatioBg Ratiopvaluep.adjustCount
GO:0030041110EsophagusESCCactin filament polymerization114/8552191/187236.46e-054.92e-04114
GO:000697912LiverCirrhoticresponse to oxidative stress196/4634446/187232.80e-195.86e-17196
GO:000701512LiverCirrhoticactin filament organization171/4634442/187233.93e-112.30e-09171
GO:005125812LiverCirrhoticprotein polymerization116/4634297/187232.87e-089.78e-07116
GO:000815412LiverCirrhoticactin polymerization or depolymerization86/4634218/187231.04e-062.13e-0586
GO:003004112LiverCirrhoticactin filament polymerization77/4634191/187231.41e-062.79e-0577
GO:000697922LiverHCCresponse to oxidative stress281/7958446/187239.75e-191.24e-16281
GO:005125822LiverHCCprotein polymerization182/7958297/187234.17e-111.58e-09182
GO:000701522LiverHCCactin filament organization252/7958442/187233.83e-101.25e-08252
GO:000815422LiverHCCactin polymerization or depolymerization130/7958218/187232.31e-074.14e-06130
GO:003004122LiverHCCactin filament polymerization116/7958191/187232.66e-074.68e-06116
GO:000697920Oral cavityOSCCresponse to oxidative stress273/7305446/187238.35e-221.65e-19273
GO:005125820Oral cavityOSCCprotein polymerization169/7305297/187232.57e-107.17e-09169
GO:000701520Oral cavityOSCCactin filament organization230/7305442/187231.37e-082.77e-07230
GO:000815418Oral cavityOSCCactin polymerization or depolymerization117/7305218/187237.38e-068.04e-05117
GO:003004118Oral cavityOSCCactin filament polymerization103/7305191/187231.94e-051.87e-04103
GO:0006979110Oral cavityLPresponse to oxidative stress181/4623446/187235.74e-146.10e-12181
GO:0051258110Oral cavityLPprotein polymerization113/4623297/187231.90e-075.92e-06113
GO:0007015110Oral cavityLPactin filament organization143/4623442/187231.44e-041.65e-03143
GO:003004119Oral cavityLPactin filament polymerization69/4623191/187232.65e-042.75e-0369
Page: 1 2 3 4 

check button Enriched KEGG pathways.
Pathway IDTissueDisease StageDescriptionGene RatioBg Ratiopvaluep.adjustqvalueCount
Page: 1 

Top

Cell-cell communication analysis

check buttonIdentification of potential cell-cell interactions between two cell types and their ligand-receptor pairs for different disease states
LigandReceptorLRpairPathwayTissueDisease Stage
Page: 1 

Top

Single-cell gene regulatory network inference analysis

check buttonFind out the significant the regulons (TFs) and the target genes of each regulon across cell types for different disease states
TFCell TypeTissueDisease StageTarget GeneRSSRegulon Activity
∗The dot plots of a searched regulon are shown for all cell subpopulations in each disease state of each tissue based on the regulon specific score inferred using pySCENIC and by calculating the average expression.
Page: 1 

Top

Somatic mutation of malignant transformation related genes

check buttonAnnotation of somatic variants for genes involved in malignant transformation
Hugo SymbolVariant ClassVariant ClassificationdbSNP RSHGVScHGVSpHGVSp ShortSWISSPROTBIOTYPESIFTPolyPhenTumor Sample BarcodeTissueHistologySexAgeStageTherapy TypesDrugsOutcome
MSRB2deletionFrame_Shift_Delnovelc.350delAp.His117LeufsTer14p.H117Lfs*14Q9Y3D2protein_codingTCGA-EW-A2FV-01Breastbreast invasive carcinomaFemale<65III/IVChemotherapydocetaxelSD
MSRB2SNVMissense_Mutationc.168N>Tp.Lys56Asnp.K56NQ9Y3D2protein_codingdeleterious(0.03)possibly_damaging(0.573)TCGA-AG-A002-01Colorectumrectum adenocarcinomaMale<65I/IIUnknownUnknownSD
MSRB2SNVMissense_Mutationnovelc.400N>Ap.Asp134Asnp.D134NQ9Y3D2protein_codingdeleterious(0.01)probably_damaging(1)TCGA-A5-A0G1-01Endometriumuterine corpus endometrioid carcinomaFemale>=65I/IIUnknownUnknownSD
MSRB2SNVMissense_Mutationnovelc.280N>Ap.Asp94Asnp.D94NQ9Y3D2protein_codingtolerated(0.36)benign(0.423)TCGA-AP-A0LM-01Endometriumuterine corpus endometrioid carcinomaFemale<65III/IVChemotherapycisplatinSD
MSRB2SNVMissense_Mutationc.122N>Ap.Ser41Tyrp.S41YQ9Y3D2protein_codingdeleterious(0.03)benign(0.088)TCGA-AX-A05Z-01Endometriumuterine corpus endometrioid carcinomaFemale<65III/IVChemotherapyadriamycinSD
MSRB2SNVMissense_Mutationc.168N>Tp.Lys56Asnp.K56NQ9Y3D2protein_codingdeleterious(0.03)possibly_damaging(0.573)TCGA-B5-A0JY-01Endometriumuterine corpus endometrioid carcinomaFemale<65III/IVChemotherapydoxorubicinSD
MSRB2SNVMissense_Mutationc.168N>Tp.Lys56Asnp.K56NQ9Y3D2protein_codingdeleterious(0.03)possibly_damaging(0.573)TCGA-D1-A17Q-01Endometriumuterine corpus endometrioid carcinomaFemale<65I/IIUnknownUnknownSD
MSRB2SNVMissense_Mutationnovelc.274T>Cp.Cys92Argp.C92RQ9Y3D2protein_codingdeleterious(0)probably_damaging(0.959)TCGA-DI-A1BU-01Endometriumuterine corpus endometrioid carcinomaFemale<65I/IIChemotherapypaclitaxelSD
MSRB2SNVMissense_Mutationnovelc.335C>Tp.Ser112Leup.S112LQ9Y3D2protein_codingdeleterious(0.01)probably_damaging(0.969)TCGA-EO-A22R-01Endometriumuterine corpus endometrioid carcinomaFemale<65I/IIUnknownUnknownSD
MSRB2SNVMissense_Mutationc.122N>Ap.Ser41Tyrp.S41YQ9Y3D2protein_codingdeleterious(0.03)benign(0.088)TCGA-EO-A22U-01Endometriumuterine corpus endometrioid carcinomaFemale>=65I/IIUnknownUnknownSD
Page: 1 2 3 

Top

Related drugs of malignant transformation related genes

check buttonIdentification of chemicals and drugs interact with genes involved in malignant transfromation
(DGIdb 4.0)
Entrez IDSymbolCategoryInteraction TypesDrug Claim NameDrug NamePMIDs
Page: 1