
|
|||||
|
 | |
| |
| |
| |
| |
| |
|
Gene: MSL2 |
Gene summary for MSL2 |
| Gene information | Species | Human | Gene symbol | MSL2 | Gene ID | 55167 |
| Gene name | MSL complex subunit 2 | |
| Gene Alias | MSL-2 | |
| Cytomap | 3q22.3 | |
| Gene Type | protein-coding | GO ID | GO:0006464 | UniProtAcc | Q9HCI7 |
Top |
Malignant transformation analysis |
| Identification of the aberrant gene expression in precancerous and cancerous lesions by comparing the gene expression of stem-like cells in diseased tissues with normal stem cells |
| Entrez ID | Symbol | Replicates | Species | Organ | Tissue | Adj P-value | Log2FC | Malignancy |
| 55167 | MSL2 | CCI_1 | Human | Cervix | CC | 7.63e-05 | 6.89e-01 | 0.528 |
| 55167 | MSL2 | CCI_2 | Human | Cervix | CC | 1.78e-15 | 1.18e+00 | 0.5249 |
| 55167 | MSL2 | CCI_3 | Human | Cervix | CC | 4.98e-17 | 8.79e-01 | 0.516 |
| 55167 | MSL2 | C21 | Human | Oral cavity | OSCC | 2.47e-05 | 2.74e-01 | 0.2678 |
| 55167 | MSL2 | C30 | Human | Oral cavity | OSCC | 5.66e-06 | 3.65e-01 | 0.3055 |
| 55167 | MSL2 | C38 | Human | Oral cavity | OSCC | 7.70e-07 | 6.16e-01 | 0.172 |
| 55167 | MSL2 | C43 | Human | Oral cavity | OSCC | 3.93e-06 | 8.60e-02 | 0.1704 |
| 55167 | MSL2 | C46 | Human | Oral cavity | OSCC | 8.55e-03 | 1.76e-01 | 0.1673 |
| 55167 | MSL2 | C06 | Human | Oral cavity | OSCC | 1.05e-06 | 9.50e-01 | 0.2699 |
| 55167 | MSL2 | C08 | Human | Oral cavity | OSCC | 2.59e-11 | 2.36e-01 | 0.1919 |
| 55167 | MSL2 | LN22 | Human | Oral cavity | OSCC | 1.99e-02 | 4.95e-01 | 0.1733 |
| 55167 | MSL2 | LP15 | Human | Oral cavity | LP | 4.33e-08 | 7.68e-01 | 0.2174 |
| 55167 | MSL2 | EOLP-1 | Human | Oral cavity | EOLP | 1.74e-08 | 2.09e-01 | -0.0202 |
| 55167 | MSL2 | NEOLP-3 | Human | Oral cavity | NEOLP | 3.91e-03 | 1.23e-01 | -0.0191 |
| 55167 | MSL2 | SYSMH1 | Human | Oral cavity | OSCC | 2.36e-03 | 7.26e-02 | 0.1127 |
| 55167 | MSL2 | SYSMH2 | Human | Oral cavity | OSCC | 1.20e-05 | 1.19e-01 | 0.2326 |
| 55167 | MSL2 | SYSMH3 | Human | Oral cavity | OSCC | 5.04e-06 | 1.37e-01 | 0.2442 |
| Page: 1 |
| Tissue | Expression Dynamics | Abbreviation |
| Cervix | 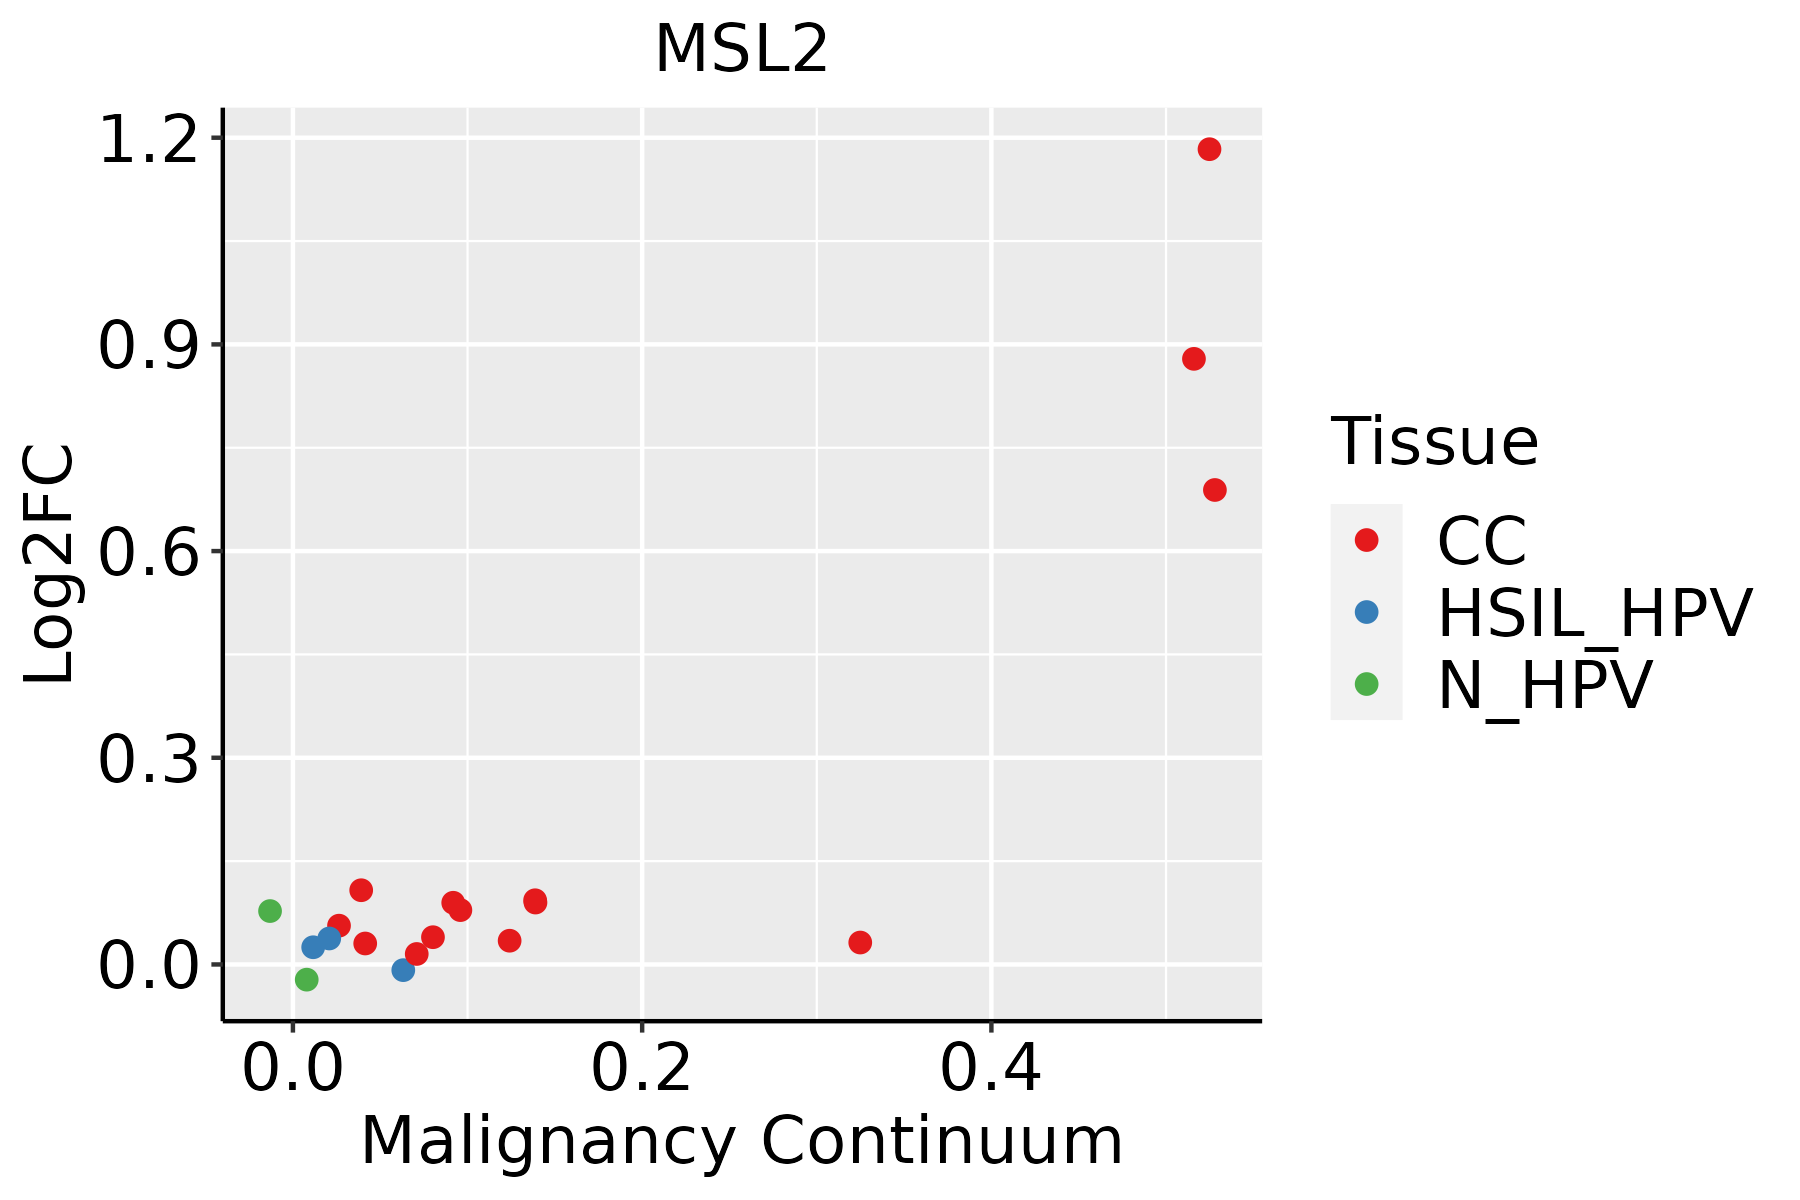 | CC: Cervix cancer |
| HSIL_HPV: HPV-infected high-grade squamous intraepithelial lesions | ||
| N_HPV: HPV-infected normal cervix | ||
| Oral Cavity |  | EOLP: Erosive Oral lichen planus |
| LP: leukoplakia | ||
| NEOLP: Non-erosive oral lichen planus | ||
| OSCC: Oral squamous cell carcinoma |
| ∗log2FC in expression of this searched gene in stem-like cells from each diseased tissue sample relative to stem-like cells in normal samples in each tissue plotted against the malignancy continuum. Samples are colored based on if they are from different disease stage. |
Top |
Malignant transformation related pathway analysis |
| Find out the enriched GO biological processes and KEGG pathways involved in transition from healthy to precancer to cancer |
| Tissue | Disease Stage | Enriched GO biological Processes |
| Colorectum | AD |  |
| Colorectum | SER |  |
| Colorectum | MSS |  |
| Colorectum | MSI-H |  |
| Colorectum | FAP |  |
| ∗Top 15 enriched GO BP terms are showed in the bar plot of each disease state in each tissue. Each row represents a significant GO biological process which is colored according to the -log10(p.adjust). |
| Page: 1 2 3 4 5 6 7 8 9 |
| GO ID | Tissue | Disease Stage | Description | Gene Ratio | Bg Ratio | pvalue | p.adjust | Count |
| GO:004396711 | Oral cavity | LP | histone H4 acetylation | 31/4623 | 67/18723 | 9.80e-05 | 1.22e-03 | 31 |
| GO:001657023 | Oral cavity | EOLP | histone modification | 98/2218 | 463/18723 | 5.58e-09 | 2.96e-07 | 98 |
| GO:001820521 | Oral cavity | EOLP | peptidyl-lysine modification | 72/2218 | 376/18723 | 2.38e-05 | 3.56e-04 | 72 |
| GO:004354321 | Oral cavity | EOLP | protein acylation | 51/2218 | 243/18723 | 3.11e-05 | 4.41e-04 | 51 |
| GO:000647321 | Oral cavity | EOLP | protein acetylation | 44/2218 | 201/18723 | 3.69e-05 | 5.12e-04 | 44 |
| GO:001839421 | Oral cavity | EOLP | peptidyl-lysine acetylation | 37/2218 | 169/18723 | 1.48e-04 | 1.58e-03 | 37 |
| GO:001839321 | Oral cavity | EOLP | internal peptidyl-lysine acetylation | 34/2218 | 158/18723 | 3.76e-04 | 3.40e-03 | 34 |
| GO:001657321 | Oral cavity | EOLP | histone acetylation | 33/2218 | 152/18723 | 3.85e-04 | 3.46e-03 | 33 |
| GO:000647521 | Oral cavity | EOLP | internal protein amino acid acetylation | 34/2218 | 160/18723 | 4.79e-04 | 4.19e-03 | 34 |
| GO:00439672 | Oral cavity | EOLP | histone H4 acetylation | 18/2218 | 67/18723 | 6.02e-04 | 5.04e-03 | 18 |
| GO:00439841 | Oral cavity | EOLP | histone H4-K16 acetylation | 8/2218 | 20/18723 | 1.29e-03 | 9.17e-03 | 8 |
| GO:001657031 | Oral cavity | NEOLP | histone modification | 88/2005 | 463/18723 | 5.59e-08 | 2.23e-06 | 88 |
| GO:001820531 | Oral cavity | NEOLP | peptidyl-lysine modification | 64/2005 | 376/18723 | 1.21e-04 | 1.43e-03 | 64 |
| GO:00439842 | Oral cavity | NEOLP | histone H4-K16 acetylation | 7/2005 | 20/18723 | 3.51e-03 | 2.06e-02 | 7 |
| GO:004354331 | Oral cavity | NEOLP | protein acylation | 40/2005 | 243/18723 | 3.85e-03 | 2.21e-02 | 40 |
| GO:000647331 | Oral cavity | NEOLP | protein acetylation | 34/2005 | 201/18723 | 4.76e-03 | 2.61e-02 | 34 |
| GO:001839431 | Oral cavity | NEOLP | peptidyl-lysine acetylation | 29/2005 | 169/18723 | 7.09e-03 | 3.60e-02 | 29 |
| GO:001839331 | Oral cavity | NEOLP | internal peptidyl-lysine acetylation | 27/2005 | 158/18723 | 9.64e-03 | 4.54e-02 | 27 |
| GO:00439673 | Oral cavity | NEOLP | histone H4 acetylation | 14/2005 | 67/18723 | 1.04e-02 | 4.87e-02 | 14 |
| GO:001657331 | Oral cavity | NEOLP | histone acetylation | 26/2005 | 152/18723 | 1.08e-02 | 4.99e-02 | 26 |
| Page: 1 2 |
| Pathway ID | Tissue | Disease Stage | Description | Gene Ratio | Bg Ratio | pvalue | p.adjust | qvalue | Count |
| Page: 1 |
Top |
Cell-cell communication analysis |
| Identification of potential cell-cell interactions between two cell types and their ligand-receptor pairs for different disease states |
| Ligand | Receptor | LRpair | Pathway | Tissue | Disease Stage |
| Page: 1 |
Top |
Single-cell gene regulatory network inference analysis |
| Find out the significant the regulons (TFs) and the target genes of each regulon across cell types for different disease states |
| TF | Cell Type | Tissue | Disease Stage | Target Gene | RSS | Regulon Activity |
| ∗The dot plots of a searched regulon are shown for all cell subpopulations in each disease state of each tissue based on the regulon specific score inferred using pySCENIC and by calculating the average expression. |
| Page: 1 |
Top |
Somatic mutation of malignant transformation related genes |
| Annotation of somatic variants for genes involved in malignant transformation |
| Hugo Symbol | Variant Class | Variant Classification | dbSNP RS | HGVSc | HGVSp | HGVSp Short | SWISSPROT | BIOTYPE | SIFT | PolyPhen | Tumor Sample Barcode | Tissue | Histology | Sex | Age | Stage | Therapy Types | Drugs | Outcome |
| MSL2 | SNV | Missense_Mutation | novel | c.1273C>A | p.Pro425Thr | p.P425T | Q9HCI7 | protein_coding | tolerated(1) | benign(0) | TCGA-A2-A0CQ-01 | Breast | breast invasive carcinoma | Female | <65 | I/II | Chemotherapy | adriamycin | SD |
| MSL2 | SNV | Missense_Mutation | c.1603N>A | p.Ala535Thr | p.A535T | Q9HCI7 | protein_coding | deleterious(0.01) | possibly_damaging(0.7) | TCGA-AC-A23H-01 | Breast | breast invasive carcinoma | Female | >=65 | I/II | Unknown | Unknown | PD | |
| MSL2 | SNV | Missense_Mutation | c.524C>T | p.Ser175Phe | p.S175F | Q9HCI7 | protein_coding | deleterious(0.02) | possibly_damaging(0.555) | TCGA-C8-A12T-01 | Breast | breast invasive carcinoma | Female | <65 | I/II | Unknown | Unknown | SD | |
| MSL2 | SNV | Missense_Mutation | c.949A>G | p.Met317Val | p.M317V | Q9HCI7 | protein_coding | tolerated(0.41) | benign(0) | TCGA-C8-A12Y-01 | Breast | breast invasive carcinoma | Female | <65 | I/II | Unknown | Unknown | SD | |
| MSL2 | insertion | Nonsense_Mutation | novel | c.1271_1272insTTCTGAAGGTAATTAAATTTAGACTATGTAGTATGT | p.Lys424delinsAsnSerGluGlyAsnTerIleTerThrMetTerTyrVal | p.K424delinsNSEGN*I*TM*YV | Q9HCI7 | protein_coding | TCGA-A2-A0CQ-01 | Breast | breast invasive carcinoma | Female | <65 | I/II | Chemotherapy | adriamycin | SD | ||
| MSL2 | insertion | Nonsense_Mutation | novel | c.260_261insCAACTACAGTAAATAACAGCTTTCTTTTATAGCTGTAT | p.Glu88AsnfsTer5 | p.E88Nfs*5 | Q9HCI7 | protein_coding | TCGA-B6-A0IN-01 | Breast | breast invasive carcinoma | Female | <65 | I/II | Unknown | Unknown | PD | ||
| MSL2 | SNV | Missense_Mutation | novel | c.273G>T | p.Glu91Asp | p.E91D | Q9HCI7 | protein_coding | deleterious(0.05) | benign(0.075) | TCGA-2W-A8YY-01 | Cervix | cervical & endocervical cancer | Female | <65 | I/II | Chemotherapy | cisplatin | CR |
| MSL2 | SNV | Missense_Mutation | novel | c.1405N>G | p.Gln469Glu | p.Q469E | Q9HCI7 | protein_coding | deleterious(0.01) | possibly_damaging(0.888) | TCGA-JW-A5VL-01 | Cervix | cervical & endocervical cancer | Female | <65 | I/II | Unknown | Unknown | SD |
| MSL2 | SNV | Missense_Mutation | novel | c.1085N>A | p.Arg362Gln | p.R362Q | Q9HCI7 | protein_coding | tolerated(0.53) | benign(0) | TCGA-VS-A9U7-01 | Cervix | cervical & endocervical cancer | Female | <65 | I/II | Chemotherapy | cisplatin | CR |
| MSL2 | SNV | Missense_Mutation | c.1316C>A | p.Pro439His | p.P439H | Q9HCI7 | protein_coding | tolerated(0.25) | possibly_damaging(0.534) | TCGA-AA-3672-01 | Colorectum | colon adenocarcinoma | Female | >=65 | III/IV | Unknown | Unknown | SD |
| Page: 1 2 3 4 5 6 7 8 |
Top |
Related drugs of malignant transformation related genes |
| Identification of chemicals and drugs interact with genes involved in malignant transfromation |
| (DGIdb 4.0) |
| Entrez ID | Symbol | Category | Interaction Types | Drug Claim Name | Drug Name | PMIDs |
| Page: 1 |

Copyright 2023-Present -The University of Texas Health Science Center at Houston |