
|
|||||
|
 | |
| |
| |
| |
| |
| |
|
Gene: MSH3 |
Gene summary for MSH3 |
| Gene information | Species | Human | Gene symbol | MSH3 | Gene ID | 4437 |
| Gene name | mutS homolog 3 | |
| Gene Alias | DUP | |
| Cytomap | 5q14.1 | |
| Gene Type | protein-coding | GO ID | GO:0000003 | UniProtAcc | P20585 |
Top |
Malignant transformation analysis |
| Identification of the aberrant gene expression in precancerous and cancerous lesions by comparing the gene expression of stem-like cells in diseased tissues with normal stem cells |
| Entrez ID | Symbol | Replicates | Species | Organ | Tissue | Adj P-value | Log2FC | Malignancy |
| 4437 | MSH3 | CA_HPV_1 | Human | Cervix | CC | 1.02e-03 | -1.50e-01 | 0.0264 |
| 4437 | MSH3 | CCI_2 | Human | Cervix | CC | 1.15e-02 | 7.22e-01 | 0.5249 |
| 4437 | MSH3 | Tumor | Human | Cervix | CC | 1.23e-02 | -1.99e-01 | 0.1241 |
| 4437 | MSH3 | LZE5T | Human | Esophagus | ESCC | 8.28e-03 | 2.21e-01 | 0.0514 |
| 4437 | MSH3 | LZE24T | Human | Esophagus | ESCC | 1.17e-16 | 3.56e-01 | 0.0596 |
| 4437 | MSH3 | P1T-E | Human | Esophagus | ESCC | 9.68e-11 | 5.11e-01 | 0.0875 |
| 4437 | MSH3 | P2T-E | Human | Esophagus | ESCC | 4.07e-25 | 4.34e-01 | 0.1177 |
| 4437 | MSH3 | P4T-E | Human | Esophagus | ESCC | 5.27e-12 | 3.45e-01 | 0.1323 |
| 4437 | MSH3 | P5T-E | Human | Esophagus | ESCC | 6.07e-14 | 1.35e-01 | 0.1327 |
| 4437 | MSH3 | P8T-E | Human | Esophagus | ESCC | 2.91e-12 | 1.73e-01 | 0.0889 |
| 4437 | MSH3 | P9T-E | Human | Esophagus | ESCC | 3.08e-04 | 1.56e-01 | 0.1131 |
| 4437 | MSH3 | P10T-E | Human | Esophagus | ESCC | 3.64e-12 | 2.23e-01 | 0.116 |
| 4437 | MSH3 | P11T-E | Human | Esophagus | ESCC | 3.94e-05 | 1.92e-01 | 0.1426 |
| 4437 | MSH3 | P12T-E | Human | Esophagus | ESCC | 2.02e-16 | 2.67e-01 | 0.1122 |
| 4437 | MSH3 | P15T-E | Human | Esophagus | ESCC | 2.15e-10 | 2.25e-01 | 0.1149 |
| 4437 | MSH3 | P16T-E | Human | Esophagus | ESCC | 6.89e-23 | 2.81e-01 | 0.1153 |
| 4437 | MSH3 | P17T-E | Human | Esophagus | ESCC | 1.13e-07 | 2.25e-01 | 0.1278 |
| 4437 | MSH3 | P19T-E | Human | Esophagus | ESCC | 2.08e-06 | 2.86e-01 | 0.1662 |
| 4437 | MSH3 | P20T-E | Human | Esophagus | ESCC | 7.73e-17 | 2.88e-01 | 0.1124 |
| 4437 | MSH3 | P21T-E | Human | Esophagus | ESCC | 2.52e-12 | 2.40e-01 | 0.1617 |
| Page: 1 2 3 4 5 6 |
| Tissue | Expression Dynamics | Abbreviation |
| Cervix | 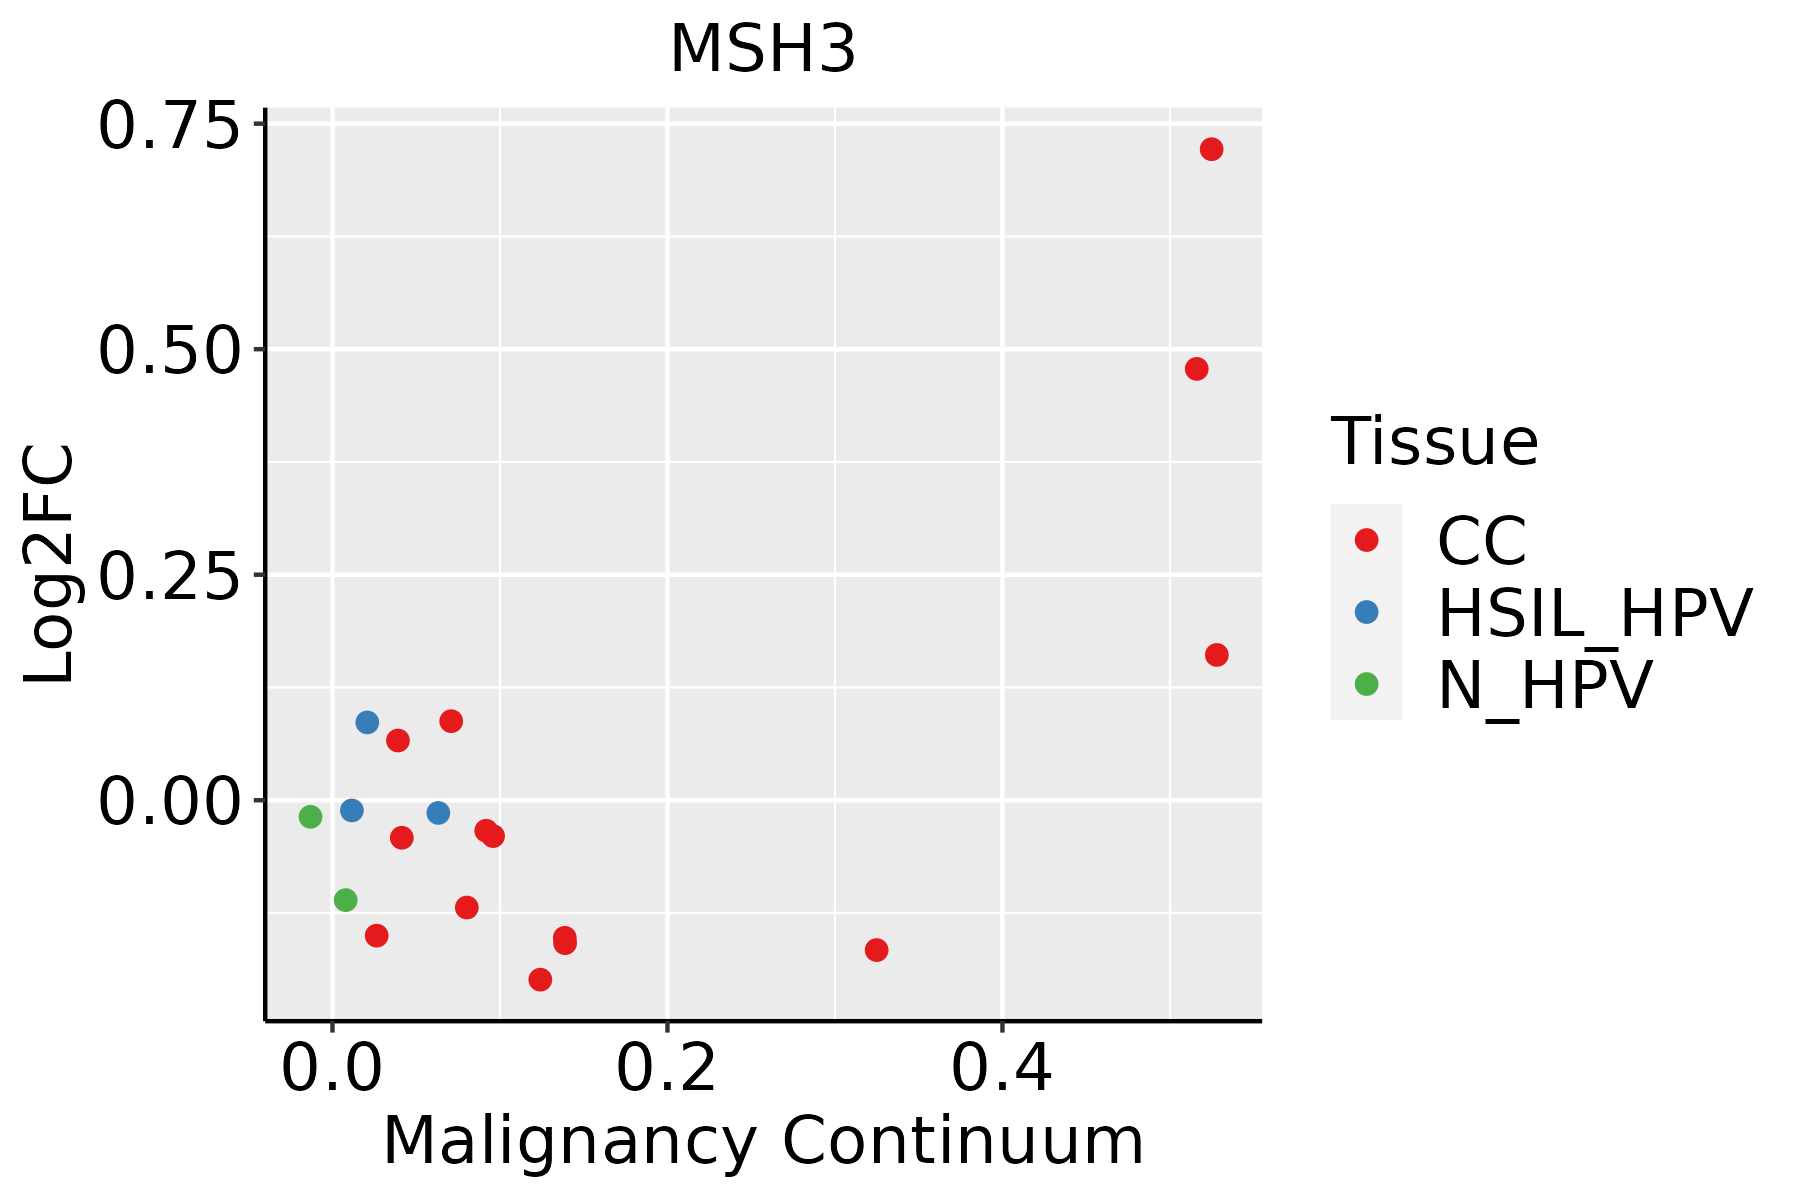 | CC: Cervix cancer |
| HSIL_HPV: HPV-infected high-grade squamous intraepithelial lesions | ||
| N_HPV: HPV-infected normal cervix | ||
| Esophagus |  | ESCC: Esophageal squamous cell carcinoma |
| HGIN: High-grade intraepithelial neoplasias | ||
| LGIN: Low-grade intraepithelial neoplasias | ||
| Liver | 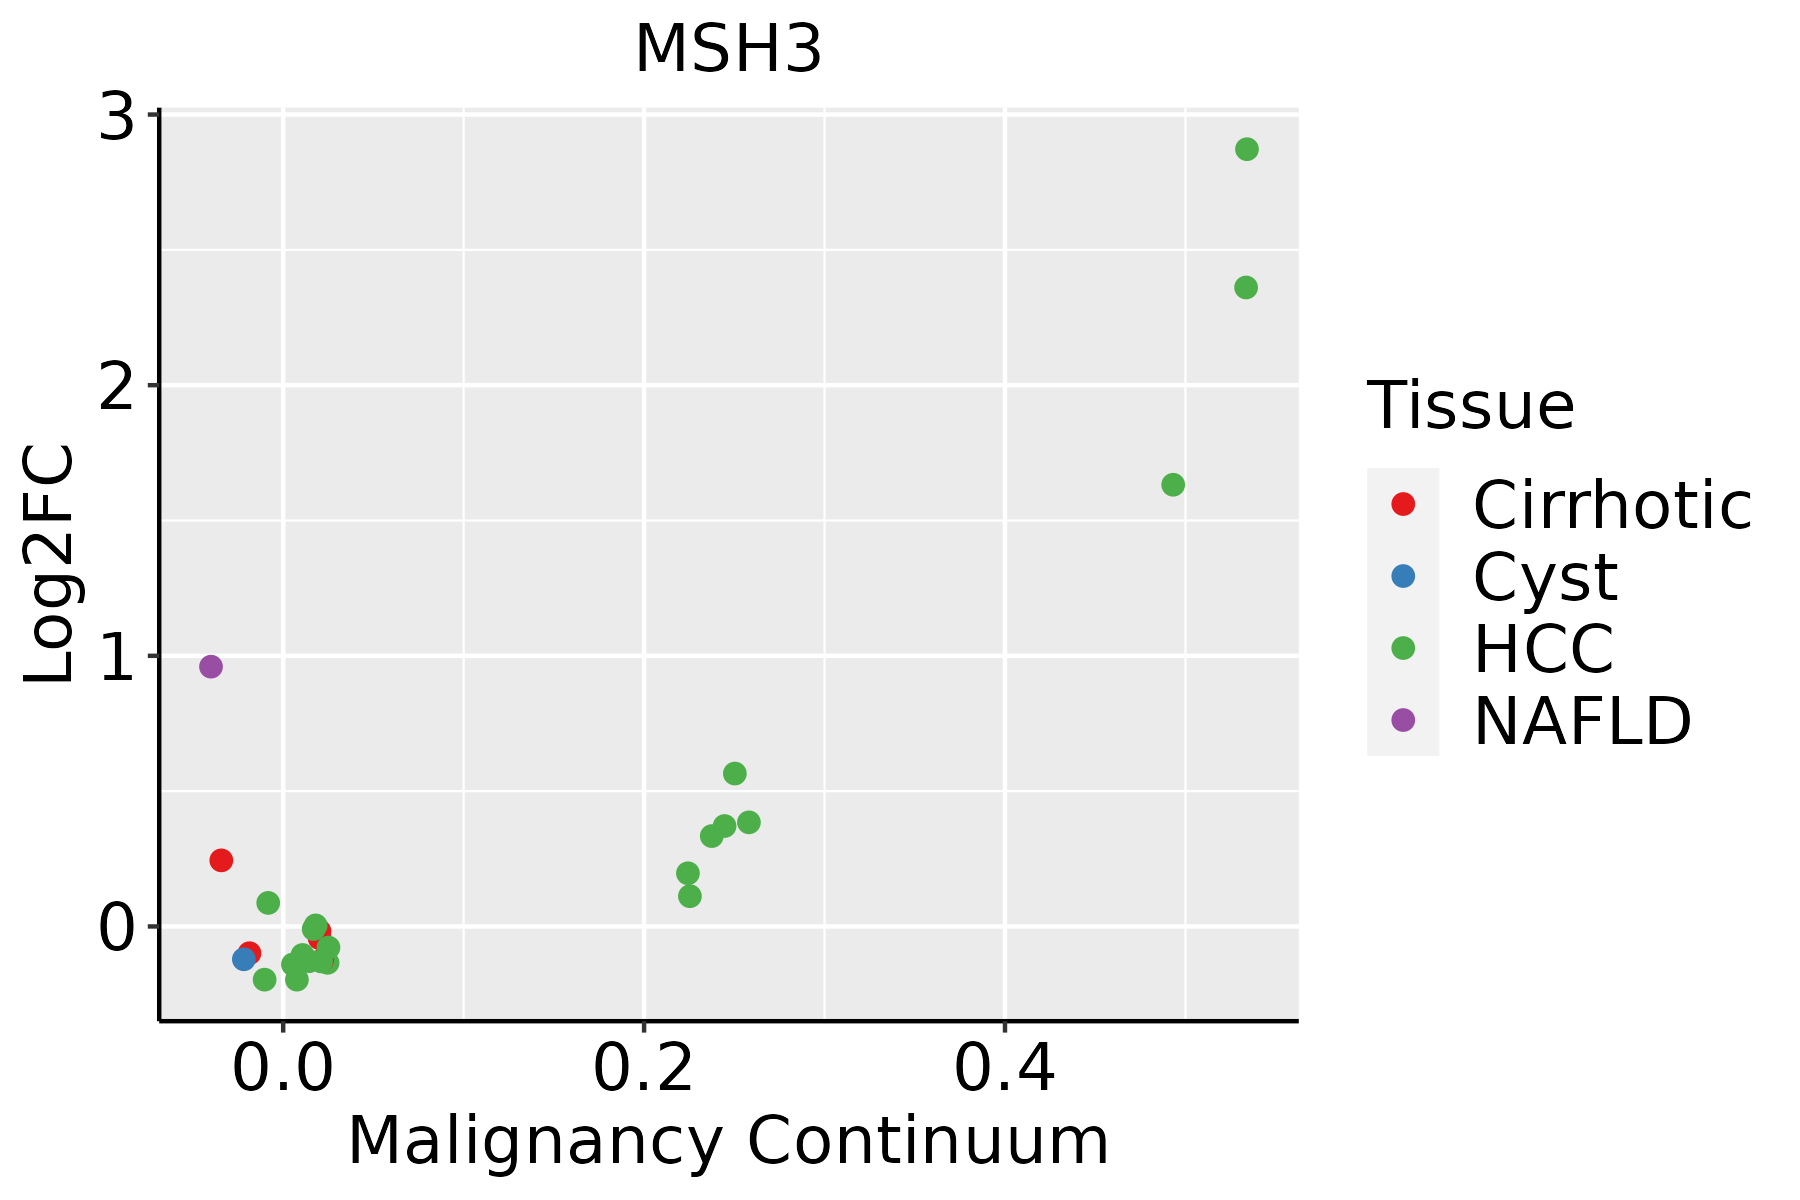 | HCC: Hepatocellular carcinoma |
| NAFLD: Non-alcoholic fatty liver disease | ||
| Lung | 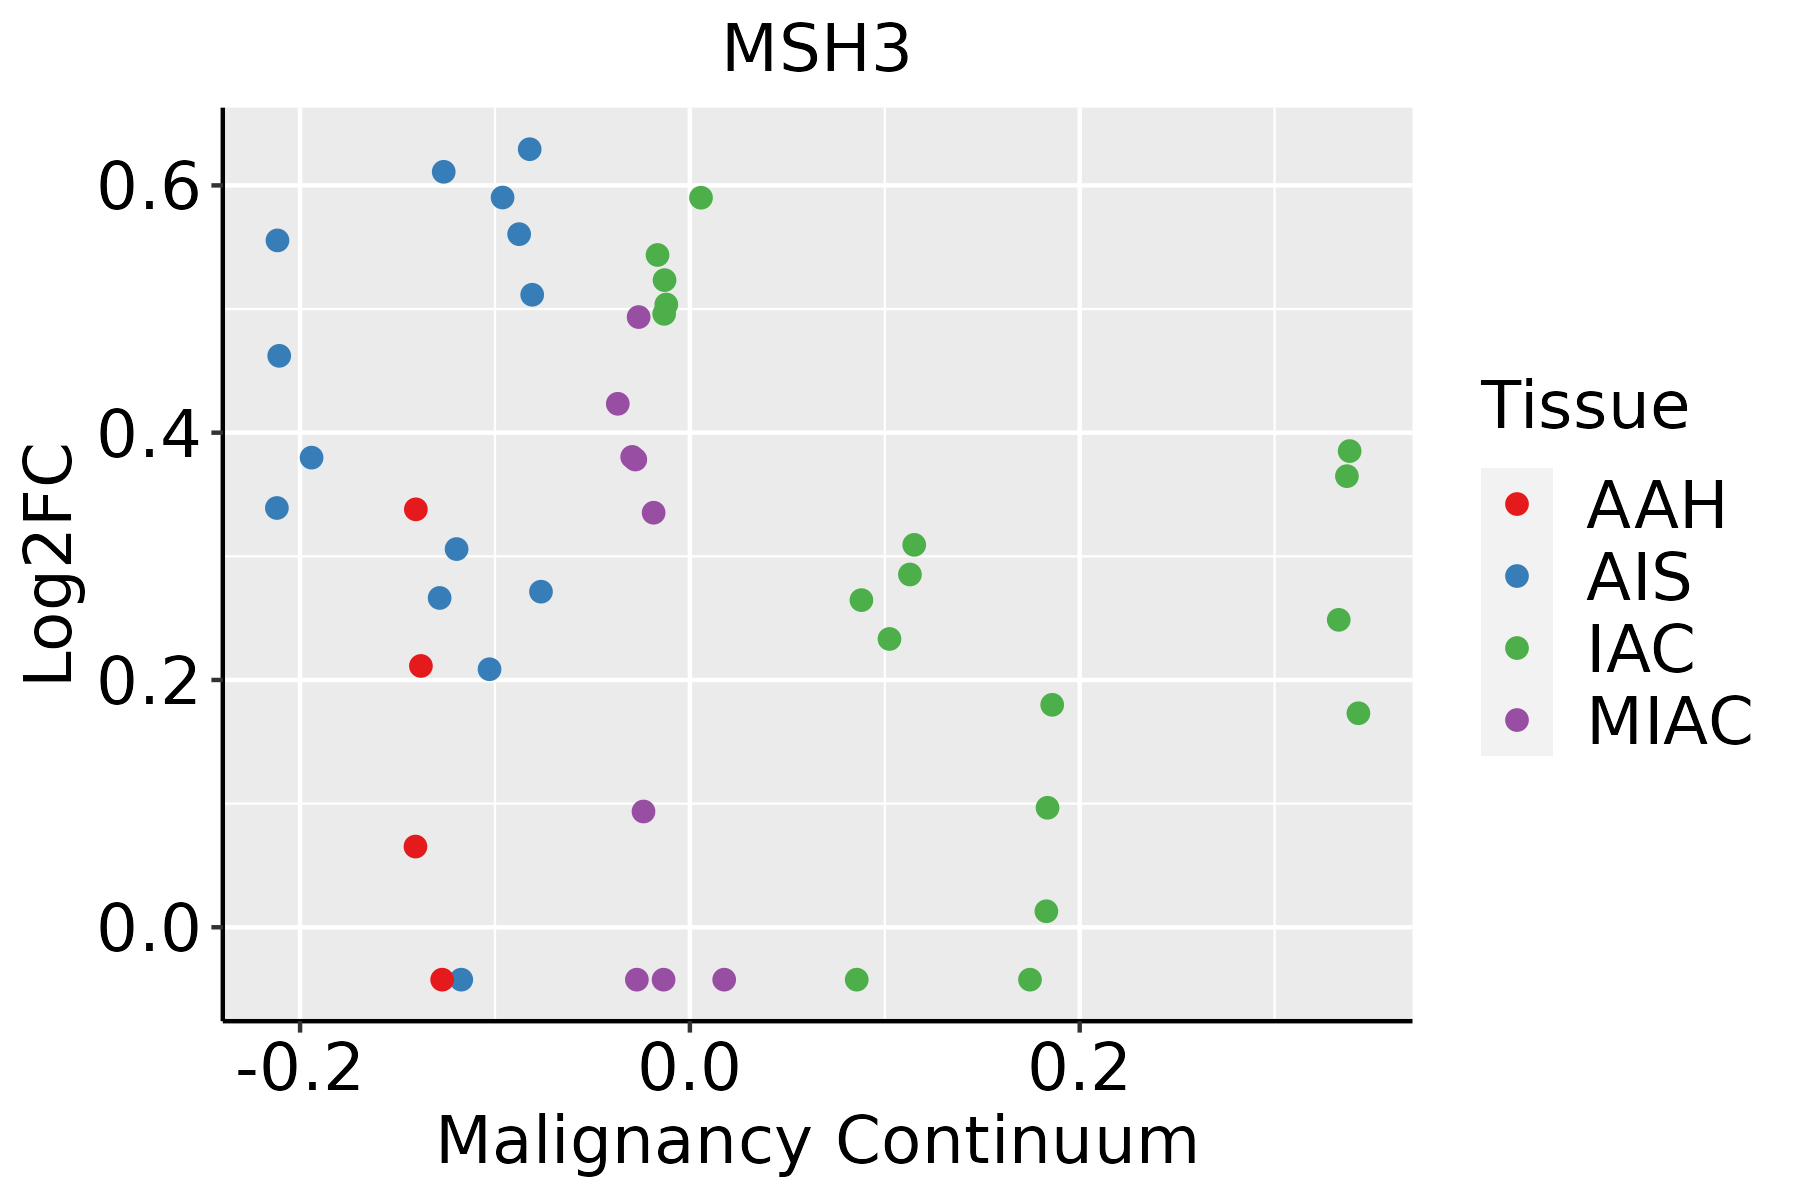 | AAH: Atypical adenomatous hyperplasia |
| AIS: Adenocarcinoma in situ | ||
| IAC: Invasive lung adenocarcinoma | ||
| MIA: Minimally invasive adenocarcinoma | ||
| Oral Cavity | 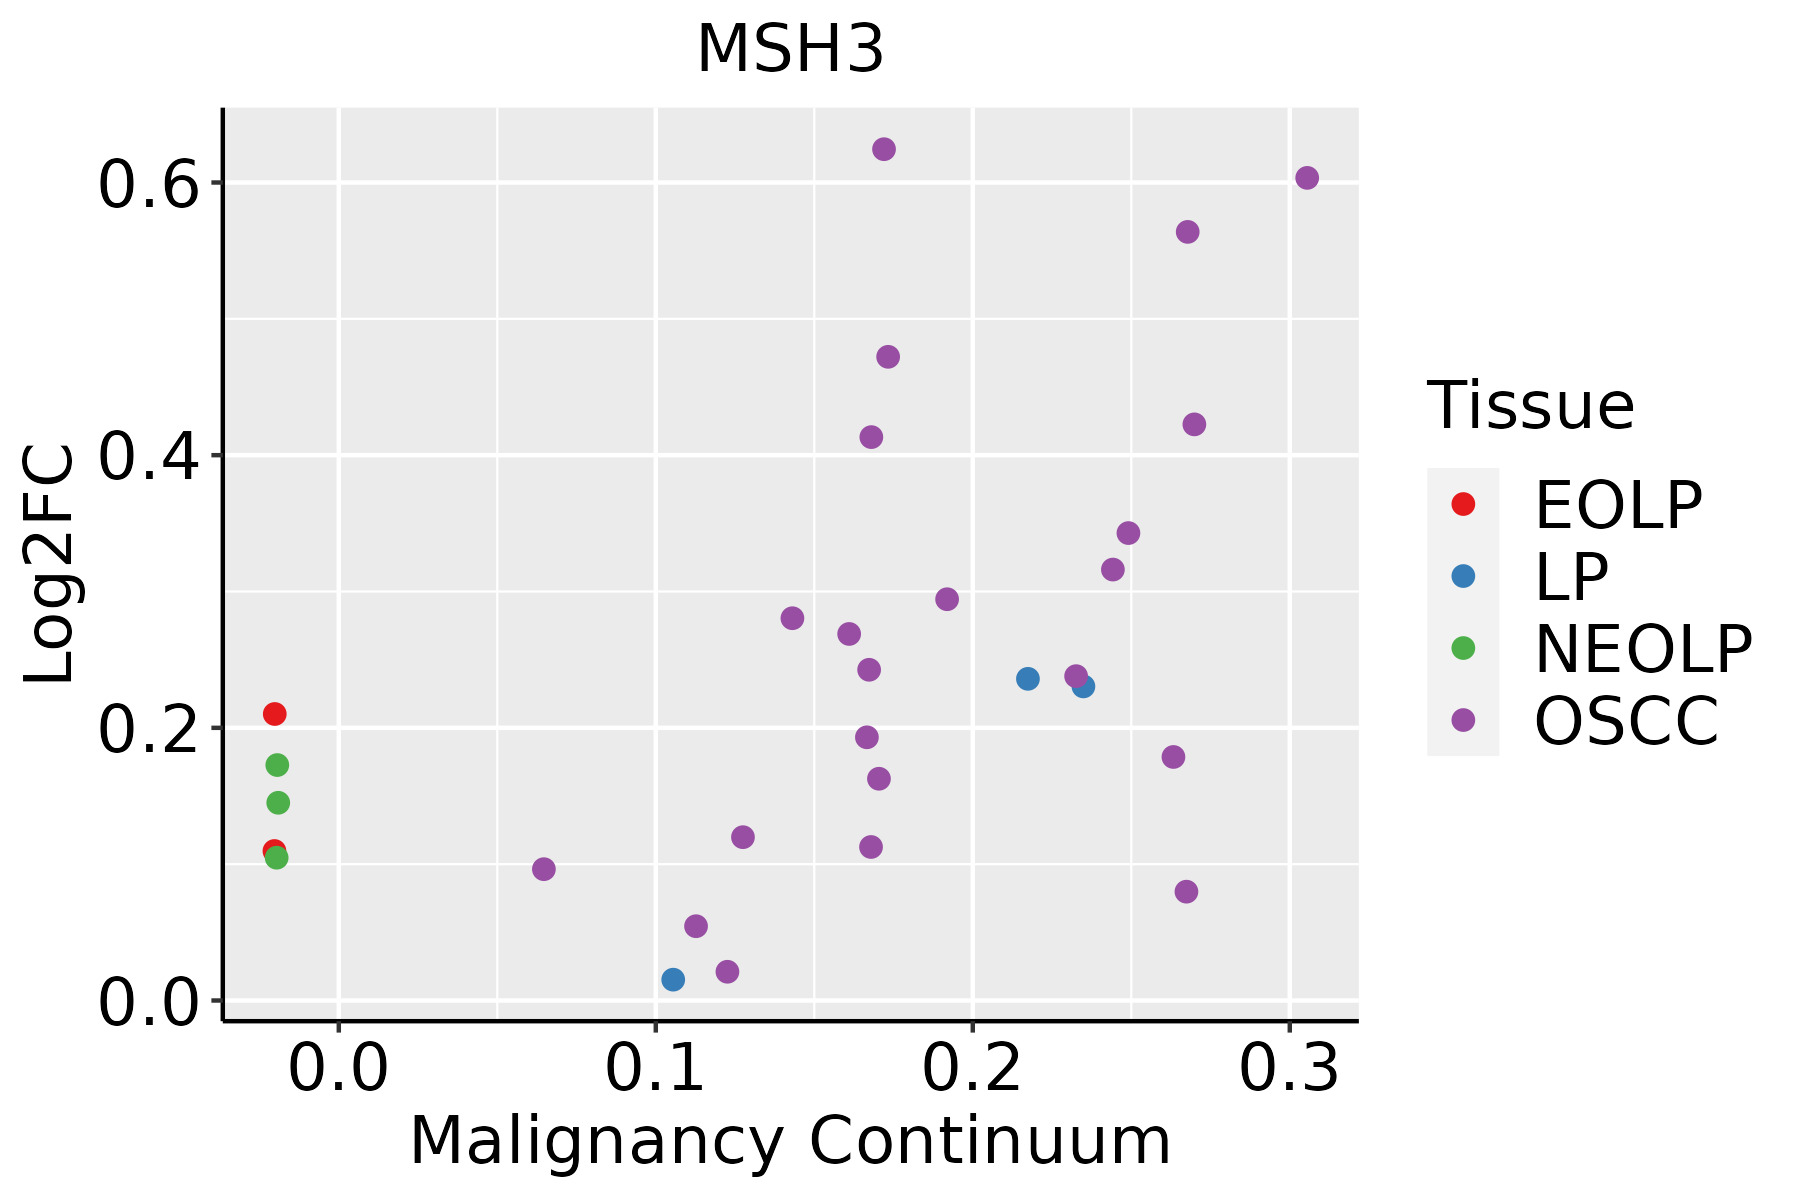 | EOLP: Erosive Oral lichen planus |
| LP: leukoplakia | ||
| NEOLP: Non-erosive oral lichen planus | ||
| OSCC: Oral squamous cell carcinoma | ||
| Thyroid |  | ATC: Anaplastic thyroid cancer |
| HT: Hashimoto's thyroiditis | ||
| PTC: Papillary thyroid cancer |
| ∗log2FC in expression of this searched gene in stem-like cells from each diseased tissue sample relative to stem-like cells in normal samples in each tissue plotted against the malignancy continuum. Samples are colored based on if they are from different disease stage. |
Top |
Malignant transformation related pathway analysis |
| Find out the enriched GO biological processes and KEGG pathways involved in transition from healthy to precancer to cancer |
| Tissue | Disease Stage | Enriched GO biological Processes |
| Colorectum | AD |  |
| Colorectum | SER |  |
| Colorectum | MSS |  |
| Colorectum | MSI-H |  |
| Colorectum | FAP |  |
| ∗Top 15 enriched GO BP terms are showed in the bar plot of each disease state in each tissue. Each row represents a significant GO biological process which is colored according to the -log10(p.adjust). |
| Page: 1 2 3 4 5 6 7 8 9 |
| GO ID | Tissue | Disease Stage | Description | Gene Ratio | Bg Ratio | pvalue | p.adjust | Count |
| GO:00510527 | Lung | IAC | regulation of DNA metabolic process | 55/2061 | 359/18723 | 7.12e-03 | 4.87e-02 | 55 |
| GO:005105210 | Oral cavity | OSCC | regulation of DNA metabolic process | 207/7305 | 359/18723 | 4.45e-13 | 2.17e-11 | 207 |
| GO:00482852 | Oral cavity | OSCC | organelle fission | 265/7305 | 488/18723 | 3.22e-12 | 1.27e-10 | 265 |
| GO:00002801 | Oral cavity | OSCC | nuclear division | 237/7305 | 439/18723 | 9.62e-11 | 2.90e-09 | 237 |
| GO:0006310 | Oral cavity | OSCC | DNA recombination | 147/7305 | 305/18723 | 6.33e-04 | 3.56e-03 | 147 |
| GO:0051095 | Oral cavity | OSCC | regulation of helicase activity | 10/7305 | 12/18723 | 2.25e-03 | 1.00e-02 | 10 |
| GO:0016447 | Oral cavity | OSCC | somatic recombination of immunoglobulin gene segments | 31/7305 | 57/18723 | 1.32e-02 | 4.38e-02 | 31 |
| GO:00022002 | Oral cavity | OSCC | somatic diversification of immune receptors | 40/7305 | 77/18723 | 1.42e-02 | 4.69e-02 | 40 |
| GO:0002562 | Oral cavity | OSCC | somatic diversification of immune receptors via germline recombination within a single locus | 35/7305 | 66/18723 | 1.43e-02 | 4.69e-02 | 35 |
| GO:0016444 | Oral cavity | OSCC | somatic cell DNA recombination | 35/7305 | 66/18723 | 1.43e-02 | 4.69e-02 | 35 |
| GO:005105222 | Oral cavity | EOLP | regulation of DNA metabolic process | 75/2218 | 359/18723 | 5.81e-07 | 1.53e-05 | 75 |
| GO:00164451 | Oral cavity | EOLP | somatic diversification of immunoglobulins | 16/2218 | 67/18723 | 4.37e-03 | 2.38e-02 | 16 |
| GO:00164471 | Oral cavity | EOLP | somatic recombination of immunoglobulin gene segments | 14/2218 | 57/18723 | 5.70e-03 | 2.92e-02 | 14 |
| GO:00022001 | Oral cavity | EOLP | somatic diversification of immune receptors | 17/2218 | 77/18723 | 7.79e-03 | 3.72e-02 | 17 |
| GO:00025621 | Oral cavity | EOLP | somatic diversification of immune receptors via germline recombination within a single locus | 15/2218 | 66/18723 | 9.17e-03 | 4.17e-02 | 15 |
| GO:00164441 | Oral cavity | EOLP | somatic cell DNA recombination | 15/2218 | 66/18723 | 9.17e-03 | 4.17e-02 | 15 |
| GO:005105218 | Thyroid | PTC | regulation of DNA metabolic process | 171/5968 | 359/18723 | 2.52e-10 | 8.33e-09 | 171 |
| GO:00482855 | Thyroid | PTC | organelle fission | 188/5968 | 488/18723 | 9.64e-04 | 5.77e-03 | 188 |
| GO:00002804 | Thyroid | PTC | nuclear division | 167/5968 | 439/18723 | 3.27e-03 | 1.60e-02 | 167 |
| GO:00510532 | Thyroid | PTC | negative regulation of DNA metabolic process | 53/5968 | 125/18723 | 8.39e-03 | 3.53e-02 | 53 |
| Page: 1 2 3 |
| Pathway ID | Tissue | Disease Stage | Description | Gene Ratio | Bg Ratio | pvalue | p.adjust | qvalue | Count |
| hsa0521010 | Cervix | CC | Colorectal cancer | 27/1267 | 86/8465 | 8.60e-05 | 5.57e-04 | 3.30e-04 | 27 |
| hsa0521015 | Cervix | CC | Colorectal cancer | 27/1267 | 86/8465 | 8.60e-05 | 5.57e-04 | 3.30e-04 | 27 |
| hsa0521020 | Esophagus | ESCC | Colorectal cancer | 69/4205 | 86/8465 | 4.06e-09 | 4.13e-08 | 2.11e-08 | 69 |
| hsa015247 | Esophagus | ESCC | Platinum drug resistance | 56/4205 | 73/8465 | 1.85e-06 | 1.13e-05 | 5.78e-06 | 56 |
| hsa034304 | Esophagus | ESCC | Mismatch repair | 21/4205 | 23/8465 | 2.85e-05 | 1.35e-04 | 6.90e-05 | 21 |
| hsa05210110 | Esophagus | ESCC | Colorectal cancer | 69/4205 | 86/8465 | 4.06e-09 | 4.13e-08 | 2.11e-08 | 69 |
| hsa0152414 | Esophagus | ESCC | Platinum drug resistance | 56/4205 | 73/8465 | 1.85e-06 | 1.13e-05 | 5.78e-06 | 56 |
| hsa0343011 | Esophagus | ESCC | Mismatch repair | 21/4205 | 23/8465 | 2.85e-05 | 1.35e-04 | 6.90e-05 | 21 |
| hsa052107 | Liver | Cirrhotic | Colorectal cancer | 39/2530 | 86/8465 | 1.67e-03 | 8.01e-03 | 4.94e-03 | 39 |
| hsa015244 | Liver | Cirrhotic | Platinum drug resistance | 34/2530 | 73/8465 | 1.86e-03 | 8.37e-03 | 5.16e-03 | 34 |
| hsa0521012 | Liver | Cirrhotic | Colorectal cancer | 39/2530 | 86/8465 | 1.67e-03 | 8.01e-03 | 4.94e-03 | 39 |
| hsa0152411 | Liver | Cirrhotic | Platinum drug resistance | 34/2530 | 73/8465 | 1.86e-03 | 8.37e-03 | 5.16e-03 | 34 |
| hsa0521022 | Liver | HCC | Colorectal cancer | 65/4020 | 86/8465 | 8.85e-08 | 1.23e-06 | 6.87e-07 | 65 |
| hsa015242 | Liver | HCC | Platinum drug resistance | 52/4020 | 73/8465 | 3.14e-05 | 1.88e-04 | 1.04e-04 | 52 |
| hsa0521032 | Liver | HCC | Colorectal cancer | 65/4020 | 86/8465 | 8.85e-08 | 1.23e-06 | 6.87e-07 | 65 |
| hsa015243 | Liver | HCC | Platinum drug resistance | 52/4020 | 73/8465 | 3.14e-05 | 1.88e-04 | 1.04e-04 | 52 |
| hsa052108 | Lung | IAC | Colorectal cancer | 24/1053 | 86/8465 | 8.58e-05 | 1.21e-03 | 8.05e-04 | 24 |
| hsa0521013 | Lung | IAC | Colorectal cancer | 24/1053 | 86/8465 | 8.58e-05 | 1.21e-03 | 8.05e-04 | 24 |
| hsa0521023 | Lung | AIS | Colorectal cancer | 20/961 | 86/8465 | 1.25e-03 | 9.02e-03 | 5.77e-03 | 20 |
| hsa0521033 | Lung | AIS | Colorectal cancer | 20/961 | 86/8465 | 1.25e-03 | 9.02e-03 | 5.77e-03 | 20 |
| Page: 1 2 |
Top |
Cell-cell communication analysis |
| Identification of potential cell-cell interactions between two cell types and their ligand-receptor pairs for different disease states |
| Ligand | Receptor | LRpair | Pathway | Tissue | Disease Stage |
| Page: 1 |
Top |
Single-cell gene regulatory network inference analysis |
| Find out the significant the regulons (TFs) and the target genes of each regulon across cell types for different disease states |
| TF | Cell Type | Tissue | Disease Stage | Target Gene | RSS | Regulon Activity |
| ∗The dot plots of a searched regulon are shown for all cell subpopulations in each disease state of each tissue based on the regulon specific score inferred using pySCENIC and by calculating the average expression. |
| Page: 1 |
Top |
Somatic mutation of malignant transformation related genes |
| Annotation of somatic variants for genes involved in malignant transformation |
| Hugo Symbol | Variant Class | Variant Classification | dbSNP RS | HGVSc | HGVSp | HGVSp Short | SWISSPROT | BIOTYPE | SIFT | PolyPhen | Tumor Sample Barcode | Tissue | Histology | Sex | Age | Stage | Therapy Types | Drugs | Outcome |
| MSH3 | SNV | Missense_Mutation | rs768150895 | c.2615N>A | p.Gly872Glu | p.G872E | P20585 | protein_coding | deleterious(0.04) | probably_damaging(0.963) | TCGA-AC-A23H-01 | Breast | breast invasive carcinoma | Female | >=65 | I/II | Unknown | Unknown | PD |
| MSH3 | SNV | Missense_Mutation | novel | c.2187T>A | p.His729Gln | p.H729Q | P20585 | protein_coding | deleterious(0) | possibly_damaging(0.866) | TCGA-BH-A0BW-01 | Breast | breast invasive carcinoma | Female | >=65 | I/II | Chemotherapy | adriamycin | CR |
| MSH3 | SNV | Missense_Mutation | c.2599N>G | p.Ile867Val | p.I867V | P20585 | protein_coding | tolerated(0.43) | probably_damaging(0.996) | TCGA-C8-A26X-01 | Breast | breast invasive carcinoma | Female | <65 | I/II | Chemotherapy | 5-fluorouracil | CR | |
| MSH3 | SNV | Missense_Mutation | rs762638626 | c.2814N>T | p.Arg938Ser | p.R938S | P20585 | protein_coding | deleterious(0) | probably_damaging(0.942) | TCGA-D8-A27G-01 | Breast | breast invasive carcinoma | Female | >=65 | I/II | Unknown | Unknown | SD |
| MSH3 | insertion | Frame_Shift_Ins | novel | c.2391_2392insGTAGATACATTGGTGAAGGTTGTATTATT | p.Gln798ValfsTer12 | p.Q798Vfs*12 | P20585 | protein_coding | TCGA-AR-A0U0-01 | Breast | breast invasive carcinoma | Female | >=65 | I/II | Unknown | Unknown | SD | ||
| MSH3 | SNV | Missense_Mutation | rs373251342 | c.2288N>A | p.Cys763Tyr | p.C763Y | P20585 | protein_coding | tolerated(0.48) | possibly_damaging(0.752) | TCGA-C5-A7CO-01 | Cervix | cervical & endocervical cancer | Female | >=65 | I/II | Chemotherapy | cisplatin | SD |
| MSH3 | SNV | Missense_Mutation | novel | c.119N>T | p.Ser40Phe | p.S40F | P20585 | protein_coding | deleterious_low_confidence(0) | benign(0.014) | TCGA-C5-A8YT-01 | Cervix | cervical & endocervical cancer | Female | <65 | I/II | Chemotherapy | cisplatin | PD |
| MSH3 | SNV | Missense_Mutation | rs762864714 | c.748N>A | p.Val250Met | p.V250M | P20585 | protein_coding | deleterious(0) | probably_damaging(0.978) | TCGA-AA-3672-01 | Colorectum | colon adenocarcinoma | Female | >=65 | III/IV | Unknown | Unknown | SD |
| MSH3 | SNV | Missense_Mutation | rs138381683 | c.427N>A | p.Asp143Asn | p.D143N | P20585 | protein_coding | deleterious_low_confidence(0.04) | benign(0.255) | TCGA-AA-3984-01 | Colorectum | colon adenocarcinoma | Female | <65 | I/II | Unknown | Unknown | SD |
| MSH3 | SNV | Missense_Mutation | c.806N>G | p.Glu269Gly | p.E269G | P20585 | protein_coding | deleterious(0.01) | probably_damaging(0.991) | TCGA-AA-A010-01 | Colorectum | colon adenocarcinoma | Female | <65 | I/II | Chemotherapy | folinic | CR |
| Page: 1 2 3 4 5 6 7 8 9 10 |
Top |
Related drugs of malignant transformation related genes |
| Identification of chemicals and drugs interact with genes involved in malignant transfromation |
| (DGIdb 4.0) |
| Entrez ID | Symbol | Category | Interaction Types | Drug Claim Name | Drug Name | PMIDs |
| Page: 1 |

Copyright 2023-Present -The University of Texas Health Science Center at Houston |