Schematic overview of the cellular and molecular mechanisms involved in the cancer progression, including the proposed cellular and molecular mechanisms in cancer cells trajectory. AT1: alveolar type 1 cells; AT2: alveolar type 2 cells; AAH: atypical adenomatous hyperplasia; AIS: adenocarcinoma in situ; MIA: minimally invasive adenocarcinoma; IA: invasive adenocarcinoma; EMT: epithelial-mesenchymal transition

Home

Download

Statistics

Help

Contact

Center for Computational Systems Medicine
leaf

Gene summary

leaf

Malignant transformation analysis

leaf

Malignant transformation related pathway analysis

leaf

Cell-cell communication analysis

leaf

Single-cell gene regulatory network inference analysis

leaf

Somatic mutation of malignant transformation related genes

leaf

Related drugs of malignant transformation related genes

Gene: MRTO4

Gene summary for MRTO4

check button Gene summary.

Gene informationSpeciesHuman
Gene symbol

MRTO4

Gene ID

51154

Gene nameMRT4 homolog, ribosome maturation factor
Gene AliasC1orf33
Cytomap1p36.13
Gene Typeprotein-coding
GO ID

GO:0000027

UniProtAcc

A0A024RAE1


Top

Malignant transformation analysis

check button Identification of the aberrant gene expression in precancerous and cancerous lesions by comparing the gene expression of stem-like cells in diseased tissues with normal stem cells
check button Malignant transformation involving gene list.
Entrez IDSymbolReplicatesSpeciesOrganTissueAdj P-valueLog2FCMalignancy
51154MRTO4LZE4THumanEsophagusESCC2.26e-088.08e-020.0811
51154MRTO4LZE7THumanEsophagusESCC1.78e-093.50e-010.0667
51154MRTO4LZE8THumanEsophagusESCC9.48e-061.58e-010.067
51154MRTO4LZE22THumanEsophagusESCC3.75e-025.78e-010.068
51154MRTO4LZE24THumanEsophagusESCC2.42e-122.51e-010.0596
51154MRTO4LZE21THumanEsophagusESCC6.31e-032.09e-010.0655
51154MRTO4P1T-EHumanEsophagusESCC2.40e-154.43e-010.0875
51154MRTO4P2T-EHumanEsophagusESCC1.06e-379.07e-010.1177
51154MRTO4P4T-EHumanEsophagusESCC3.43e-206.46e-010.1323
51154MRTO4P5T-EHumanEsophagusESCC9.06e-204.45e-010.1327
51154MRTO4P8T-EHumanEsophagusESCC2.62e-193.16e-010.0889
51154MRTO4P9T-EHumanEsophagusESCC1.87e-184.23e-010.1131
51154MRTO4P10T-EHumanEsophagusESCC8.56e-366.34e-010.116
51154MRTO4P11T-EHumanEsophagusESCC2.08e-144.96e-010.1426
51154MRTO4P12T-EHumanEsophagusESCC1.41e-174.33e-010.1122
51154MRTO4P15T-EHumanEsophagusESCC9.45e-306.52e-010.1149
51154MRTO4P16T-EHumanEsophagusESCC9.46e-244.55e-010.1153
51154MRTO4P17T-EHumanEsophagusESCC3.56e-116.75e-010.1278
51154MRTO4P19T-EHumanEsophagusESCC4.43e-061.00e+000.1662
51154MRTO4P20T-EHumanEsophagusESCC6.08e-215.82e-010.1124
Page: 1 2 3 4 5 6 

check button Transcriptomic changes along malignancy continuum.
TissueExpression DynamicsAbbreviation
EsophagusThe image shows the transcriptomic changes along malignancy continuum.log2FC in expression of this searched gene in stem-like cells from each diseased tissue sample relative to stem-like cells in normal samples in each tissue plotted against the malignancy continuum. Samples are colored based on if they are from different disease stage.
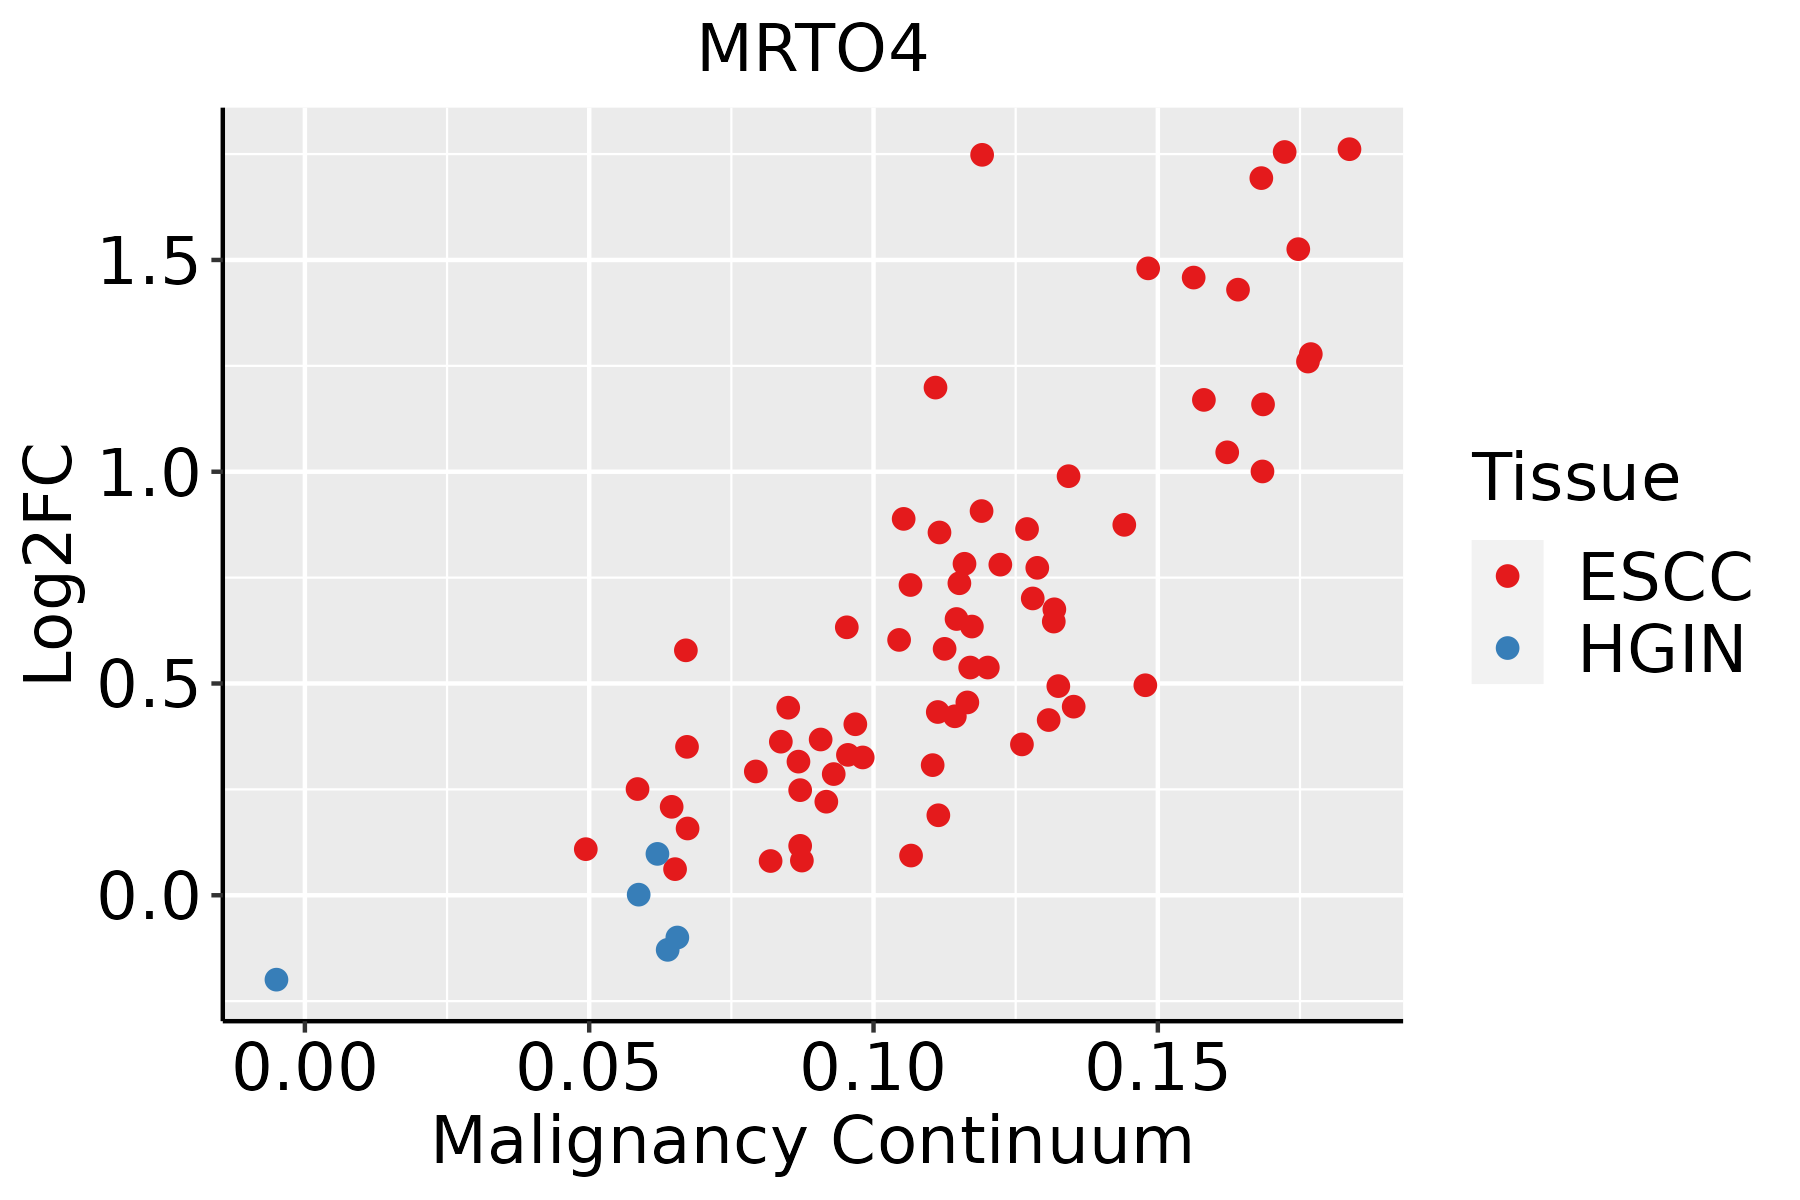
ESCC: Esophageal squamous cell carcinoma
HGIN: High-grade intraepithelial neoplasias
LGIN: Low-grade intraepithelial neoplasias
LiverThe image shows the transcriptomic changes along malignancy continuum.log2FC in expression of this searched gene in stem-like cells from each diseased tissue sample relative to stem-like cells in normal samples in each tissue plotted against the malignancy continuum. Samples are colored based on if they are from different disease stage.HCC: Hepatocellular carcinoma
NAFLD: Non-alcoholic fatty liver disease
Oral CavityThe image shows the transcriptomic changes along malignancy continuum.log2FC in expression of this searched gene in stem-like cells from each diseased tissue sample relative to stem-like cells in normal samples in each tissue plotted against the malignancy continuum. Samples are colored based on if they are from different disease stage.
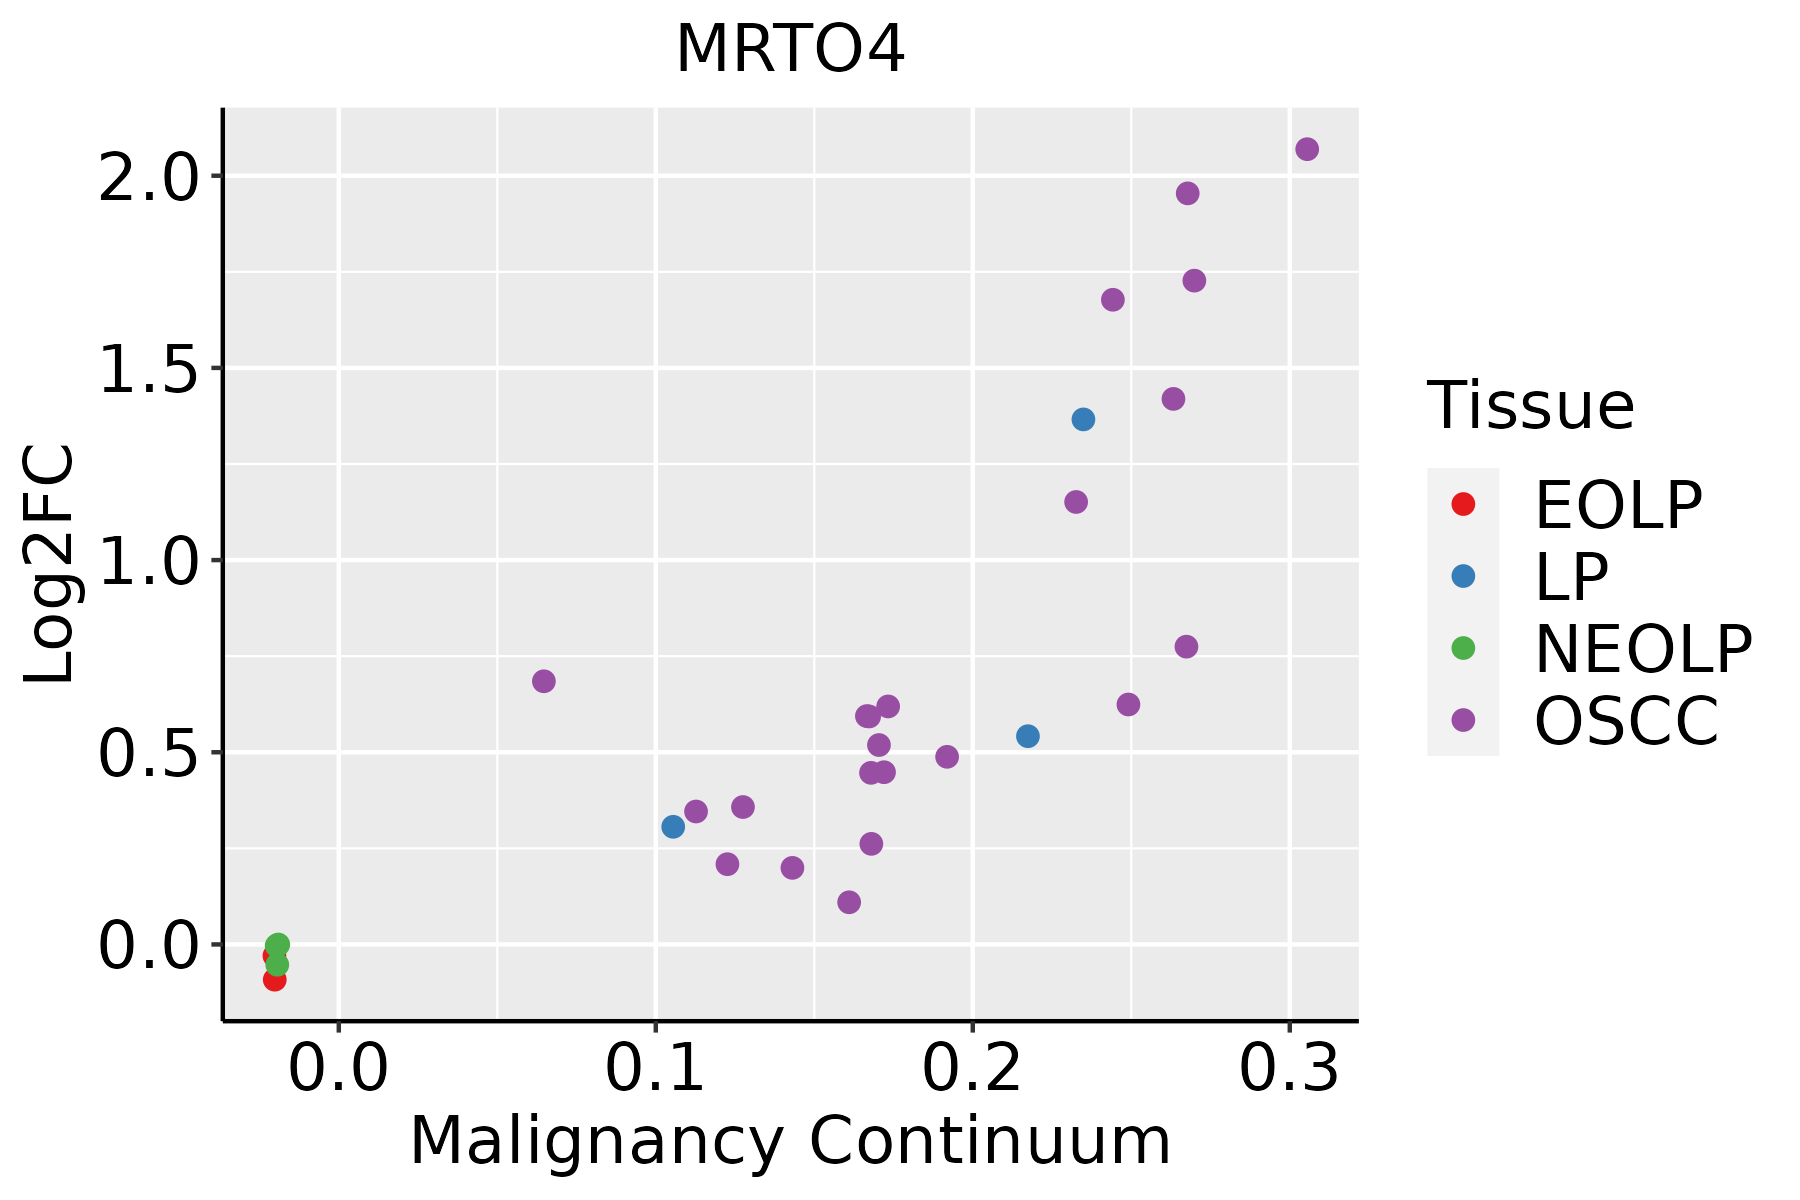
EOLP: Erosive Oral lichen planus
LP: leukoplakia
NEOLP: Non-erosive oral lichen planus
OSCC: Oral squamous cell carcinoma
SkinThe image shows the transcriptomic changes along malignancy continuum.log2FC in expression of this searched gene in stem-like cells from each diseased tissue sample relative to stem-like cells in normal samples in each tissue plotted against the malignancy continuum. Samples are colored based on if they are from different disease stage.
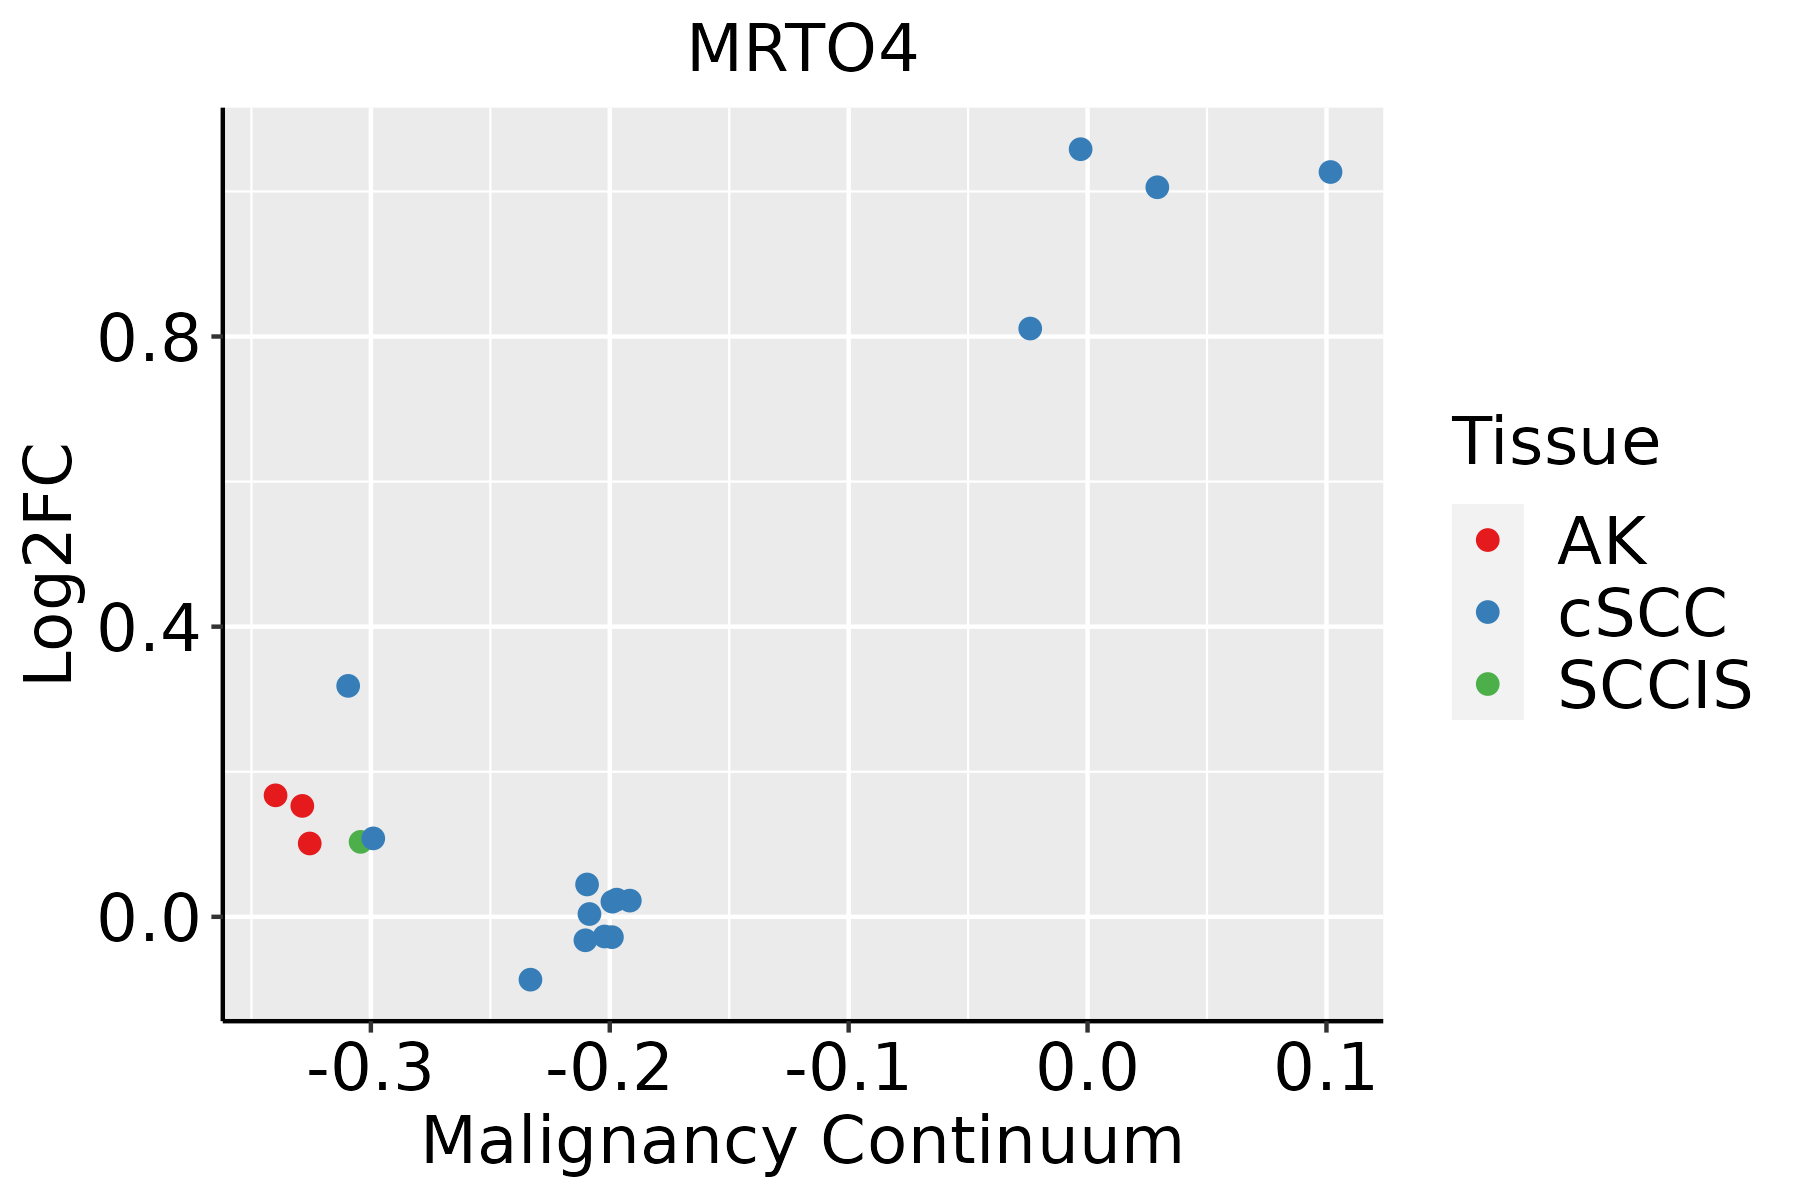
AK: Actinic keratosis
cSCC: Cutaneous squamous cell carcinoma
SCCIS:squamous cell carcinoma in situ
ThyroidThe image shows the transcriptomic changes along malignancy continuum.log2FC in expression of this searched gene in stem-like cells from each diseased tissue sample relative to stem-like cells in normal samples in each tissue plotted against the malignancy continuum. Samples are colored based on if they are from different disease stage.
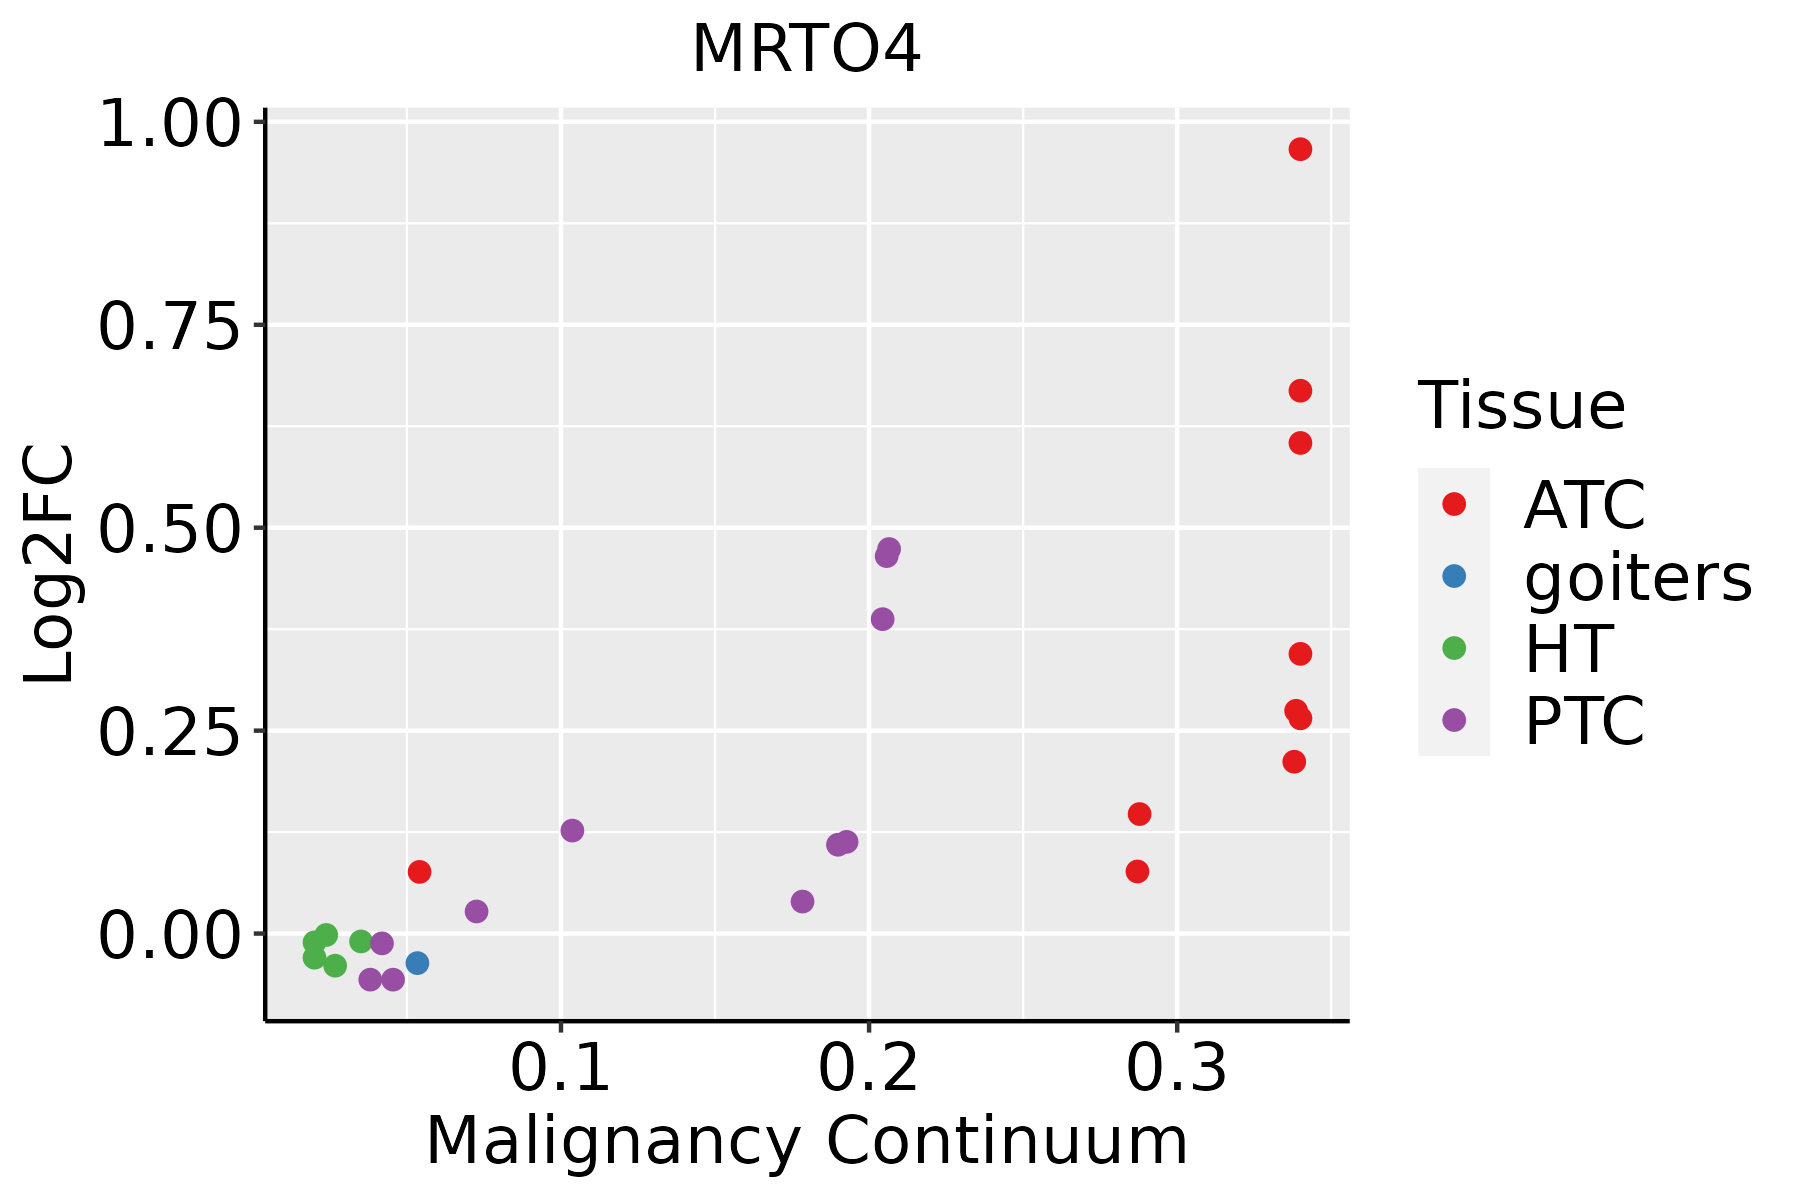
ATC: Anaplastic thyroid cancer
HT: Hashimoto's thyroiditis
PTC: Papillary thyroid cancer
∗log2FC in expression of this searched gene in stem-like cells from each diseased tissue sample relative to stem-like cells in normal samples in each tissue plotted against the malignancy continuum. Samples are colored based on if they are from different disease stage.

Top

Malignant transformation related pathway analysis

check buttonFind out the enriched GO biological processes and KEGG pathways involved in transition from healthy to precancer to cancer
check button Figure of enriched GO biological processes.
TissueDisease StageEnriched GO biological Processes
ColorectumADGO analysis - Figure of enriched GO biological processes: Top 15 enriched GO BP terms are showed in the bar plot of each disease state in each tissue. Each row represents a significant GO biological process which is colored according to the -log10(p.adjust).
ColorectumSERGO analysis - Figure of enriched GO biological processes: Top 15 enriched GO BP terms are showed in the bar plot of each disease state in each tissue. Each row represents a significant GO biological process which is colored according to the -log10(p.adjust).
ColorectumMSSGO analysis - Figure of enriched GO biological processes: Top 15 enriched GO BP terms are showed in the bar plot of each disease state in each tissue. Each row represents a significant GO biological process which is colored according to the -log10(p.adjust).
ColorectumMSI-HGO analysis - Figure of enriched GO biological processes: Top 15 enriched GO BP terms are showed in the bar plot of each disease state in each tissue. Each row represents a significant GO biological process which is colored according to the -log10(p.adjust).
ColorectumFAPGO analysis - Figure of enriched GO biological processes: Top 15 enriched GO BP terms are showed in the bar plot of each disease state in each tissue. Each row represents a significant GO biological process which is colored according to the -log10(p.adjust).
∗Top 15 enriched GO BP terms are showed in the bar plot of each disease state in each tissue. Each row represents a significant GO biological process which is colored according to the -log10(p.adjust).
Page: 1 2 3 4 5 6 7 8 9 

check button Enriched GO biological processes.
GO IDTissueDisease StageDescriptionGene RatioBg Ratiopvaluep.adjustCount
GO:004225412LiverCirrhoticribosome biogenesis154/4634299/187231.18e-236.72e-21154
GO:190136111LiverCirrhoticorganic cyclic compound catabolic process213/4634495/187231.58e-193.67e-17213
GO:001943911LiverCirrhoticaromatic compound catabolic process202/4634467/187236.93e-191.28e-16202
GO:004427011LiverCirrhoticcellular nitrogen compound catabolic process195/4634451/187232.99e-184.94e-16195
GO:004670011LiverCirrhoticheterocycle catabolic process192/4634445/187237.17e-181.12e-15192
GO:000636412LiverCirrhoticrRNA processing115/4634225/187231.12e-171.64e-15115
GO:00160724LiverCirrhoticrRNA metabolic process119/4634236/187231.19e-171.70e-15119
GO:007182612LiverCirrhoticribonucleoprotein complex subunit organization115/4634227/187232.67e-173.63e-15115
GO:002261812LiverCirrhoticribonucleoprotein complex assembly112/4634220/187234.35e-175.81e-15112
GO:003465511LiverCirrhoticnucleobase-containing compound catabolic process171/4634407/187239.07e-159.33e-13171
GO:000640111LiverCirrhoticRNA catabolic process126/4634278/187234.64e-144.10e-12126
GO:000640211LiverCirrhoticmRNA catabolic process109/4634232/187231.30e-131.09e-11109
GO:004227312LiverCirrhoticribosomal large subunit biogenesis47/463472/187234.20e-133.29e-1147
GO:00344701LiverCirrhoticncRNA processing158/4634395/187231.09e-116.96e-10158
GO:004225512LiverCirrhoticribosome assembly39/463461/187231.07e-105.72e-0939
GO:000095611LiverCirrhoticnuclear-transcribed mRNA catabolic process58/4634112/187236.55e-103.06e-0858
GO:00346603LiverCirrhoticncRNA metabolic process173/4634485/187233.64e-081.21e-06173
GO:000002712LiverCirrhoticribosomal large subunit assembly15/463427/187235.96e-044.63e-0315
GO:002261322LiverHCCribonucleoprotein complex biogenesis355/7958463/187237.76e-524.92e-48355
GO:004225422LiverHCCribosome biogenesis246/7958299/187234.99e-461.58e-42246
Page: 1 2 3 4 5 6 7 8 9 

check button Enriched KEGG pathways.
Pathway IDTissueDisease StageDescriptionGene RatioBg Ratiopvaluep.adjustqvalueCount
Page: 1 

Top

Cell-cell communication analysis

check buttonIdentification of potential cell-cell interactions between two cell types and their ligand-receptor pairs for different disease states
LigandReceptorLRpairPathwayTissueDisease Stage
Page: 1 

Top

Single-cell gene regulatory network inference analysis

check buttonFind out the significant the regulons (TFs) and the target genes of each regulon across cell types for different disease states
TFCell TypeTissueDisease StageTarget GeneRSSRegulon Activity
∗The dot plots of a searched regulon are shown for all cell subpopulations in each disease state of each tissue based on the regulon specific score inferred using pySCENIC and by calculating the average expression.
Page: 1 

Top

Somatic mutation of malignant transformation related genes

check buttonAnnotation of somatic variants for genes involved in malignant transformation
Hugo SymbolVariant ClassVariant ClassificationdbSNP RSHGVScHGVSpHGVSp ShortSWISSPROTBIOTYPESIFTPolyPhenTumor Sample BarcodeTissueHistologySexAgeStageTherapy TypesDrugsOutcome
MRTO4SNVMissense_Mutationrs748671029c.481N>Ap.Ala161Thrp.A161TQ9UKD2protein_codingtolerated(0.35)benign(0.001)TCGA-A2-A0YT-01Breastbreast invasive carcinomaFemale<65III/IVHormone TherapyarimidexSD
MRTO4insertionIn_Frame_Insnovelc.174_175insCATTTAp.Asn58_Ala59insHisLeup.N58_A59insHLQ9UKD2protein_codingTCGA-AN-A0FX-01Breastbreast invasive carcinomaFemale<65I/IIUnknownUnknownSD
MRTO4insertionFrame_Shift_Insnovelc.175_176insATTGGTCTCTCATCATCTCTCTp.Ala59AspfsTer32p.A59Dfs*32Q9UKD2protein_codingTCGA-AN-A0FX-01Breastbreast invasive carcinomaFemale<65I/IIUnknownUnknownSD
MRTO4SNVMissense_Mutationc.140A>Gp.Asn47Serp.N47SQ9UKD2protein_codingdeleterious(0)probably_damaging(0.951)TCGA-AH-6897-01Colorectumrectum adenocarcinomaMale<65I/IIUnknownUnknownSD
MRTO4SNVMissense_Mutationrs564605284c.635N>Tp.Ser212Leup.S212LQ9UKD2protein_codingtolerated(0.19)benign(0.009)TCGA-A5-A0G1-01Endometriumuterine corpus endometrioid carcinomaFemale>=65I/IIUnknownUnknownSD
MRTO4SNVMissense_Mutationnovelc.162N>Tp.Lys54Asnp.K54NQ9UKD2protein_codingdeleterious(0)possibly_damaging(0.808)TCGA-A5-A0G2-01Endometriumuterine corpus endometrioid carcinomaFemale<65III/IVUnknownUnknownSD
MRTO4SNVMissense_Mutationrs754307809c.565N>Ap.Val189Ilep.V189IQ9UKD2protein_codingtolerated(1)benign(0)TCGA-AJ-A8CT-01Endometriumuterine corpus endometrioid carcinomaFemale<65I/IIUnknownUnknownSD
MRTO4SNVMissense_Mutationrs563261309c.190C>Tp.Arg64Trpp.R64WQ9UKD2protein_codingdeleterious(0.01)possibly_damaging(0.563)TCGA-AP-A0LT-01Endometriumuterine corpus endometrioid carcinomaFemale<65I/IIUnknownUnknownSD
MRTO4SNVMissense_Mutationc.62N>Gp.Glu21Glyp.E21GQ9UKD2protein_codingtolerated(0.07)benign(0.33)TCGA-BS-A0UV-01Endometriumuterine corpus endometrioid carcinomaFemale<65III/IVUnknownUnknownSD
MRTO4SNVMissense_Mutationrs769660709c.169N>Tp.Arg57Trpp.R57WQ9UKD2protein_codingdeleterious(0.01)possibly_damaging(0.825)TCGA-DF-A2KU-01Endometriumuterine corpus endometrioid carcinomaFemaleUnknownI/IIUnknownUnknownSD
Page: 1 2 3 

Top

Related drugs of malignant transformation related genes

check buttonIdentification of chemicals and drugs interact with genes involved in malignant transfromation
(DGIdb 4.0)
Entrez IDSymbolCategoryInteraction TypesDrug Claim NameDrug NamePMIDs
Page: 1