
|
|||||
|
 | |
| |
| |
| |
| |
| |
|
Gene: MRPS11 |
Gene summary for MRPS11 |
| Gene information | Species | Human | Gene symbol | MRPS11 | Gene ID | 64963 |
| Gene name | mitochondrial ribosomal protein S11 | |
| Gene Alias | HCC-2 | |
| Cytomap | 15q25.3 | |
| Gene Type | protein-coding | GO ID | GO:0000028 | UniProtAcc | P82912 |
Top |
Malignant transformation analysis |
| Identification of the aberrant gene expression in precancerous and cancerous lesions by comparing the gene expression of stem-like cells in diseased tissues with normal stem cells |
| Entrez ID | Symbol | Replicates | Species | Organ | Tissue | Adj P-value | Log2FC | Malignancy |
| 64963 | MRPS11 | LZE4T | Human | Esophagus | ESCC | 1.67e-10 | 3.03e-01 | 0.0811 |
| 64963 | MRPS11 | LZE5T | Human | Esophagus | ESCC | 2.49e-02 | 3.71e-01 | 0.0514 |
| 64963 | MRPS11 | LZE7T | Human | Esophagus | ESCC | 8.09e-20 | 8.63e-01 | 0.0667 |
| 64963 | MRPS11 | LZE8T | Human | Esophagus | ESCC | 7.74e-08 | 2.72e-01 | 0.067 |
| 64963 | MRPS11 | LZE20T | Human | Esophagus | ESCC | 1.69e-02 | 1.45e-01 | 0.0662 |
| 64963 | MRPS11 | LZE22T | Human | Esophagus | ESCC | 1.05e-03 | 3.71e-01 | 0.068 |
| 64963 | MRPS11 | LZE24T | Human | Esophagus | ESCC | 3.17e-13 | 3.61e-01 | 0.0596 |
| 64963 | MRPS11 | LZE21T | Human | Esophagus | ESCC | 1.53e-06 | 5.27e-01 | 0.0655 |
| 64963 | MRPS11 | LZE6T | Human | Esophagus | ESCC | 3.41e-14 | 5.90e-01 | 0.0845 |
| 64963 | MRPS11 | P1T-E | Human | Esophagus | ESCC | 6.48e-13 | 5.47e-01 | 0.0875 |
| 64963 | MRPS11 | P2T-E | Human | Esophagus | ESCC | 2.46e-29 | 5.08e-01 | 0.1177 |
| 64963 | MRPS11 | P4T-E | Human | Esophagus | ESCC | 1.35e-42 | 8.94e-01 | 0.1323 |
| 64963 | MRPS11 | P5T-E | Human | Esophagus | ESCC | 3.78e-20 | 2.76e-01 | 0.1327 |
| 64963 | MRPS11 | P8T-E | Human | Esophagus | ESCC | 7.40e-33 | 6.37e-01 | 0.0889 |
| 64963 | MRPS11 | P9T-E | Human | Esophagus | ESCC | 5.19e-24 | 6.79e-01 | 0.1131 |
| 64963 | MRPS11 | P10T-E | Human | Esophagus | ESCC | 2.92e-47 | 7.10e-01 | 0.116 |
| 64963 | MRPS11 | P11T-E | Human | Esophagus | ESCC | 9.76e-12 | 4.79e-01 | 0.1426 |
| 64963 | MRPS11 | P12T-E | Human | Esophagus | ESCC | 4.51e-37 | 6.12e-01 | 0.1122 |
| 64963 | MRPS11 | P15T-E | Human | Esophagus | ESCC | 3.62e-22 | 5.01e-01 | 0.1149 |
| 64963 | MRPS11 | P16T-E | Human | Esophagus | ESCC | 1.88e-29 | 5.94e-01 | 0.1153 |
| Page: 1 2 3 4 5 6 7 |
| Tissue | Expression Dynamics | Abbreviation |
| Esophagus | 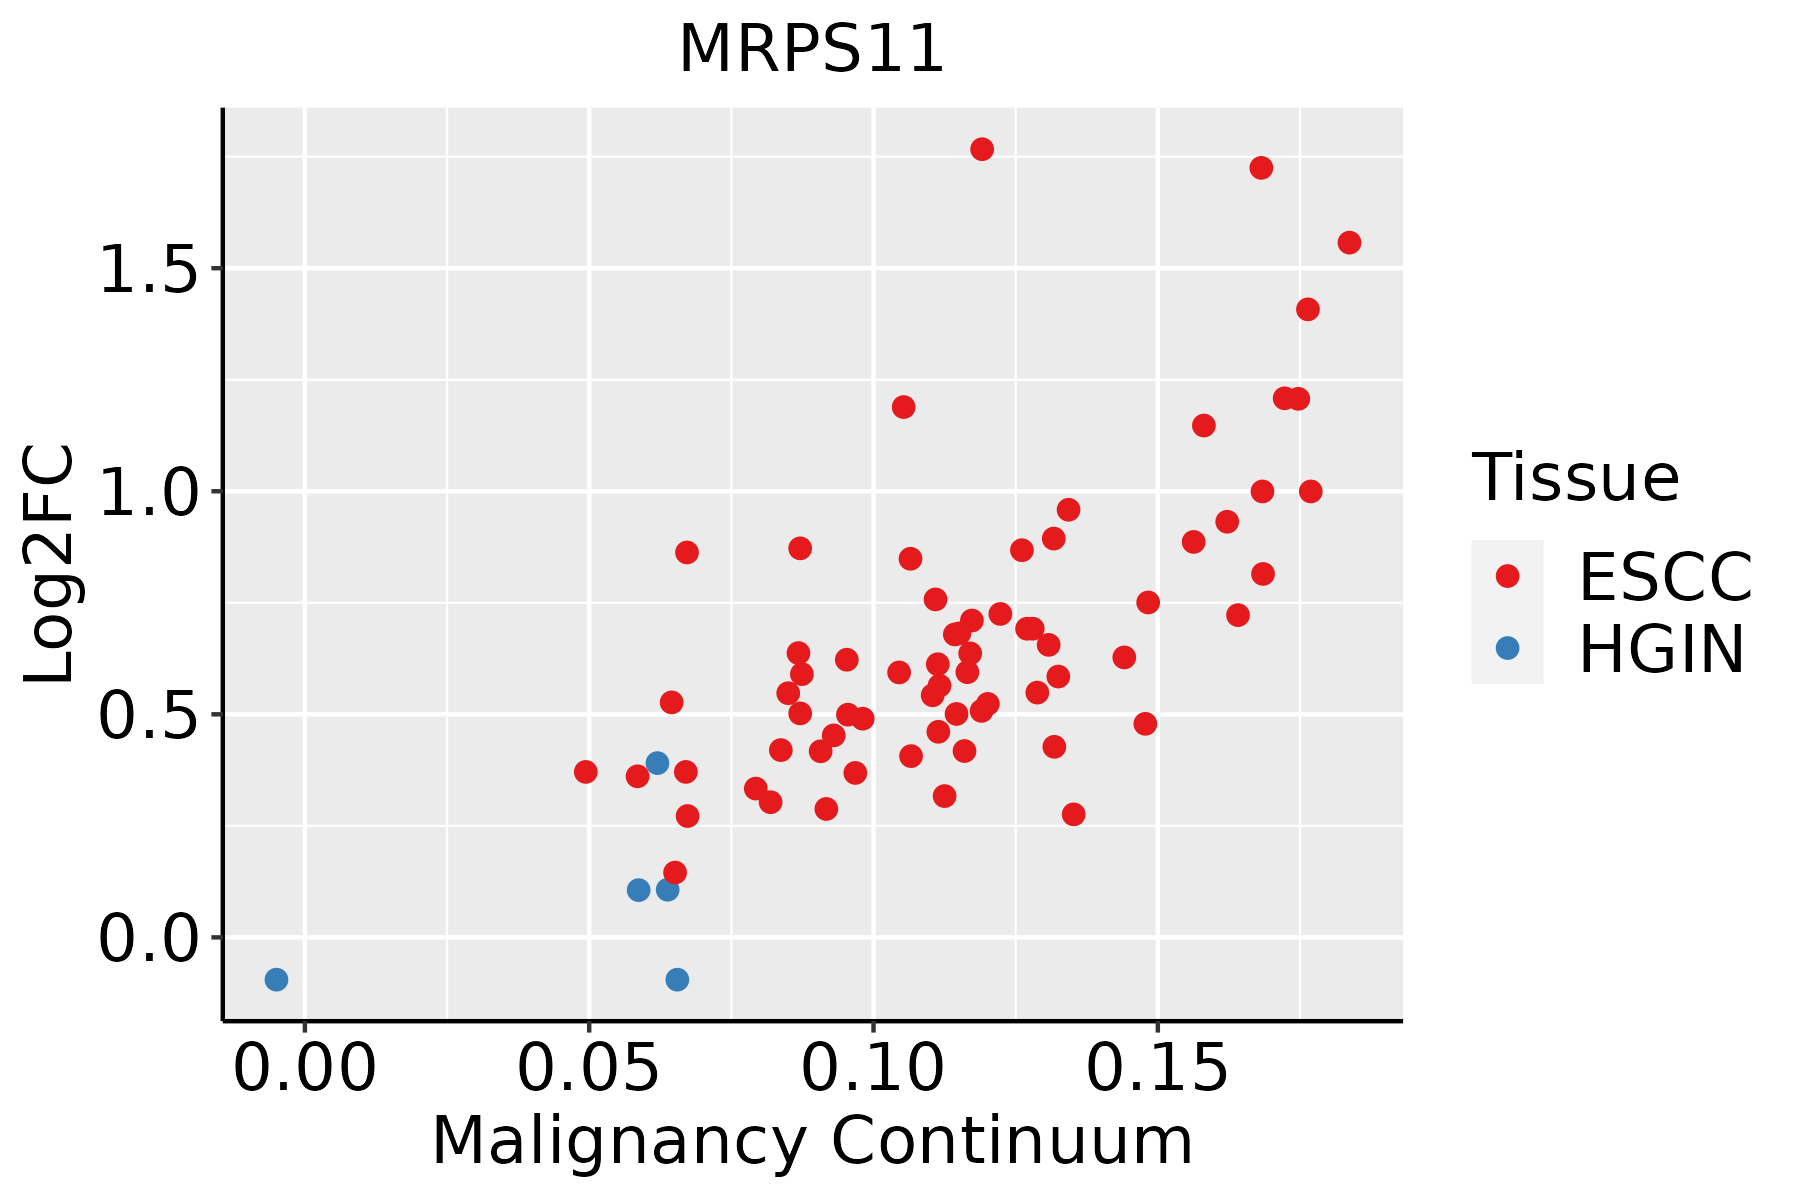 | ESCC: Esophageal squamous cell carcinoma |
| HGIN: High-grade intraepithelial neoplasias | ||
| LGIN: Low-grade intraepithelial neoplasias | ||
| Liver |  | HCC: Hepatocellular carcinoma |
| NAFLD: Non-alcoholic fatty liver disease | ||
| Oral Cavity |  | EOLP: Erosive Oral lichen planus |
| LP: leukoplakia | ||
| NEOLP: Non-erosive oral lichen planus | ||
| OSCC: Oral squamous cell carcinoma | ||
| Skin |  | AK: Actinic keratosis |
| cSCC: Cutaneous squamous cell carcinoma | ||
| SCCIS:squamous cell carcinoma in situ | ||
| Thyroid | 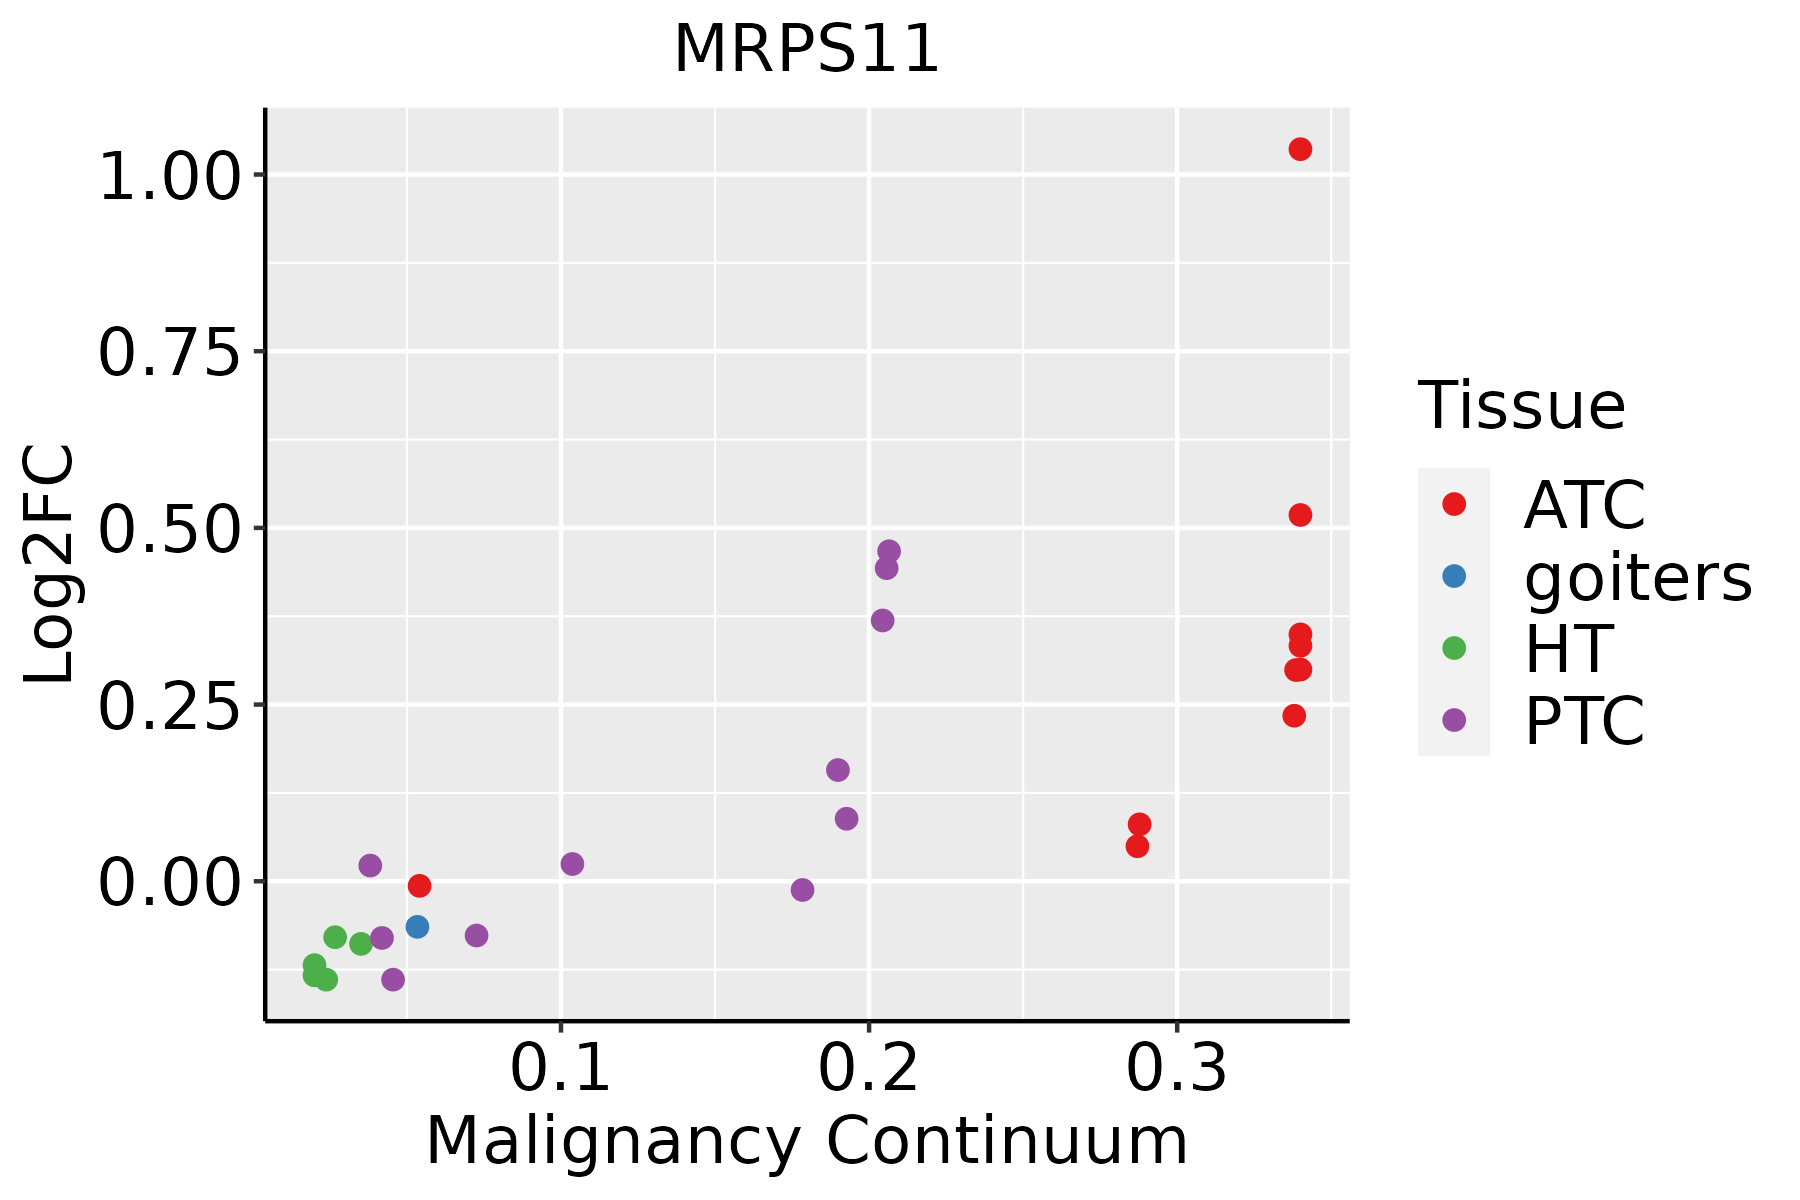 | ATC: Anaplastic thyroid cancer |
| HT: Hashimoto's thyroiditis | ||
| PTC: Papillary thyroid cancer |
| ∗log2FC in expression of this searched gene in stem-like cells from each diseased tissue sample relative to stem-like cells in normal samples in each tissue plotted against the malignancy continuum. Samples are colored based on if they are from different disease stage. |
Top |
Malignant transformation related pathway analysis |
| Find out the enriched GO biological processes and KEGG pathways involved in transition from healthy to precancer to cancer |
| Tissue | Disease Stage | Enriched GO biological Processes |
| Colorectum | AD |  |
| Colorectum | SER |  |
| Colorectum | MSS |  |
| Colorectum | MSI-H |  |
| Colorectum | FAP |  |
| ∗Top 15 enriched GO BP terms are showed in the bar plot of each disease state in each tissue. Each row represents a significant GO biological process which is colored according to the -log10(p.adjust). |
| Page: 1 2 3 4 5 6 7 8 9 |
| GO ID | Tissue | Disease Stage | Description | Gene Ratio | Bg Ratio | pvalue | p.adjust | Count |
| GO:007182612 | Liver | Cirrhotic | ribonucleoprotein complex subunit organization | 115/4634 | 227/18723 | 2.67e-17 | 3.63e-15 | 115 |
| GO:002261812 | Liver | Cirrhotic | ribonucleoprotein complex assembly | 112/4634 | 220/18723 | 4.35e-17 | 5.81e-15 | 112 |
| GO:00344701 | Liver | Cirrhotic | ncRNA processing | 158/4634 | 395/18723 | 1.09e-11 | 6.96e-10 | 158 |
| GO:004225512 | Liver | Cirrhotic | ribosome assembly | 39/4634 | 61/18723 | 1.07e-10 | 5.72e-09 | 39 |
| GO:004227412 | Liver | Cirrhotic | ribosomal small subunit biogenesis | 42/4634 | 73/18723 | 2.34e-09 | 9.73e-08 | 42 |
| GO:00346603 | Liver | Cirrhotic | ncRNA metabolic process | 173/4634 | 485/18723 | 3.64e-08 | 1.21e-06 | 173 |
| GO:000002812 | Liver | Cirrhotic | ribosomal small subunit assembly | 16/4634 | 19/18723 | 8.53e-08 | 2.51e-06 | 16 |
| GO:0032543 | Liver | Cirrhotic | mitochondrial translation | 40/4634 | 76/18723 | 1.61e-07 | 4.29e-06 | 40 |
| GO:0140053 | Liver | Cirrhotic | mitochondrial gene expression | 49/4634 | 108/18723 | 2.35e-06 | 4.31e-05 | 49 |
| GO:00427693 | Liver | Cirrhotic | DNA damage response, detection of DNA damage | 10/4634 | 13/18723 | 1.14e-04 | 1.14e-03 | 10 |
| GO:0030490 | Liver | Cirrhotic | maturation of SSU-rRNA | 24/4634 | 50/18723 | 3.06e-04 | 2.68e-03 | 24 |
| GO:0000462 | Liver | Cirrhotic | maturation of SSU-rRNA from tricistronic rRNA transcript (SSU-rRNA, 5.8S rRNA, LSU-rRNA) | 16/4634 | 37/18723 | 1.05e-02 | 4.65e-02 | 16 |
| GO:002261322 | Liver | HCC | ribonucleoprotein complex biogenesis | 355/7958 | 463/18723 | 7.76e-52 | 4.92e-48 | 355 |
| GO:004225422 | Liver | HCC | ribosome biogenesis | 246/7958 | 299/18723 | 4.99e-46 | 1.58e-42 | 246 |
| GO:00344702 | Liver | HCC | ncRNA processing | 293/7958 | 395/18723 | 4.26e-38 | 6.76e-35 | 293 |
| GO:001607212 | Liver | HCC | rRNA metabolic process | 193/7958 | 236/18723 | 1.26e-35 | 1.14e-32 | 193 |
| GO:000636421 | Liver | HCC | rRNA processing | 185/7958 | 225/18723 | 8.14e-35 | 6.45e-32 | 185 |
| GO:00346601 | Liver | HCC | ncRNA metabolic process | 332/7958 | 485/18723 | 1.48e-31 | 7.80e-29 | 332 |
| GO:007182622 | Liver | HCC | ribonucleoprotein complex subunit organization | 159/7958 | 227/18723 | 3.14e-17 | 3.06e-15 | 159 |
| GO:004227422 | Liver | HCC | ribosomal small subunit biogenesis | 65/7958 | 73/18723 | 1.09e-16 | 9.92e-15 | 65 |
| Page: 1 2 3 4 5 6 7 |
| Pathway ID | Tissue | Disease Stage | Description | Gene Ratio | Bg Ratio | pvalue | p.adjust | qvalue | Count |
| hsa03010211 | Esophagus | ESCC | Ribosome | 129/4205 | 167/8465 | 1.43e-13 | 3.43e-12 | 1.75e-12 | 129 |
| hsa03010310 | Esophagus | ESCC | Ribosome | 129/4205 | 167/8465 | 1.43e-13 | 3.43e-12 | 1.75e-12 | 129 |
| hsa0301022 | Liver | Cirrhotic | Ribosome | 127/2530 | 167/8465 | 2.12e-35 | 7.06e-33 | 4.35e-33 | 127 |
| hsa0301032 | Liver | Cirrhotic | Ribosome | 127/2530 | 167/8465 | 2.12e-35 | 7.06e-33 | 4.35e-33 | 127 |
| hsa0301042 | Liver | HCC | Ribosome | 128/4020 | 167/8465 | 7.32e-15 | 2.23e-13 | 1.24e-13 | 128 |
| hsa0301052 | Liver | HCC | Ribosome | 128/4020 | 167/8465 | 7.32e-15 | 2.23e-13 | 1.24e-13 | 128 |
| hsa0301030 | Oral cavity | OSCC | Ribosome | 128/3704 | 167/8465 | 2.42e-18 | 1.62e-16 | 8.25e-17 | 128 |
| hsa03010114 | Oral cavity | OSCC | Ribosome | 128/3704 | 167/8465 | 2.42e-18 | 1.62e-16 | 8.25e-17 | 128 |
| hsa03010210 | Oral cavity | LP | Ribosome | 127/2418 | 167/8465 | 1.22e-37 | 4.05e-35 | 2.61e-35 | 127 |
| hsa0301038 | Oral cavity | LP | Ribosome | 127/2418 | 167/8465 | 1.22e-37 | 4.05e-35 | 2.61e-35 | 127 |
| Page: 1 |
Top |
Cell-cell communication analysis |
| Identification of potential cell-cell interactions between two cell types and their ligand-receptor pairs for different disease states |
| Ligand | Receptor | LRpair | Pathway | Tissue | Disease Stage |
| Page: 1 |
Top |
Single-cell gene regulatory network inference analysis |
| Find out the significant the regulons (TFs) and the target genes of each regulon across cell types for different disease states |
| TF | Cell Type | Tissue | Disease Stage | Target Gene | RSS | Regulon Activity |
| ∗The dot plots of a searched regulon are shown for all cell subpopulations in each disease state of each tissue based on the regulon specific score inferred using pySCENIC and by calculating the average expression. |
| Page: 1 |
Top |
Somatic mutation of malignant transformation related genes |
| Annotation of somatic variants for genes involved in malignant transformation |
| Hugo Symbol | Variant Class | Variant Classification | dbSNP RS | HGVSc | HGVSp | HGVSp Short | SWISSPROT | BIOTYPE | SIFT | PolyPhen | Tumor Sample Barcode | Tissue | Histology | Sex | Age | Stage | Therapy Types | Drugs | Outcome |
| MRPS11 | insertion | Nonsense_Mutation | novel | c.149_150insCCCACCGCCTCTTGTATTTCCTTCTTAACATTCATC | p.Glu50delinsAspProProProLeuValPheProSerTerHisSerSer | p.E50delinsDPPPLVFPS*HSS | P82912 | protein_coding | TCGA-AN-A049-01 | Breast | breast invasive carcinoma | Female | <65 | I/II | Unknown | Unknown | SD | ||
| MRPS11 | SNV | Missense_Mutation | rs774896757 | c.353N>A | p.Arg118Gln | p.R118Q | P82912 | protein_coding | tolerated(0.14) | benign(0.188) | TCGA-AA-3877-01 | Colorectum | colon adenocarcinoma | Female | >=65 | I/II | Unknown | Unknown | SD |
| MRPS11 | SNV | Missense_Mutation | rs149047976 | c.352N>T | p.Arg118Trp | p.R118W | P82912 | protein_coding | deleterious(0) | probably_damaging(0.983) | TCGA-AA-3984-01 | Colorectum | colon adenocarcinoma | Female | <65 | I/II | Unknown | Unknown | SD |
| MRPS11 | SNV | Missense_Mutation | rs372417211 | c.490N>A | p.Gly164Arg | p.G164R | P82912 | protein_coding | deleterious(0) | probably_damaging(1) | TCGA-AD-6889-01 | Colorectum | colon adenocarcinoma | Male | >=65 | I/II | Chemotherapy | xeloda | PD |
| MRPS11 | SNV | Missense_Mutation | c.187T>C | p.Tyr63His | p.Y63H | P82912 | protein_coding | tolerated(0.12) | possibly_damaging(0.535) | TCGA-G4-6303-01 | Colorectum | colon adenocarcinoma | Female | <65 | III/IV | Chemotherapy | 5-fu | PD | |
| MRPS11 | SNV | Missense_Mutation | rs149047976 | c.352C>T | p.Arg118Trp | p.R118W | P82912 | protein_coding | deleterious(0) | probably_damaging(0.983) | TCGA-AJ-A5DW-01 | Endometrium | uterine corpus endometrioid carcinoma | Female | <65 | I/II | Unknown | Unknown | SD |
| MRPS11 | SNV | Missense_Mutation | c.305N>A | p.Ala102Asp | p.A102D | P82912 | protein_coding | tolerated(0.22) | possibly_damaging(0.521) | TCGA-AP-A059-01 | Endometrium | uterine corpus endometrioid carcinoma | Female | >=65 | I/II | Unknown | Unknown | SD | |
| MRPS11 | SNV | Missense_Mutation | novel | c.152N>G | p.Gln51Arg | p.Q51R | P82912 | protein_coding | tolerated(0.18) | benign(0) | TCGA-AP-A1DK-01 | Endometrium | uterine corpus endometrioid carcinoma | Female | <65 | I/II | Unknown | Unknown | SD |
| MRPS11 | SNV | Missense_Mutation | rs372417211 | c.490N>A | p.Gly164Arg | p.G164R | P82912 | protein_coding | deleterious(0) | probably_damaging(1) | TCGA-AX-A1C5-01 | Endometrium | uterine corpus endometrioid carcinoma | Female | <65 | III/IV | Unspecific | Carboplatin | SD |
| MRPS11 | SNV | Missense_Mutation | novel | c.578N>C | p.Lys193Thr | p.K193T | P82912 | protein_coding | deleterious(0) | benign(0.105) | TCGA-BG-A220-01 | Endometrium | uterine corpus endometrioid carcinoma | Female | >=65 | I/II | Unknown | Unknown | SD |
| Page: 1 2 |
Top |
Related drugs of malignant transformation related genes |
| Identification of chemicals and drugs interact with genes involved in malignant transfromation |
| (DGIdb 4.0) |
| Entrez ID | Symbol | Category | Interaction Types | Drug Claim Name | Drug Name | PMIDs |
| Page: 1 |

Copyright 2023-Present -The University of Texas Health Science Center at Houston |