
|
|||||
|
 | |
| |
| |
| |
| |
| |
|
Gene: MMS19 |
Gene summary for MMS19 |
| Gene information | Species | Human | Gene symbol | MMS19 | Gene ID | 64210 |
| Gene name | MMS19 homolog, cytosolic iron-sulfur assembly component | |
| Gene Alias | CIAO4 | |
| Cytomap | 10q24.1 | |
| Gene Type | protein-coding | GO ID | GO:0000018 | UniProtAcc | Q96T76 |
Top |
Malignant transformation analysis |
| Identification of the aberrant gene expression in precancerous and cancerous lesions by comparing the gene expression of stem-like cells in diseased tissues with normal stem cells |
| Entrez ID | Symbol | Replicates | Species | Organ | Tissue | Adj P-value | Log2FC | Malignancy |
| 64210 | MMS19 | LZE4T | Human | Esophagus | ESCC | 2.25e-02 | 8.88e-02 | 0.0811 |
| 64210 | MMS19 | LZE8T | Human | Esophagus | ESCC | 2.53e-07 | 1.27e-01 | 0.067 |
| 64210 | MMS19 | LZE24T | Human | Esophagus | ESCC | 6.69e-13 | 2.87e-01 | 0.0596 |
| 64210 | MMS19 | P1T-E | Human | Esophagus | ESCC | 3.19e-02 | 9.16e-02 | 0.0875 |
| 64210 | MMS19 | P2T-E | Human | Esophagus | ESCC | 6.02e-24 | 2.72e-01 | 0.1177 |
| 64210 | MMS19 | P4T-E | Human | Esophagus | ESCC | 3.02e-13 | 2.78e-01 | 0.1323 |
| 64210 | MMS19 | P5T-E | Human | Esophagus | ESCC | 1.08e-08 | 1.36e-01 | 0.1327 |
| 64210 | MMS19 | P8T-E | Human | Esophagus | ESCC | 4.64e-15 | 2.28e-01 | 0.0889 |
| 64210 | MMS19 | P9T-E | Human | Esophagus | ESCC | 5.58e-06 | 1.35e-01 | 0.1131 |
| 64210 | MMS19 | P10T-E | Human | Esophagus | ESCC | 7.84e-11 | 7.56e-02 | 0.116 |
| 64210 | MMS19 | P11T-E | Human | Esophagus | ESCC | 1.35e-06 | 2.07e-01 | 0.1426 |
| 64210 | MMS19 | P12T-E | Human | Esophagus | ESCC | 4.01e-25 | 3.87e-01 | 0.1122 |
| 64210 | MMS19 | P15T-E | Human | Esophagus | ESCC | 4.24e-19 | 3.70e-01 | 0.1149 |
| 64210 | MMS19 | P16T-E | Human | Esophagus | ESCC | 1.90e-25 | 3.76e-01 | 0.1153 |
| 64210 | MMS19 | P17T-E | Human | Esophagus | ESCC | 5.50e-03 | 2.11e-01 | 0.1278 |
| 64210 | MMS19 | P19T-E | Human | Esophagus | ESCC | 5.26e-09 | 3.89e-01 | 0.1662 |
| 64210 | MMS19 | P20T-E | Human | Esophagus | ESCC | 7.98e-10 | 1.83e-01 | 0.1124 |
| 64210 | MMS19 | P21T-E | Human | Esophagus | ESCC | 1.84e-17 | 2.61e-01 | 0.1617 |
| 64210 | MMS19 | P22T-E | Human | Esophagus | ESCC | 1.79e-09 | 1.20e-01 | 0.1236 |
| 64210 | MMS19 | P23T-E | Human | Esophagus | ESCC | 7.55e-18 | 3.58e-01 | 0.108 |
| Page: 1 2 3 4 |
| Tissue | Expression Dynamics | Abbreviation |
| Esophagus |  | ESCC: Esophageal squamous cell carcinoma |
| HGIN: High-grade intraepithelial neoplasias | ||
| LGIN: Low-grade intraepithelial neoplasias | ||
| Liver |  | HCC: Hepatocellular carcinoma |
| NAFLD: Non-alcoholic fatty liver disease | ||
| Oral Cavity | 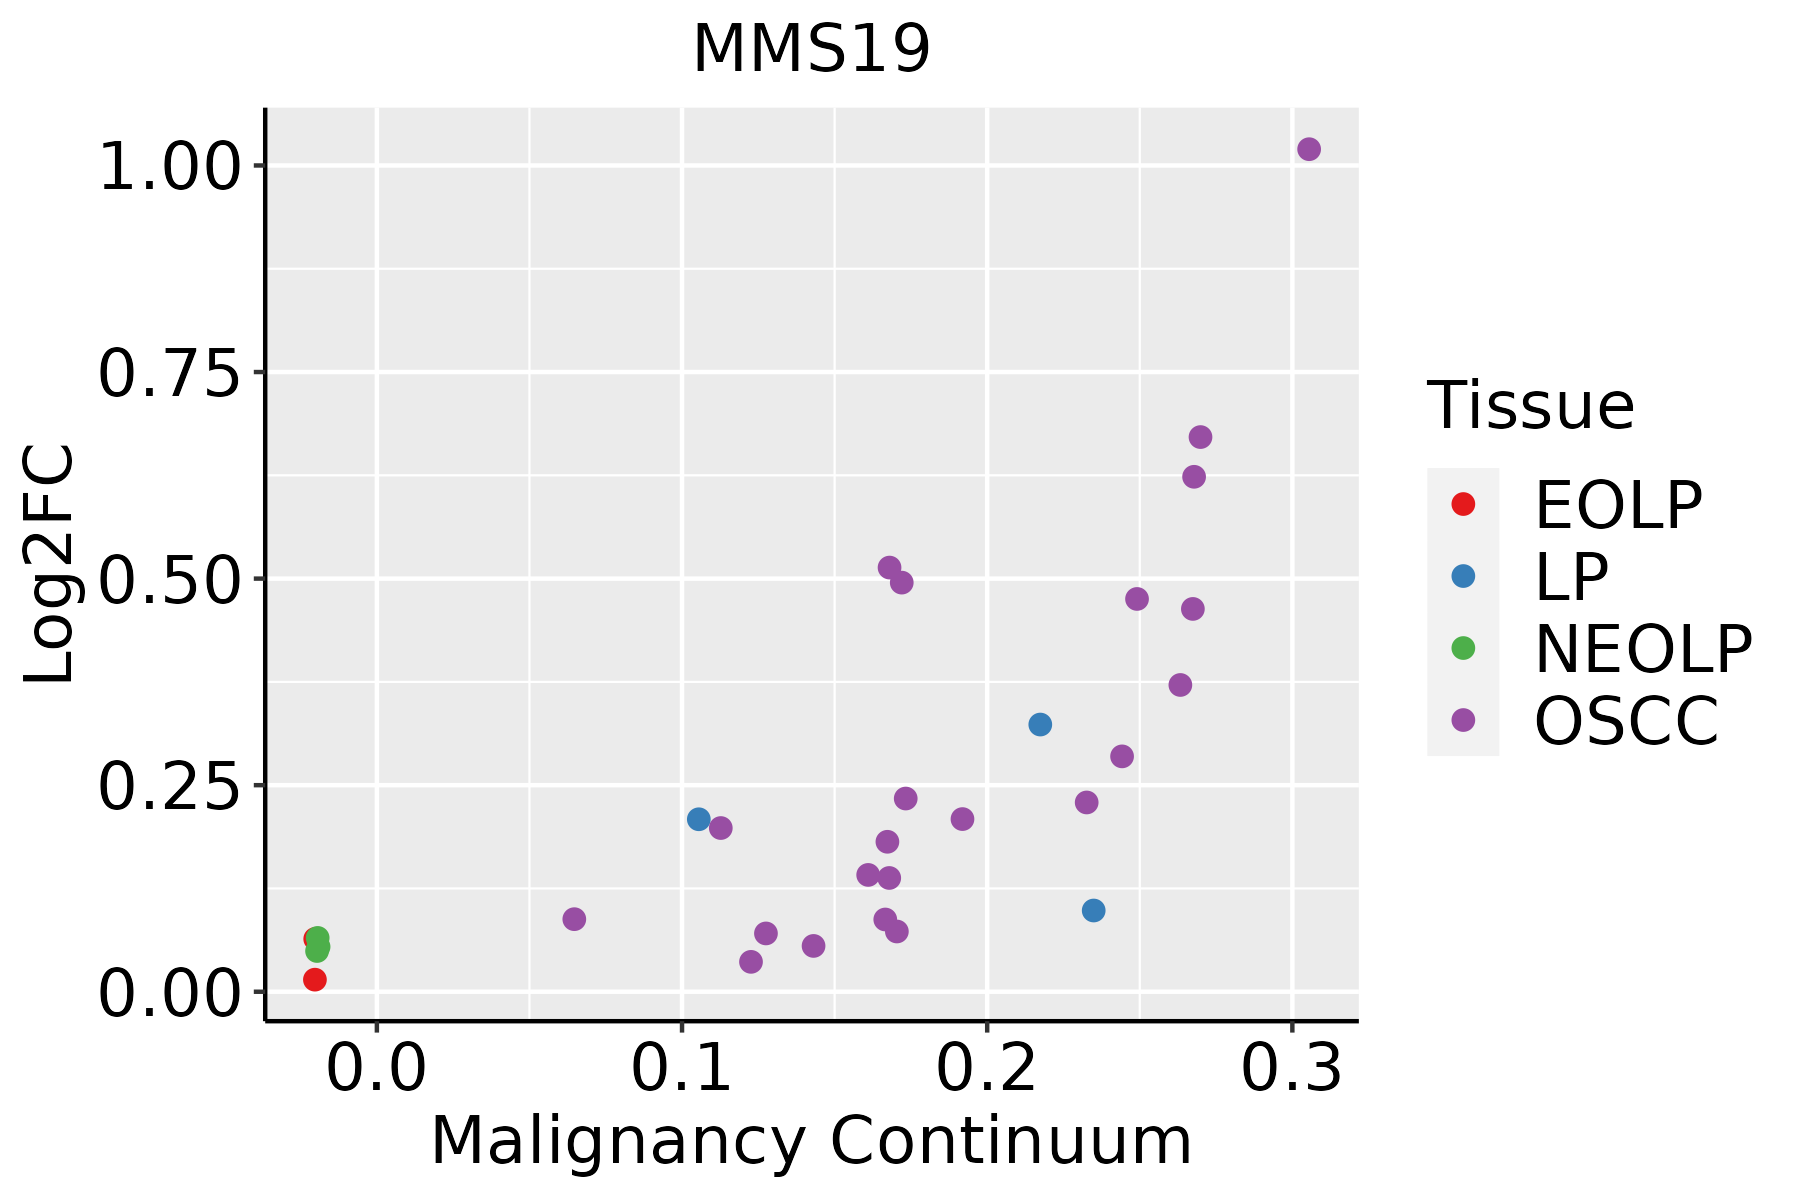 | EOLP: Erosive Oral lichen planus |
| LP: leukoplakia | ||
| NEOLP: Non-erosive oral lichen planus | ||
| OSCC: Oral squamous cell carcinoma |
| ∗log2FC in expression of this searched gene in stem-like cells from each diseased tissue sample relative to stem-like cells in normal samples in each tissue plotted against the malignancy continuum. Samples are colored based on if they are from different disease stage. |
Top |
Malignant transformation related pathway analysis |
| Find out the enriched GO biological processes and KEGG pathways involved in transition from healthy to precancer to cancer |
| Tissue | Disease Stage | Enriched GO biological Processes |
| Colorectum | AD |  |
| Colorectum | SER |  |
| Colorectum | MSS |  |
| Colorectum | MSI-H |  |
| Colorectum | FAP |  |
| ∗Top 15 enriched GO BP terms are showed in the bar plot of each disease state in each tissue. Each row represents a significant GO biological process which is colored according to the -log10(p.adjust). |
| Page: 1 2 3 4 5 6 7 8 9 |
| GO ID | Tissue | Disease Stage | Description | Gene Ratio | Bg Ratio | pvalue | p.adjust | Count |
| GO:0007059 | Liver | HCC | chromosome segregation | 197/7958 | 346/18723 | 3.57e-08 | 7.87e-07 | 197 |
| GO:005160412 | Liver | HCC | protein maturation | 171/7958 | 294/18723 | 3.80e-08 | 8.30e-07 | 171 |
| GO:005105221 | Liver | HCC | regulation of DNA metabolic process | 198/7958 | 359/18723 | 7.62e-07 | 1.17e-05 | 198 |
| GO:200102021 | Liver | HCC | regulation of response to DNA damage stimulus | 128/7958 | 219/18723 | 1.31e-06 | 1.90e-05 | 128 |
| GO:005105411 | Liver | HCC | positive regulation of DNA metabolic process | 113/7958 | 201/18723 | 5.76e-05 | 5.33e-04 | 113 |
| GO:200102211 | Liver | HCC | positive regulation of response to DNA damage stimulus | 64/7958 | 105/18723 | 1.03e-04 | 8.88e-04 | 64 |
| GO:00062824 | Liver | HCC | regulation of DNA repair | 74/7958 | 130/18723 | 6.27e-04 | 3.89e-03 | 74 |
| GO:00063021 | Liver | HCC | double-strand break repair | 131/7958 | 251/18723 | 1.17e-03 | 6.54e-03 | 131 |
| GO:00457393 | Liver | HCC | positive regulation of DNA repair | 43/7958 | 73/18723 | 3.43e-03 | 1.55e-02 | 43 |
| GO:0016226 | Liver | HCC | iron-sulfur cluster assembly | 18/7958 | 26/18723 | 5.37e-03 | 2.24e-02 | 18 |
| GO:0031163 | Liver | HCC | metallo-sulfur cluster assembly | 18/7958 | 26/18723 | 5.37e-03 | 2.24e-02 | 18 |
| GO:2000779 | Liver | HCC | regulation of double-strand break repair | 47/7958 | 85/18723 | 1.17e-02 | 4.28e-02 | 47 |
| GO:00070592 | Oral cavity | OSCC | chromosome segregation | 206/7305 | 346/18723 | 5.82e-15 | 3.76e-13 | 206 |
| GO:005105210 | Oral cavity | OSCC | regulation of DNA metabolic process | 207/7305 | 359/18723 | 4.45e-13 | 2.17e-11 | 207 |
| GO:005105414 | Oral cavity | OSCC | positive regulation of DNA metabolic process | 126/7305 | 201/18723 | 8.12e-12 | 3.01e-10 | 126 |
| GO:005160410 | Oral cavity | OSCC | protein maturation | 170/7305 | 294/18723 | 3.97e-11 | 1.28e-09 | 170 |
| GO:200102017 | Oral cavity | OSCC | regulation of response to DNA damage stimulus | 131/7305 | 219/18723 | 3.21e-10 | 8.72e-09 | 131 |
| GO:00063023 | Oral cavity | OSCC | double-strand break repair | 132/7305 | 251/18723 | 7.93e-06 | 8.52e-05 | 132 |
| GO:20010227 | Oral cavity | OSCC | positive regulation of response to DNA damage stimulus | 63/7305 | 105/18723 | 1.05e-05 | 1.11e-04 | 63 |
| GO:00062825 | Oral cavity | OSCC | regulation of DNA repair | 75/7305 | 130/18723 | 1.19e-05 | 1.21e-04 | 75 |
| Page: 1 2 3 |
| Pathway ID | Tissue | Disease Stage | Description | Gene Ratio | Bg Ratio | pvalue | p.adjust | qvalue | Count |
| Page: 1 |
Top |
Cell-cell communication analysis |
| Identification of potential cell-cell interactions between two cell types and their ligand-receptor pairs for different disease states |
| Ligand | Receptor | LRpair | Pathway | Tissue | Disease Stage |
| Page: 1 |
Top |
Single-cell gene regulatory network inference analysis |
| Find out the significant the regulons (TFs) and the target genes of each regulon across cell types for different disease states |
| TF | Cell Type | Tissue | Disease Stage | Target Gene | RSS | Regulon Activity |
| ∗The dot plots of a searched regulon are shown for all cell subpopulations in each disease state of each tissue based on the regulon specific score inferred using pySCENIC and by calculating the average expression. |
| Page: 1 |
Top |
Somatic mutation of malignant transformation related genes |
| Annotation of somatic variants for genes involved in malignant transformation |
| Hugo Symbol | Variant Class | Variant Classification | dbSNP RS | HGVSc | HGVSp | HGVSp Short | SWISSPROT | BIOTYPE | SIFT | PolyPhen | Tumor Sample Barcode | Tissue | Histology | Sex | Age | Stage | Therapy Types | Drugs | Outcome |
| MMS19 | SNV | Missense_Mutation | c.2980N>G | p.Pro994Ala | p.P994A | Q96T76 | protein_coding | tolerated(1) | benign(0) | TCGA-A8-A08L-01 | Breast | breast invasive carcinoma | Female | >=65 | III/IV | Unknown | Unknown | SD | |
| MMS19 | SNV | Missense_Mutation | rs756307565 | c.2575N>A | p.Glu859Lys | p.E859K | Q96T76 | protein_coding | tolerated(0.16) | benign(0.003) | TCGA-AN-A046-01 | Breast | breast invasive carcinoma | Female | >=65 | I/II | Unknown | Unknown | SD |
| MMS19 | SNV | Missense_Mutation | novel | c.781N>T | p.Pro261Ser | p.P261S | Q96T76 | protein_coding | deleterious(0.04) | probably_damaging(1) | TCGA-AN-A046-01 | Breast | breast invasive carcinoma | Female | >=65 | I/II | Unknown | Unknown | SD |
| MMS19 | SNV | Missense_Mutation | c.2399N>T | p.Thr800Ile | p.T800I | Q96T76 | protein_coding | deleterious(0.02) | benign(0.131) | TCGA-AR-A0TU-01 | Breast | breast invasive carcinoma | Female | <65 | I/II | Unspecific | Doxorubicin | SD | |
| MMS19 | insertion | Frame_Shift_Ins | novel | c.209_210insT | p.Gln70HisfsTer27 | p.Q70Hfs*27 | Q96T76 | protein_coding | TCGA-BH-A0BD-01 | Breast | breast invasive carcinoma | Female | <65 | I/II | Chemotherapy | doxorubicin | SD | ||
| MMS19 | insertion | Nonsense_Mutation | novel | c.208_209insCCTTGACATAACTGGG | p.Gln70ProfsTer4 | p.Q70Pfs*4 | Q96T76 | protein_coding | TCGA-BH-A0BD-01 | Breast | breast invasive carcinoma | Female | <65 | I/II | Chemotherapy | doxorubicin | SD | ||
| MMS19 | SNV | Missense_Mutation | novel | c.2401N>G | p.Leu801Val | p.L801V | Q96T76 | protein_coding | tolerated(0.07) | benign(0.119) | TCGA-C5-A2LZ-01 | Cervix | cervical & endocervical cancer | Female | >=65 | III/IV | Unknown | Unknown | PD |
| MMS19 | SNV | Missense_Mutation | c.952N>A | p.Glu318Lys | p.E318K | Q96T76 | protein_coding | deleterious(0) | probably_damaging(0.954) | TCGA-EK-A2PG-01 | Cervix | cervical & endocervical cancer | Female | >=65 | I/II | Unknown | Unknown | SD | |
| MMS19 | SNV | Missense_Mutation | c.1988N>T | p.Thr663Ile | p.T663I | Q96T76 | protein_coding | tolerated(0.08) | possibly_damaging(0.572) | TCGA-AA-3688-01 | Colorectum | colon adenocarcinoma | Male | >=65 | III/IV | Unknown | Unknown | SD | |
| MMS19 | SNV | Missense_Mutation | novel | c.2391G>T | p.Gln797His | p.Q797H | Q96T76 | protein_coding | deleterious(0) | benign(0.219) | TCGA-AA-3947-01 | Colorectum | colon adenocarcinoma | Female | <65 | I/II | Unknown | Unknown | SD |
| Page: 1 2 3 4 5 6 7 8 |
Top |
Related drugs of malignant transformation related genes |
| Identification of chemicals and drugs interact with genes involved in malignant transfromation |
| (DGIdb 4.0) |
| Entrez ID | Symbol | Category | Interaction Types | Drug Claim Name | Drug Name | PMIDs |
| Page: 1 |

Copyright 2023-Present -The University of Texas Health Science Center at Houston |