
|
|||||
|
 | |
| |
| |
| |
| |
| |
|
Gene: MLX |
Gene summary for MLX |
| Gene information | Species | Human | Gene symbol | MLX | Gene ID | 6945 |
| Gene name | MAX dimerization protein MLX | |
| Gene Alias | MAD7 | |
| Cytomap | 17q21.2 | |
| Gene Type | protein-coding | GO ID | GO:0000122 | UniProtAcc | Q9UH92 |
Top |
Malignant transformation analysis |
| Identification of the aberrant gene expression in precancerous and cancerous lesions by comparing the gene expression of stem-like cells in diseased tissues with normal stem cells |
| Entrez ID | Symbol | Replicates | Species | Organ | Tissue | Adj P-value | Log2FC | Malignancy |
| 6945 | MLX | LZE4T | Human | Esophagus | ESCC | 2.72e-10 | 3.80e-01 | 0.0811 |
| 6945 | MLX | LZE5T | Human | Esophagus | ESCC | 1.65e-03 | 2.63e-01 | 0.0514 |
| 6945 | MLX | LZE7T | Human | Esophagus | ESCC | 9.11e-12 | 5.60e-01 | 0.0667 |
| 6945 | MLX | LZE8T | Human | Esophagus | ESCC | 4.26e-08 | 2.50e-01 | 0.067 |
| 6945 | MLX | LZE20T | Human | Esophagus | ESCC | 8.50e-06 | 1.03e-01 | 0.0662 |
| 6945 | MLX | LZE22T | Human | Esophagus | ESCC | 1.44e-02 | 4.81e-01 | 0.068 |
| 6945 | MLX | LZE24T | Human | Esophagus | ESCC | 1.63e-36 | 9.69e-01 | 0.0596 |
| 6945 | MLX | LZE6T | Human | Esophagus | ESCC | 9.20e-13 | 4.03e-01 | 0.0845 |
| 6945 | MLX | P1T-E | Human | Esophagus | ESCC | 5.41e-17 | 6.50e-01 | 0.0875 |
| 6945 | MLX | P2T-E | Human | Esophagus | ESCC | 1.77e-27 | 5.74e-01 | 0.1177 |
| 6945 | MLX | P4T-E | Human | Esophagus | ESCC | 3.46e-41 | 9.25e-01 | 0.1323 |
| 6945 | MLX | P5T-E | Human | Esophagus | ESCC | 4.85e-36 | 8.36e-01 | 0.1327 |
| 6945 | MLX | P8T-E | Human | Esophagus | ESCC | 1.73e-25 | 5.87e-01 | 0.0889 |
| 6945 | MLX | P9T-E | Human | Esophagus | ESCC | 5.28e-23 | 5.43e-01 | 0.1131 |
| 6945 | MLX | P10T-E | Human | Esophagus | ESCC | 1.10e-13 | 2.43e-01 | 0.116 |
| 6945 | MLX | P11T-E | Human | Esophagus | ESCC | 4.40e-18 | 7.10e-01 | 0.1426 |
| 6945 | MLX | P12T-E | Human | Esophagus | ESCC | 1.01e-25 | 5.76e-01 | 0.1122 |
| 6945 | MLX | P15T-E | Human | Esophagus | ESCC | 3.57e-41 | 8.93e-01 | 0.1149 |
| 6945 | MLX | P16T-E | Human | Esophagus | ESCC | 1.84e-30 | 6.61e-01 | 0.1153 |
| 6945 | MLX | P17T-E | Human | Esophagus | ESCC | 3.86e-12 | 6.65e-01 | 0.1278 |
| Page: 1 2 3 4 5 6 |
| Tissue | Expression Dynamics | Abbreviation |
| Esophagus |  | ESCC: Esophageal squamous cell carcinoma |
| HGIN: High-grade intraepithelial neoplasias | ||
| LGIN: Low-grade intraepithelial neoplasias | ||
| Liver | 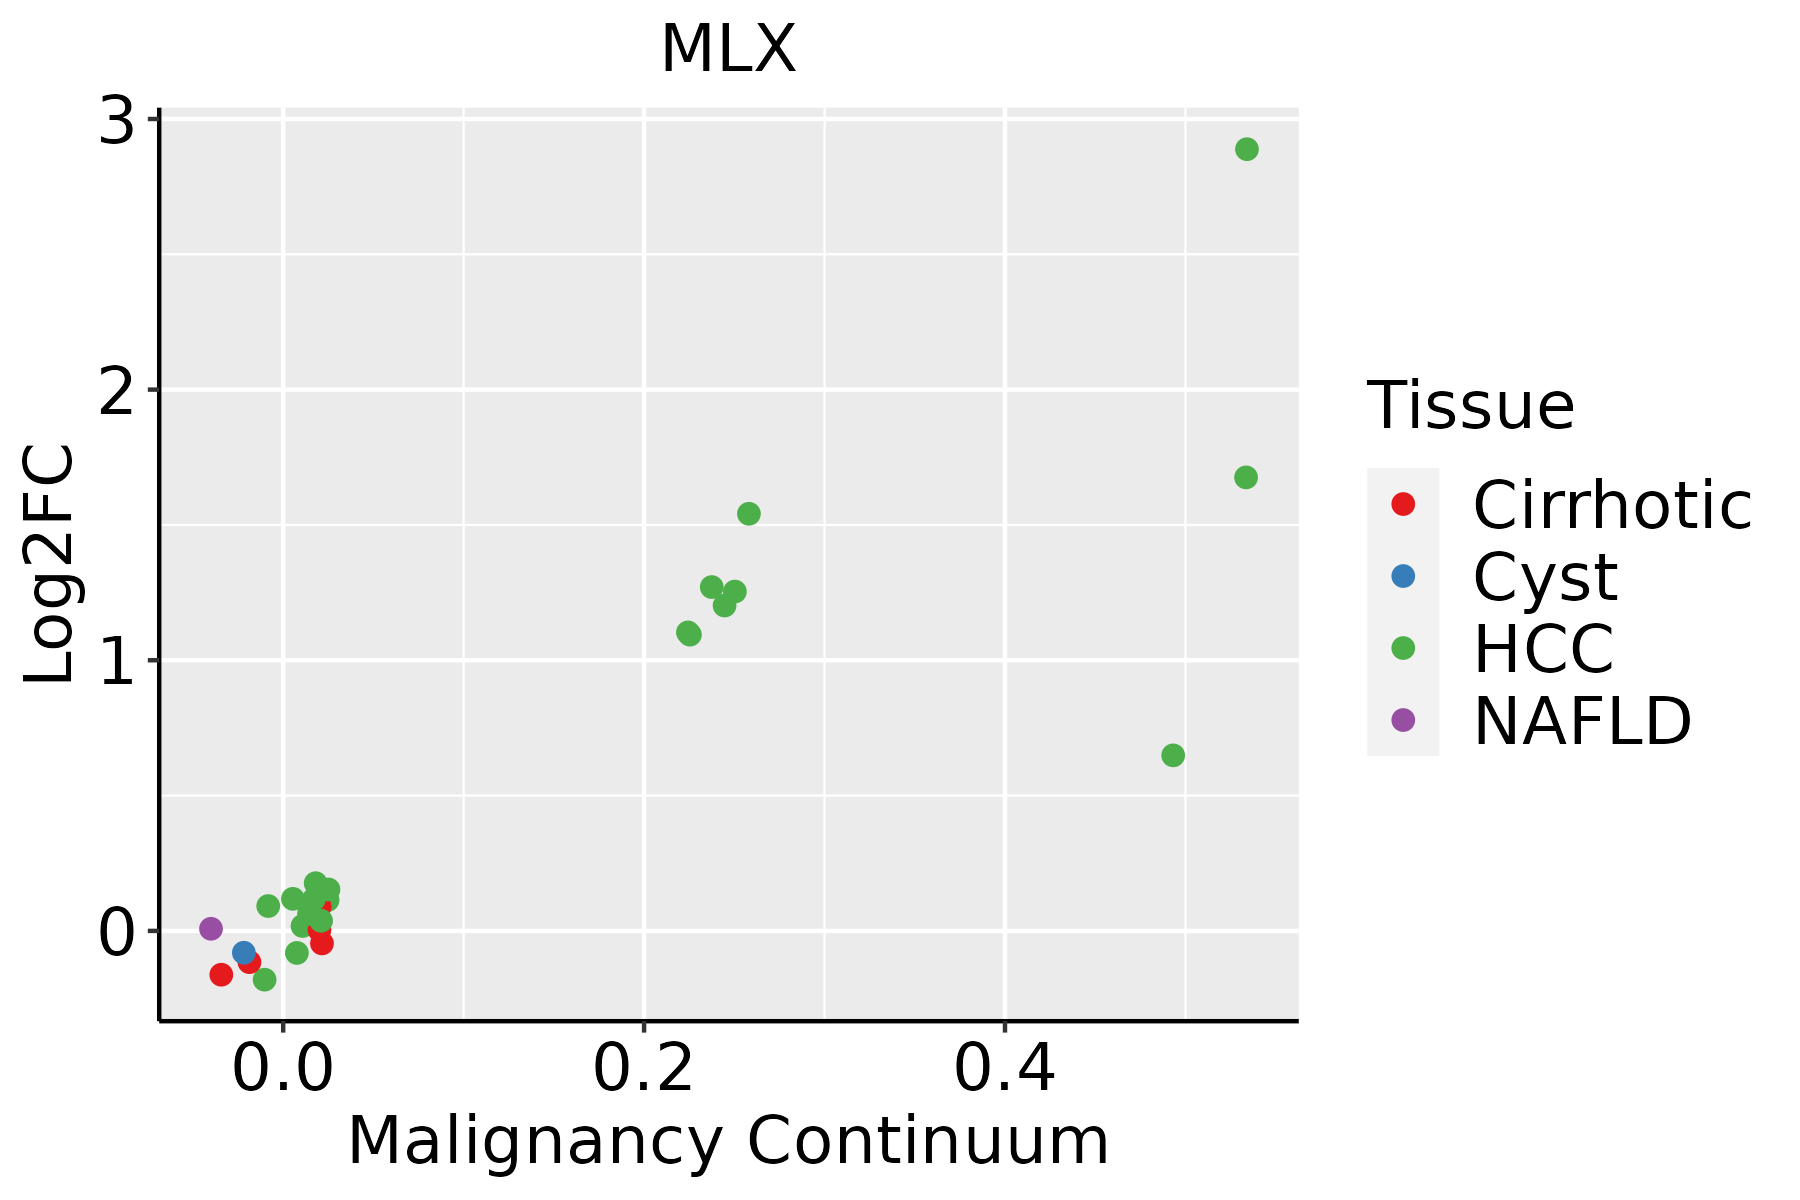 | HCC: Hepatocellular carcinoma |
| NAFLD: Non-alcoholic fatty liver disease | ||
| Oral Cavity | 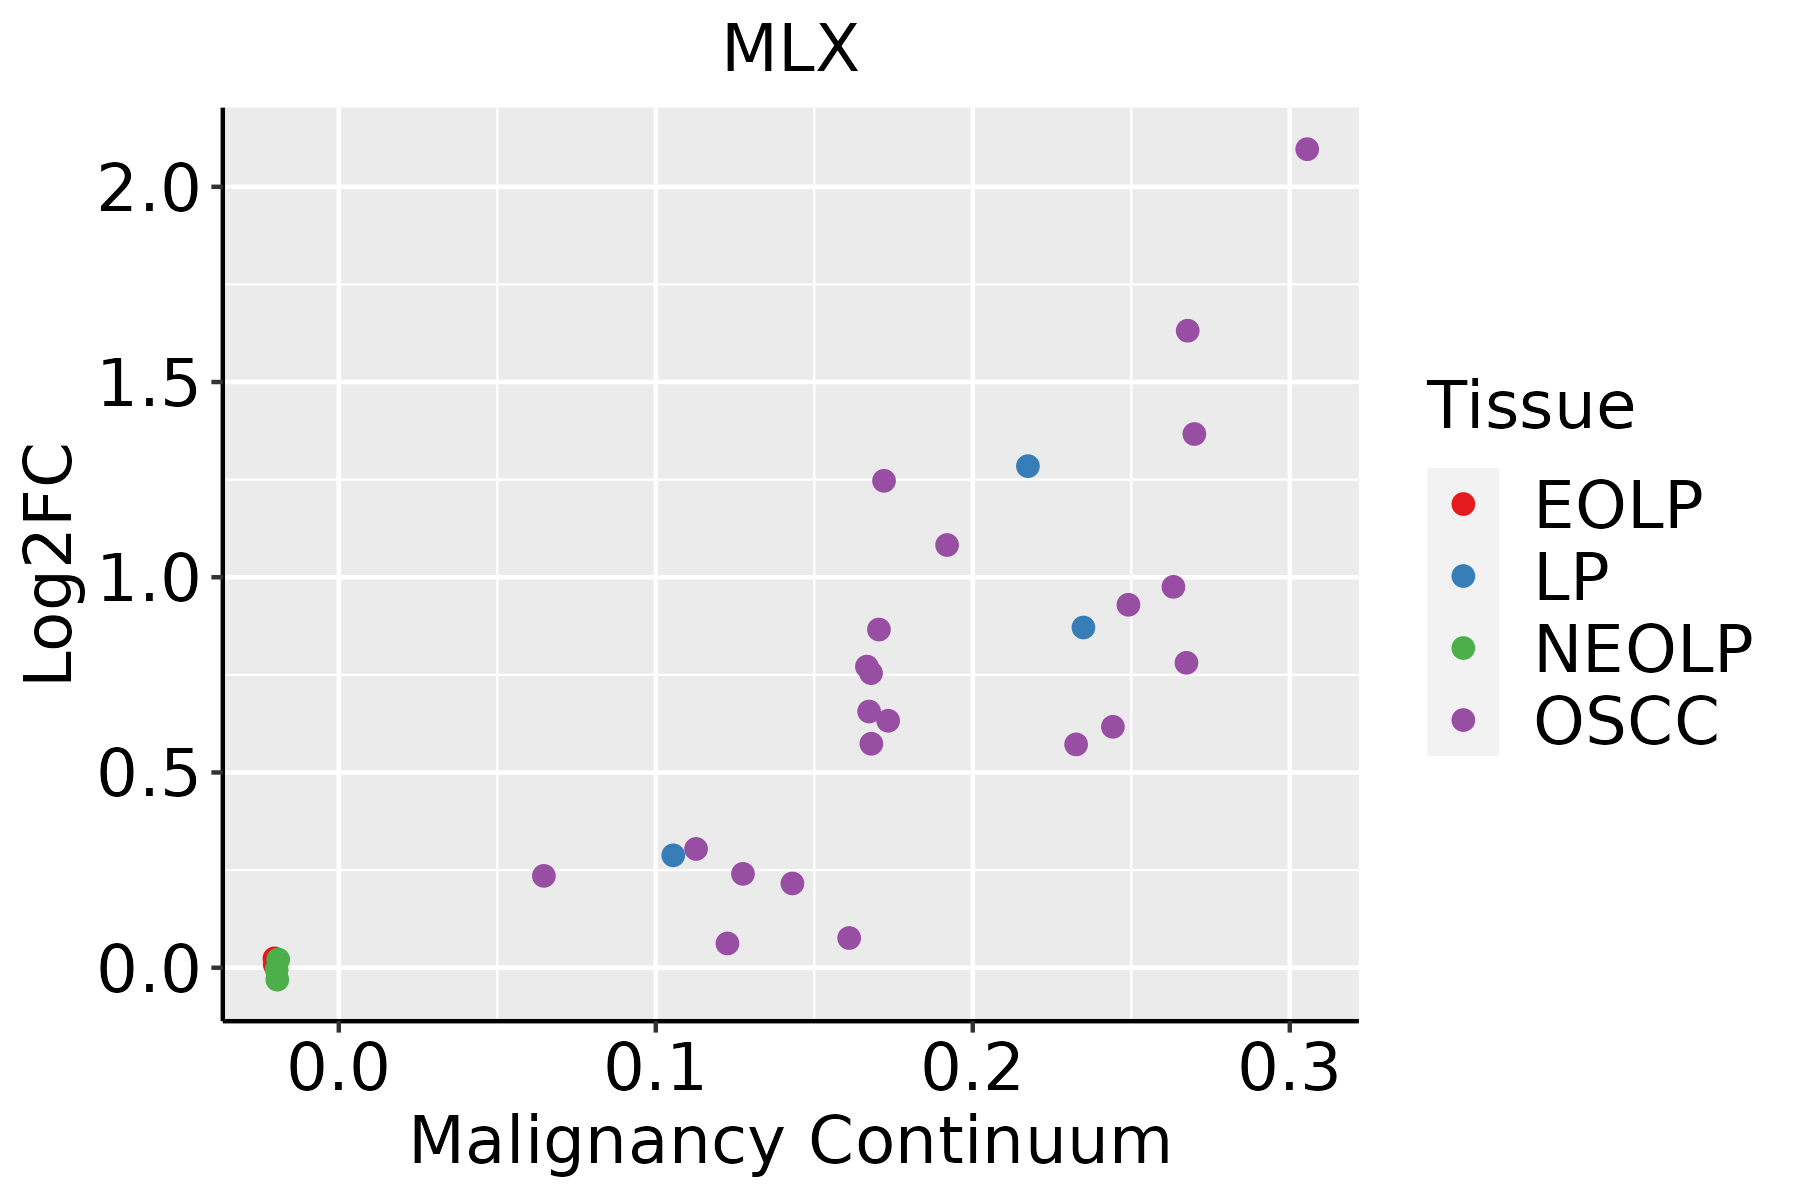 | EOLP: Erosive Oral lichen planus |
| LP: leukoplakia | ||
| NEOLP: Non-erosive oral lichen planus | ||
| OSCC: Oral squamous cell carcinoma | ||
| Skin |  | AK: Actinic keratosis |
| cSCC: Cutaneous squamous cell carcinoma | ||
| SCCIS:squamous cell carcinoma in situ | ||
| Thyroid | 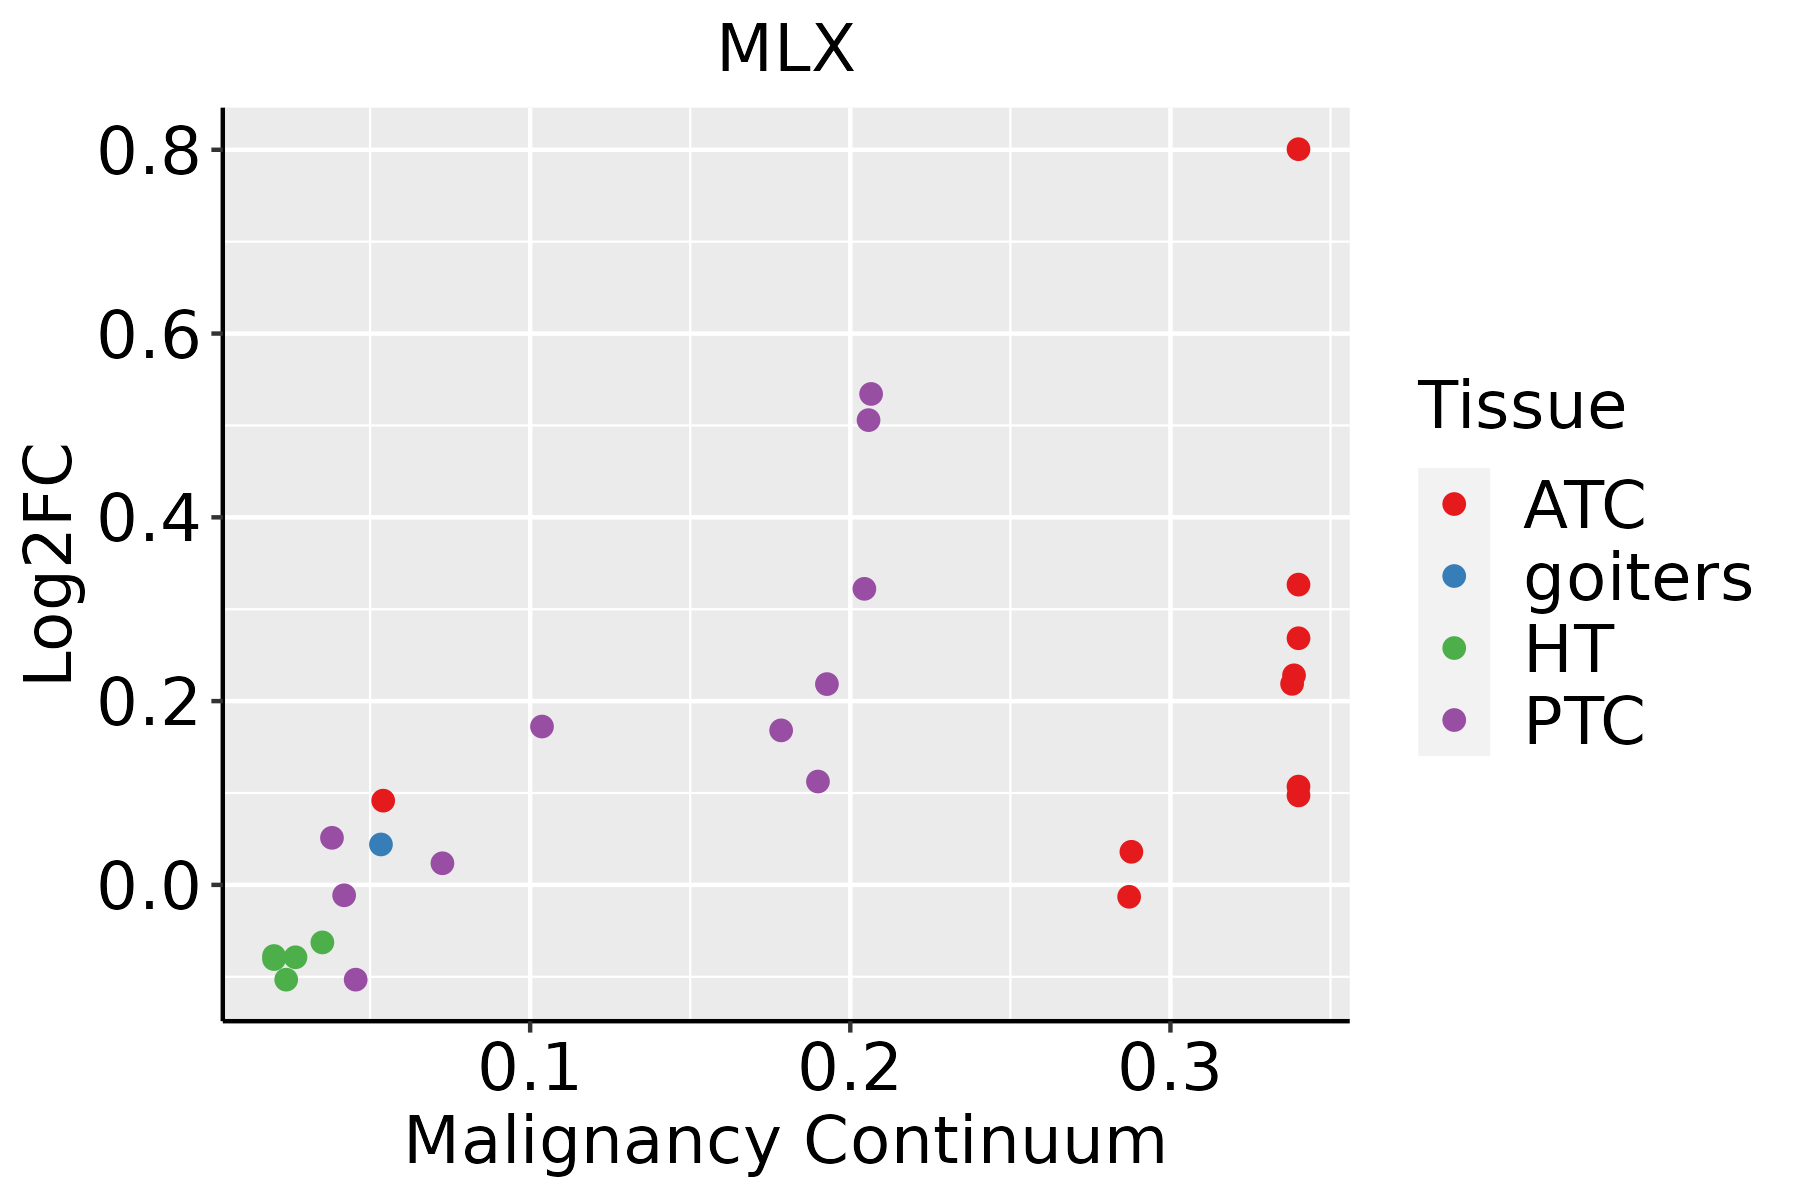 | ATC: Anaplastic thyroid cancer |
| HT: Hashimoto's thyroiditis | ||
| PTC: Papillary thyroid cancer |
| ∗log2FC in expression of this searched gene in stem-like cells from each diseased tissue sample relative to stem-like cells in normal samples in each tissue plotted against the malignancy continuum. Samples are colored based on if they are from different disease stage. |
Top |
Malignant transformation related pathway analysis |
| Find out the enriched GO biological processes and KEGG pathways involved in transition from healthy to precancer to cancer |
| Tissue | Disease Stage | Enriched GO biological Processes |
| Colorectum | AD |  |
| Colorectum | SER |  |
| Colorectum | MSS |  |
| Colorectum | MSI-H |  |
| Colorectum | FAP |  |
| ∗Top 15 enriched GO BP terms are showed in the bar plot of each disease state in each tissue. Each row represents a significant GO biological process which is colored according to the -log10(p.adjust). |
| Page: 1 2 3 4 5 6 7 8 9 |
| GO ID | Tissue | Disease Stage | Description | Gene Ratio | Bg Ratio | pvalue | p.adjust | Count |
| GO:0006096 | Colorectum | AD | glycolytic process | 38/3918 | 81/18723 | 1.52e-07 | 6.78e-06 | 38 |
| GO:0006757 | Colorectum | AD | ATP generation from ADP | 38/3918 | 82/18723 | 2.26e-07 | 9.37e-06 | 38 |
| GO:0009743 | Colorectum | AD | response to carbohydrate | 86/3918 | 253/18723 | 8.43e-07 | 2.90e-05 | 86 |
| GO:0009132 | Colorectum | AD | nucleoside diphosphate metabolic process | 49/3918 | 124/18723 | 1.75e-06 | 5.31e-05 | 49 |
| GO:0046939 | Colorectum | AD | nucleotide phosphorylation | 42/3918 | 101/18723 | 1.99e-06 | 5.92e-05 | 42 |
| GO:0034284 | Colorectum | AD | response to monosaccharide | 76/3918 | 225/18723 | 4.64e-06 | 1.23e-04 | 76 |
| GO:0016052 | Colorectum | AD | carbohydrate catabolic process | 56/3918 | 154/18723 | 7.01e-06 | 1.73e-04 | 56 |
| GO:0006165 | Colorectum | AD | nucleoside diphosphate phosphorylation | 40/3918 | 99/18723 | 8.02e-06 | 1.93e-04 | 40 |
| GO:0043467 | Colorectum | AD | regulation of generation of precursor metabolites and energy | 49/3918 | 130/18723 | 8.33e-06 | 1.99e-04 | 49 |
| GO:0033500 | Colorectum | AD | carbohydrate homeostasis | 84/3918 | 259/18723 | 9.10e-06 | 2.15e-04 | 84 |
| GO:0009746 | Colorectum | AD | response to hexose | 73/3918 | 219/18723 | 1.20e-05 | 2.65e-04 | 73 |
| GO:0010563 | Colorectum | AD | negative regulation of phosphorus metabolic process | 130/3918 | 442/18723 | 1.26e-05 | 2.76e-04 | 130 |
| GO:0009749 | Colorectum | AD | response to glucose | 71/3918 | 212/18723 | 1.31e-05 | 2.85e-04 | 71 |
| GO:0042593 | Colorectum | AD | glucose homeostasis | 83/3918 | 258/18723 | 1.44e-05 | 3.11e-04 | 83 |
| GO:0001678 | Colorectum | AD | cellular glucose homeostasis | 60/3918 | 172/18723 | 1.49e-05 | 3.18e-04 | 60 |
| GO:0045936 | Colorectum | AD | negative regulation of phosphate metabolic process | 129/3918 | 441/18723 | 1.81e-05 | 3.76e-04 | 129 |
| GO:0071322 | Colorectum | AD | cellular response to carbohydrate stimulus | 56/3918 | 163/18723 | 4.61e-05 | 7.97e-04 | 56 |
| GO:0006631 | Colorectum | AD | fatty acid metabolic process | 114/3918 | 390/18723 | 5.58e-05 | 9.44e-04 | 114 |
| GO:0071333 | Colorectum | AD | cellular response to glucose stimulus | 52/3918 | 151/18723 | 7.88e-05 | 1.25e-03 | 52 |
| GO:0042326 | Colorectum | AD | negative regulation of phosphorylation | 112/3918 | 385/18723 | 8.02e-05 | 1.27e-03 | 112 |
| Page: 1 2 3 4 5 6 7 8 9 10 11 12 13 14 15 16 17 18 19 20 21 |
| Pathway ID | Tissue | Disease Stage | Description | Gene Ratio | Bg Ratio | pvalue | p.adjust | qvalue | Count |
| hsa04932210 | Esophagus | ESCC | Non-alcoholic fatty liver disease | 122/4205 | 155/8465 | 5.69e-14 | 1.59e-12 | 8.14e-13 | 122 |
| hsa049318 | Esophagus | ESCC | Insulin resistance | 69/4205 | 108/8465 | 1.92e-03 | 5.54e-03 | 2.84e-03 | 69 |
| hsa0493238 | Esophagus | ESCC | Non-alcoholic fatty liver disease | 122/4205 | 155/8465 | 5.69e-14 | 1.59e-12 | 8.14e-13 | 122 |
| hsa0493113 | Esophagus | ESCC | Insulin resistance | 69/4205 | 108/8465 | 1.92e-03 | 5.54e-03 | 2.84e-03 | 69 |
| hsa0493222 | Liver | Cirrhotic | Non-alcoholic fatty liver disease | 106/2530 | 155/8465 | 2.16e-23 | 2.40e-21 | 1.48e-21 | 106 |
| hsa0493232 | Liver | Cirrhotic | Non-alcoholic fatty liver disease | 106/2530 | 155/8465 | 2.16e-23 | 2.40e-21 | 1.48e-21 | 106 |
| hsa0493242 | Liver | HCC | Non-alcoholic fatty liver disease | 124/4020 | 155/8465 | 4.54e-17 | 2.54e-15 | 1.41e-15 | 124 |
| hsa0493121 | Liver | HCC | Insulin resistance | 77/4020 | 108/8465 | 3.89e-07 | 4.46e-06 | 2.48e-06 | 77 |
| hsa0493252 | Liver | HCC | Non-alcoholic fatty liver disease | 124/4020 | 155/8465 | 4.54e-17 | 2.54e-15 | 1.41e-15 | 124 |
| hsa0493131 | Liver | HCC | Insulin resistance | 77/4020 | 108/8465 | 3.89e-07 | 4.46e-06 | 2.48e-06 | 77 |
| hsa0493228 | Oral cavity | OSCC | Non-alcoholic fatty liver disease | 124/3704 | 155/8465 | 1.22e-20 | 1.37e-18 | 6.96e-19 | 124 |
| hsa049317 | Oral cavity | OSCC | Insulin resistance | 60/3704 | 108/8465 | 8.66e-03 | 1.97e-02 | 1.00e-02 | 60 |
| hsa04932112 | Oral cavity | OSCC | Non-alcoholic fatty liver disease | 124/3704 | 155/8465 | 1.22e-20 | 1.37e-18 | 6.96e-19 | 124 |
| hsa0493112 | Oral cavity | OSCC | Insulin resistance | 60/3704 | 108/8465 | 8.66e-03 | 1.97e-02 | 1.00e-02 | 60 |
| hsa0493229 | Oral cavity | LP | Non-alcoholic fatty liver disease | 101/2418 | 155/8465 | 1.53e-21 | 6.37e-20 | 4.10e-20 | 101 |
| hsa0493237 | Oral cavity | LP | Non-alcoholic fatty liver disease | 101/2418 | 155/8465 | 1.53e-21 | 6.37e-20 | 4.10e-20 | 101 |
| Page: 1 |
Top |
Cell-cell communication analysis |
| Identification of potential cell-cell interactions between two cell types and their ligand-receptor pairs for different disease states |
| Ligand | Receptor | LRpair | Pathway | Tissue | Disease Stage |
| Page: 1 |
Top |
Single-cell gene regulatory network inference analysis |
| Find out the significant the regulons (TFs) and the target genes of each regulon across cell types for different disease states |
| TF | Cell Type | Tissue | Disease Stage | Target Gene | RSS | Regulon Activity |
| MLX | LUMP | Breast | Healthy | MZF1,L3HYPDH,PDZD11, etc. | 3.99e-01 |  |
| MLX | M2MAC | Breast | IDC | NFATC1,CD109,NDUFA10, etc. | 5.40e-02 |  |
| MLX | ICAF | Cervix | CC | PCF11-AS1,LEFTY2,GOLGA6L10, etc. | 1.96e-01 |  |
| MLX | LYMEND | Esophagus | Healthy | CSF3,FAM227B,H1FX, etc. | 8.04e-02 |  |
| MLX | MSC.ADIPO | Lung | ADJ | GNB5,ZSWIM4,ACOX3, etc. | 5.10e-01 |  |
| MLX | MSC.ADIPO | Lung | AIS | GNB5,ZSWIM4,ACOX3, etc. | 4.28e-01 |  |
| MLX | ECC | Skin | Healthy | APOC1,VARS,SLC3A2, etc. | 2.13e-01 |  |
| MLX | PVA | Thyroid | goiters | DIRAS3,PTPRF,MTPAP, etc. | 5.44e-02 |  |
| MLX | MSC.MVA | Thyroid | PTC | DIRAS3,PTPRF,MTPAP, etc. | 3.39e-01 |  |
| MLX | END | Thyroid | PTC | DIRAS3,PTPRF,MTPAP, etc. | 6.91e-02 | |
| ∗The dot plots of a searched regulon are shown for all cell subpopulations in each disease state of each tissue based on the regulon specific score inferred using pySCENIC and by calculating the average expression. |
| Page: 1 |
Top |
Somatic mutation of malignant transformation related genes |
| Annotation of somatic variants for genes involved in malignant transformation |
| Hugo Symbol | Variant Class | Variant Classification | dbSNP RS | HGVSc | HGVSp | HGVSp Short | SWISSPROT | BIOTYPE | SIFT | PolyPhen | Tumor Sample Barcode | Tissue | Histology | Sex | Age | Stage | Therapy Types | Drugs | Outcome |
| MLX | SNV | Missense_Mutation | novel | c.773N>T | p.Ser258Leu | p.S258L | Q9UH92 | protein_coding | deleterious(0) | benign(0.358) | TCGA-BH-A2L8-01 | Breast | breast invasive carcinoma | Female | <65 | I/II | Chemotherapy | cytoxan | CR |
| MLX | SNV | Missense_Mutation | c.350N>T | p.Tyr117Phe | p.Y117F | Q9UH92 | protein_coding | tolerated(0.29) | benign(0.438) | TCGA-E2-A1LS-01 | Breast | breast invasive carcinoma | Female | <65 | I/II | Unspecific | Cyclophosphamide | SD | |
| MLX | SNV | Missense_Mutation | c.703G>C | p.Asp235His | p.D235H | Q9UH92 | protein_coding | deleterious(0) | probably_damaging(0.99) | TCGA-E9-A1R4-01 | Breast | breast invasive carcinoma | Female | >=65 | I/II | Chemotherapy | 5-fluorouracil | SD | |
| MLX | insertion | Frame_Shift_Ins | novel | c.813_814insACCCTAGGGGG | p.Trp272ThrfsTer19 | p.W272Tfs*19 | Q9UH92 | protein_coding | TCGA-BH-A0B8-01 | Breast | breast invasive carcinoma | Female | <65 | I/II | Hormone Therapy | arimidex | SD | ||
| MLX | SNV | Missense_Mutation | c.520N>A | p.Ala174Thr | p.A174T | Q9UH92 | protein_coding | deleterious(0.03) | probably_damaging(0.948) | TCGA-FU-A3HZ-01 | Cervix | cervical & endocervical cancer | Female | <65 | I/II | Chemotherapy | cisplatin | CR | |
| MLX | SNV | Missense_Mutation | rs759737992 | c.430G>A | p.Ala144Thr | p.A144T | Q9UH92 | protein_coding | deleterious(0.01) | possibly_damaging(0.835) | TCGA-AA-3715-01 | Colorectum | colon adenocarcinoma | Male | >=65 | I/II | Unknown | Unknown | PD |
| MLX | SNV | Missense_Mutation | c.800C>T | p.Ala267Val | p.A267V | Q9UH92 | protein_coding | deleterious(0.04) | possibly_damaging(0.709) | TCGA-AA-A010-01 | Colorectum | colon adenocarcinoma | Female | <65 | I/II | Chemotherapy | folinic | CR | |
| MLX | SNV | Missense_Mutation | c.433A>T | p.Ile145Phe | p.I145F | Q9UH92 | protein_coding | deleterious(0) | possibly_damaging(0.904) | TCGA-CK-4951-01 | Colorectum | colon adenocarcinoma | Female | >=65 | I/II | Unknown | Unknown | PD | |
| MLX | SNV | Missense_Mutation | rs759737992 | c.430N>A | p.Ala144Thr | p.A144T | Q9UH92 | protein_coding | deleterious(0.01) | possibly_damaging(0.835) | TCGA-DC-4749-01 | Colorectum | rectum adenocarcinoma | Male | <65 | I/II | Unknown | Unknown | SD |
| MLX | SNV | Missense_Mutation | novel | c.304N>G | p.Thr102Ala | p.T102A | Q9UH92 | protein_coding | deleterious(0.01) | benign(0.057) | TCGA-A5-A0G1-01 | Endometrium | uterine corpus endometrioid carcinoma | Female | >=65 | I/II | Unknown | Unknown | SD |
| Page: 1 2 3 4 |
Top |
Related drugs of malignant transformation related genes |
| Identification of chemicals and drugs interact with genes involved in malignant transfromation |
| (DGIdb 4.0) |
| Entrez ID | Symbol | Category | Interaction Types | Drug Claim Name | Drug Name | PMIDs |
| Page: 1 |

Copyright 2023-Present -The University of Texas Health Science Center at Houston |