
|
|||||
|
 | |
| |
| |
| |
| |
| |
|
Gene: MIS18A |
Gene summary for MIS18A |
| Gene information | Species | Human | Gene symbol | MIS18A | Gene ID | 54069 |
| Gene name | MIS18 kinetochore protein A | |
| Gene Alias | B28 | |
| Cytomap | 21q22.11 | |
| Gene Type | protein-coding | GO ID | GO:0006139 | UniProtAcc | Q9NYP9 |
Top |
Malignant transformation analysis |
| Identification of the aberrant gene expression in precancerous and cancerous lesions by comparing the gene expression of stem-like cells in diseased tissues with normal stem cells |
| Entrez ID | Symbol | Replicates | Species | Organ | Tissue | Adj P-value | Log2FC | Malignancy |
| 54069 | MIS18A | LZE7T | Human | Esophagus | ESCC | 4.85e-04 | 3.57e-01 | 0.0667 |
| 54069 | MIS18A | LZE20T | Human | Esophagus | ESCC | 2.66e-04 | 9.52e-02 | 0.0662 |
| 54069 | MIS18A | LZE24T | Human | Esophagus | ESCC | 2.17e-03 | 6.29e-02 | 0.0596 |
| 54069 | MIS18A | P1T-E | Human | Esophagus | ESCC | 2.03e-04 | 2.20e-01 | 0.0875 |
| 54069 | MIS18A | P2T-E | Human | Esophagus | ESCC | 1.96e-25 | 5.34e-01 | 0.1177 |
| 54069 | MIS18A | P4T-E | Human | Esophagus | ESCC | 3.25e-36 | 9.00e-01 | 0.1323 |
| 54069 | MIS18A | P5T-E | Human | Esophagus | ESCC | 1.98e-19 | 4.42e-01 | 0.1327 |
| 54069 | MIS18A | P8T-E | Human | Esophagus | ESCC | 2.65e-13 | 1.55e-01 | 0.0889 |
| 54069 | MIS18A | P9T-E | Human | Esophagus | ESCC | 8.71e-05 | 1.57e-01 | 0.1131 |
| 54069 | MIS18A | P10T-E | Human | Esophagus | ESCC | 7.84e-24 | 4.82e-01 | 0.116 |
| 54069 | MIS18A | P11T-E | Human | Esophagus | ESCC | 2.04e-04 | 1.20e-01 | 0.1426 |
| 54069 | MIS18A | P12T-E | Human | Esophagus | ESCC | 1.10e-15 | 2.54e-01 | 0.1122 |
| 54069 | MIS18A | P15T-E | Human | Esophagus | ESCC | 4.23e-05 | 1.23e-01 | 0.1149 |
| 54069 | MIS18A | P16T-E | Human | Esophagus | ESCC | 1.56e-14 | 3.18e-01 | 0.1153 |
| 54069 | MIS18A | P17T-E | Human | Esophagus | ESCC | 3.86e-08 | 1.96e-01 | 0.1278 |
| 54069 | MIS18A | P21T-E | Human | Esophagus | ESCC | 2.33e-14 | 2.52e-01 | 0.1617 |
| 54069 | MIS18A | P22T-E | Human | Esophagus | ESCC | 5.86e-12 | 2.63e-01 | 0.1236 |
| 54069 | MIS18A | P23T-E | Human | Esophagus | ESCC | 3.38e-08 | 1.77e-01 | 0.108 |
| 54069 | MIS18A | P24T-E | Human | Esophagus | ESCC | 2.09e-09 | 2.03e-01 | 0.1287 |
| 54069 | MIS18A | P26T-E | Human | Esophagus | ESCC | 8.15e-13 | 2.74e-01 | 0.1276 |
| Page: 1 2 3 4 |
| Tissue | Expression Dynamics | Abbreviation |
| Esophagus | 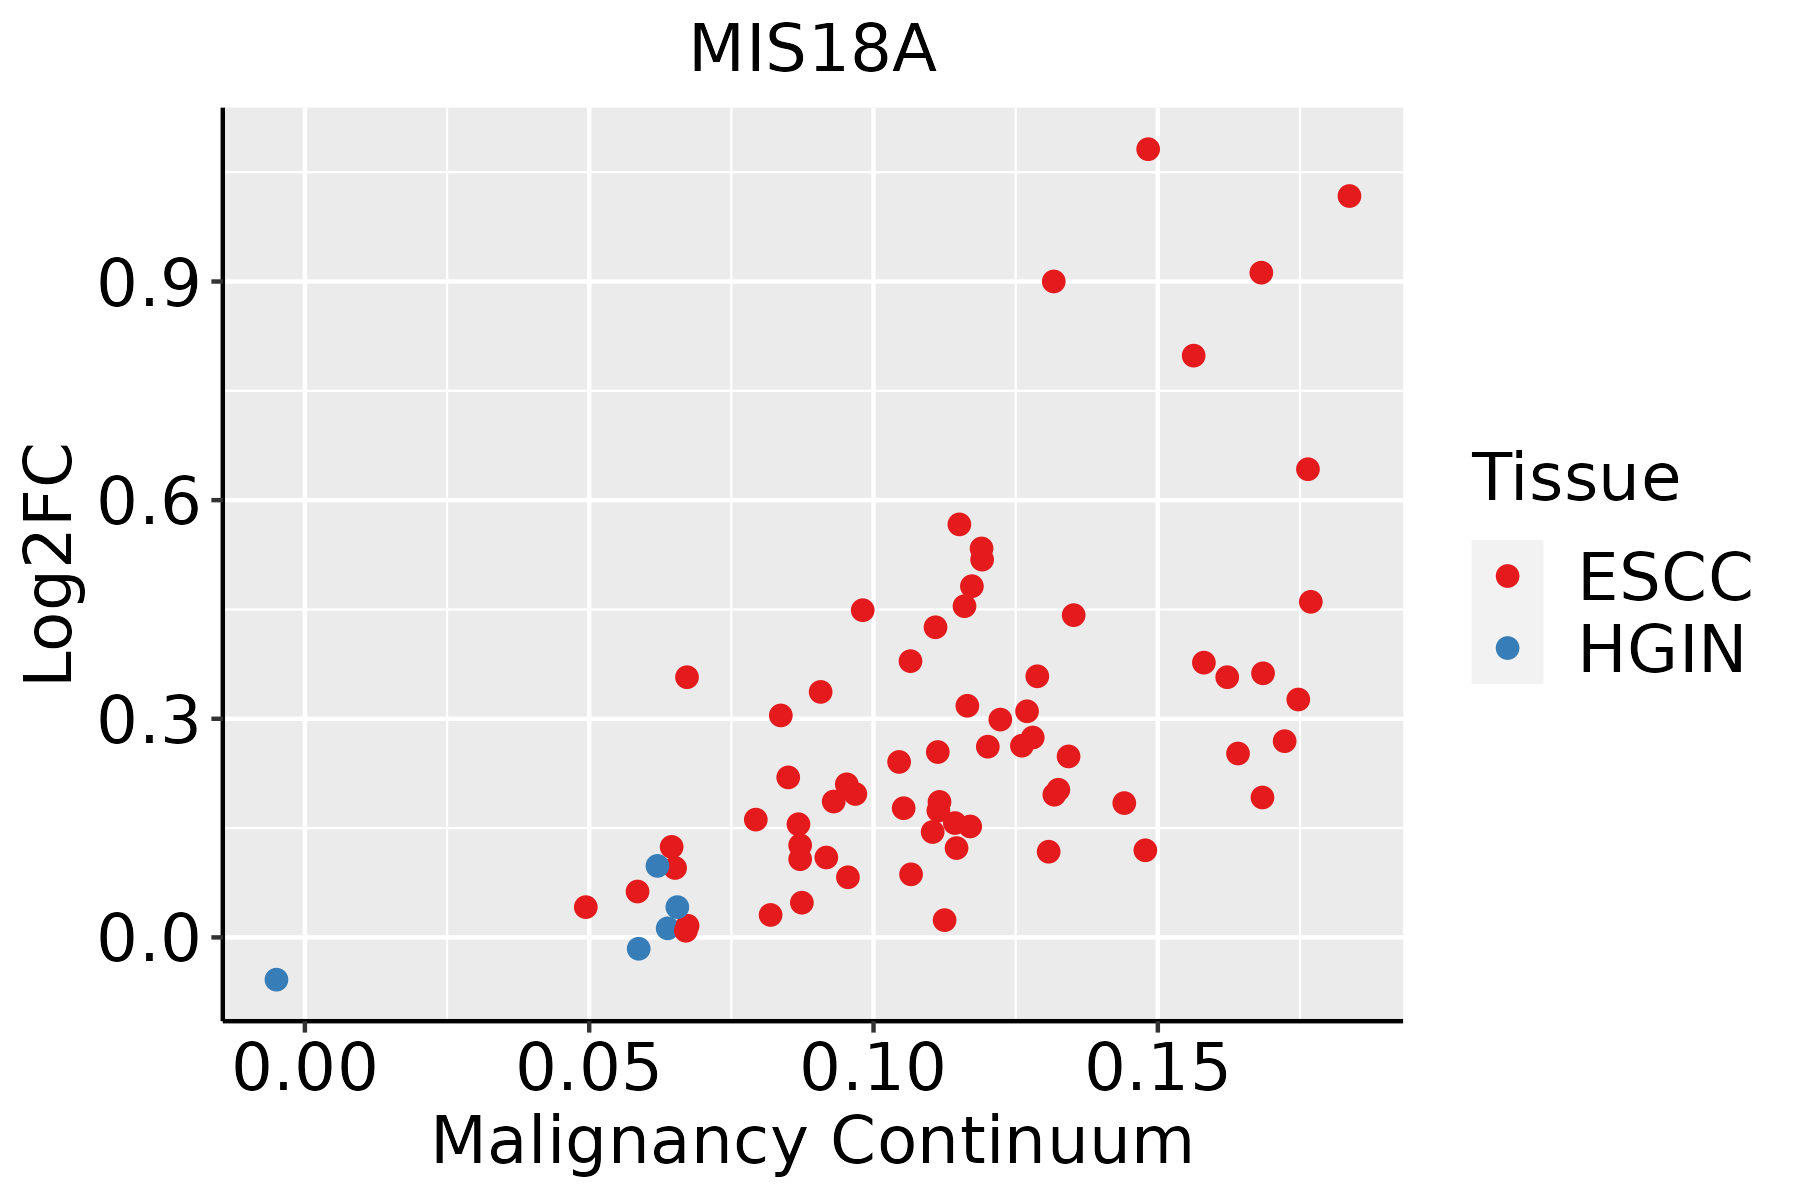 | ESCC: Esophageal squamous cell carcinoma |
| HGIN: High-grade intraepithelial neoplasias | ||
| LGIN: Low-grade intraepithelial neoplasias | ||
| Oral Cavity |  | EOLP: Erosive Oral lichen planus |
| LP: leukoplakia | ||
| NEOLP: Non-erosive oral lichen planus | ||
| OSCC: Oral squamous cell carcinoma | ||
| Thyroid | 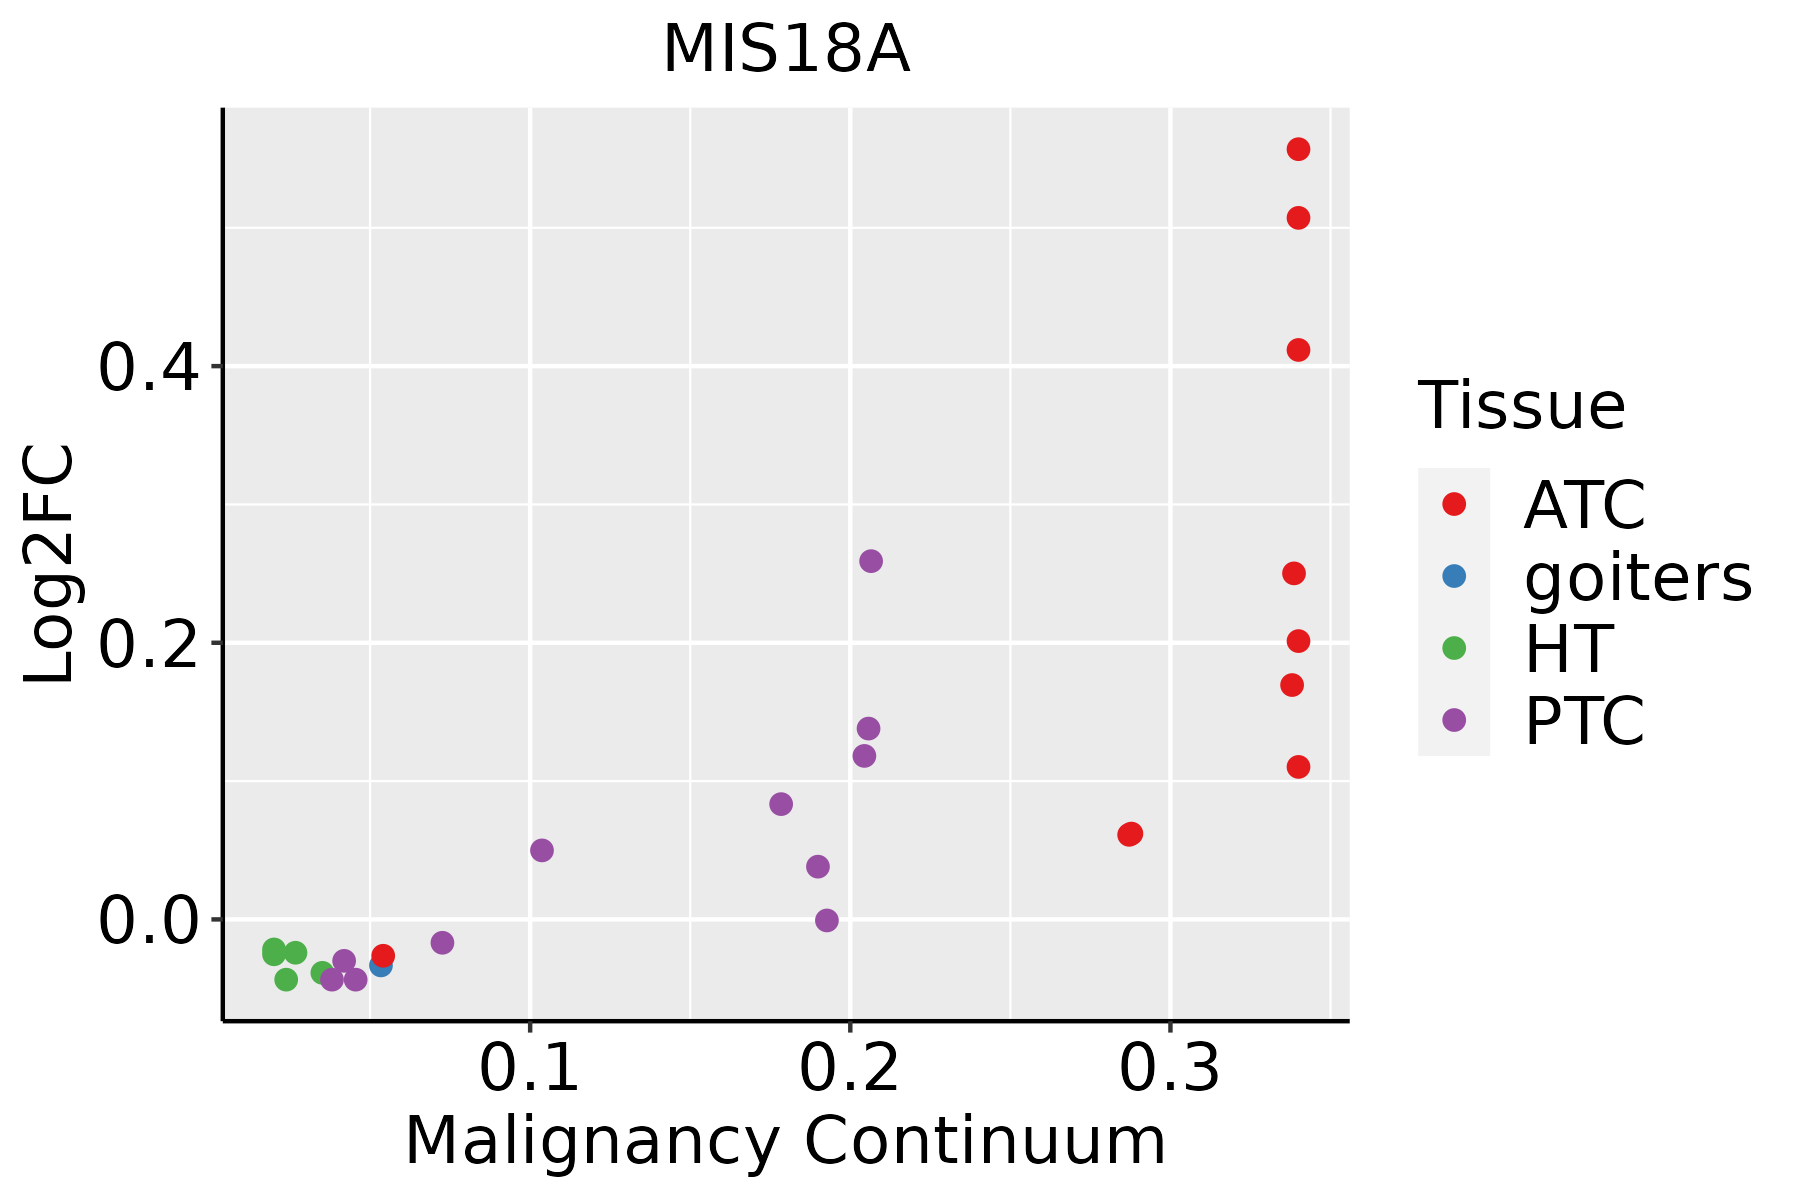 | ATC: Anaplastic thyroid cancer |
| HT: Hashimoto's thyroiditis | ||
| PTC: Papillary thyroid cancer |
| ∗log2FC in expression of this searched gene in stem-like cells from each diseased tissue sample relative to stem-like cells in normal samples in each tissue plotted against the malignancy continuum. Samples are colored based on if they are from different disease stage. |
Top |
Malignant transformation related pathway analysis |
| Find out the enriched GO biological processes and KEGG pathways involved in transition from healthy to precancer to cancer |
| Tissue | Disease Stage | Enriched GO biological Processes |
| Colorectum | AD |  |
| Colorectum | SER |  |
| Colorectum | MSS |  |
| Colorectum | MSI-H |  |
| Colorectum | FAP |  |
| ∗Top 15 enriched GO BP terms are showed in the bar plot of each disease state in each tissue. Each row represents a significant GO biological process which is colored according to the -log10(p.adjust). |
| Page: 1 2 3 4 5 6 7 8 9 |
| GO ID | Tissue | Disease Stage | Description | Gene Ratio | Bg Ratio | pvalue | p.adjust | Count |
| GO:00322594 | Thyroid | PTC | methylation | 146/5968 | 364/18723 | 4.99e-04 | 3.26e-03 | 146 |
| GO:00063385 | Thyroid | PTC | chromatin remodeling | 106/5968 | 255/18723 | 6.56e-04 | 4.13e-03 | 106 |
| GO:00434145 | Thyroid | PTC | macromolecule methylation | 127/5968 | 316/18723 | 1.02e-03 | 6.07e-03 | 127 |
| GO:000705913 | Thyroid | ATC | chromosome segregation | 183/6293 | 346/18723 | 8.03e-14 | 4.23e-12 | 183 |
| GO:005105219 | Thyroid | ATC | regulation of DNA metabolic process | 183/6293 | 359/18723 | 5.97e-12 | 2.30e-10 | 183 |
| GO:0006325110 | Thyroid | ATC | chromatin organization | 189/6293 | 409/18723 | 6.40e-08 | 1.13e-06 | 189 |
| GO:00345083 | Thyroid | ATC | centromere complex assembly | 20/6293 | 30/18723 | 2.18e-04 | 1.43e-03 | 20 |
| GO:000633813 | Thyroid | ATC | chromatin remodeling | 109/6293 | 255/18723 | 1.38e-03 | 7.15e-03 | 109 |
| GO:00718242 | Thyroid | ATC | protein-DNA complex subunit organization | 103/6293 | 241/18723 | 1.84e-03 | 9.03e-03 | 103 |
| GO:004341412 | Thyroid | ATC | macromolecule methylation | 131/6293 | 316/18723 | 2.01e-03 | 9.60e-03 | 131 |
| GO:003225911 | Thyroid | ATC | methylation | 148/6293 | 364/18723 | 2.69e-03 | 1.23e-02 | 148 |
| Page: 1 2 |
| Pathway ID | Tissue | Disease Stage | Description | Gene Ratio | Bg Ratio | pvalue | p.adjust | qvalue | Count |
| Page: 1 |
Top |
Cell-cell communication analysis |
| Identification of potential cell-cell interactions between two cell types and their ligand-receptor pairs for different disease states |
| Ligand | Receptor | LRpair | Pathway | Tissue | Disease Stage |
| Page: 1 |
Top |
Single-cell gene regulatory network inference analysis |
| Find out the significant the regulons (TFs) and the target genes of each regulon across cell types for different disease states |
| TF | Cell Type | Tissue | Disease Stage | Target Gene | RSS | Regulon Activity |
| ∗The dot plots of a searched regulon are shown for all cell subpopulations in each disease state of each tissue based on the regulon specific score inferred using pySCENIC and by calculating the average expression. |
| Page: 1 |
Top |
Somatic mutation of malignant transformation related genes |
| Annotation of somatic variants for genes involved in malignant transformation |
| Hugo Symbol | Variant Class | Variant Classification | dbSNP RS | HGVSc | HGVSp | HGVSp Short | SWISSPROT | BIOTYPE | SIFT | PolyPhen | Tumor Sample Barcode | Tissue | Histology | Sex | Age | Stage | Therapy Types | Drugs | Outcome |
| MIS18A | SNV | Missense_Mutation | rs764293569 | c.424G>A | p.Ala142Thr | p.A142T | Q9NYP9 | protein_coding | tolerated(0.9) | benign(0) | TCGA-A6-5661-01 | Colorectum | colon adenocarcinoma | Female | >=65 | I/II | Unknown | Unknown | SD |
| MIS18A | SNV | Missense_Mutation | c.656T>G | p.Leu219Arg | p.L219R | Q9NYP9 | protein_coding | deleterious(0) | probably_damaging(0.999) | TCGA-A6-6781-01 | Colorectum | colon adenocarcinoma | Male | <65 | III/IV | Chemotherapy | oxaliplatin | SD | |
| MIS18A | SNV | Missense_Mutation | c.122N>A | p.Arg41His | p.R41H | Q9NYP9 | protein_coding | tolerated_low_confidence(0.06) | benign(0.067) | TCGA-AD-5900-01 | Colorectum | colon adenocarcinoma | Male | >=65 | I/II | Unknown | Unknown | SD | |
| MIS18A | SNV | Missense_Mutation | rs754925175 | c.464N>T | p.Thr155Met | p.T155M | Q9NYP9 | protein_coding | deleterious(0) | probably_damaging(0.999) | TCGA-A5-A3LO-01 | Endometrium | uterine corpus endometrioid carcinoma | Female | <65 | I/II | Chemotherapy | carboplatin | SD |
| MIS18A | SNV | Missense_Mutation | novel | c.35G>A | p.Gly12Glu | p.G12E | Q9NYP9 | protein_coding | tolerated_low_confidence(0.3) | benign(0.01) | TCGA-AP-A054-01 | Endometrium | uterine corpus endometrioid carcinoma | Female | <65 | III/IV | Chemotherapy | carboplatin | PD |
| MIS18A | SNV | Missense_Mutation | c.122N>A | p.Arg41His | p.R41H | Q9NYP9 | protein_coding | tolerated_low_confidence(0.06) | benign(0.067) | TCGA-AX-A1C4-01 | Endometrium | uterine corpus endometrioid carcinoma | Female | <65 | I/II | Unknown | Unknown | SD | |
| MIS18A | SNV | Missense_Mutation | novel | c.98N>G | p.Lys33Arg | p.K33R | Q9NYP9 | protein_coding | tolerated_low_confidence(0.93) | benign(0.003) | TCGA-EO-A3KX-01 | Endometrium | uterine corpus endometrioid carcinoma | Female | >=65 | I/II | Unknown | Unknown | SD |
| MIS18A | SNV | Missense_Mutation | novel | c.213N>T | p.Glu71Asp | p.E71D | Q9NYP9 | protein_coding | tolerated(0.15) | benign(0.04) | TCGA-99-8032-01 | Lung | lung adenocarcinoma | Male | <65 | I/II | Unknown | Unknown | SD |
| MIS18A | SNV | Missense_Mutation | c.511N>A | p.Glu171Lys | p.E171K | Q9NYP9 | protein_coding | tolerated(0.25) | benign(0.153) | TCGA-60-2698-01 | Lung | lung squamous cell carcinoma | Male | <65 | I/II | Chemotherapy | mithramycin | PD | |
| MIS18A | insertion | Frame_Shift_Ins | novel | c.644_645insCACTATGTTGCTTCATTTA | p.Leu215PhefsTer24 | p.L215Ffs*24 | Q9NYP9 | protein_coding | TCGA-56-8504-01 | Lung | lung squamous cell carcinoma | Male | >=65 | I/II | Unknown | Unknown | SD |
| Page: 1 2 |
Top |
Related drugs of malignant transformation related genes |
| Identification of chemicals and drugs interact with genes involved in malignant transfromation |
| (DGIdb 4.0) |
| Entrez ID | Symbol | Category | Interaction Types | Drug Claim Name | Drug Name | PMIDs |
| Page: 1 |

Copyright 2023-Present -The University of Texas Health Science Center at Houston |